Research Article: 2021 Vol: 25 Issue: 5
Water and Carbon Footprint of Pizza Crust Wastage: A Case In An Emerging Economy
Smitu Malhotra, XLRI, Jamshedpur, India
Divya Saroja Chayanam, XLRI, Jamshedpur, India
Citation Information: Malhotra., S. & Chayanam, D.S. (2021). water and carbon footprint of pizza crust wastage: a case in an emerging economy. Academy of Marketing Studies Journal, 25(5), 1-14.
Abstract
Globalization and increased disposable income amongst middle class Indians have increased the consumption of high calorie fast foods (Sanand, 2019). In addition to change in food consumption habits, the rising middle class quite often wastes part of the food (Rao, 2015). Food wastage comes with its share of carbon and water footprint (Aich and Ghosh, 2016). This study aims at estimating the water and carbon footprint for one such fast food which has gained popularity in India: the pizza. A two-step methodology (survey followed by observations), to understand pizza consumption and the habitual wastage behavior of the cosmopolitan middle income population of India, was used. The study found that the consumption is around 0.8 âÂ?Â?large pizzaâÂ?Â? equivalent per month per pizza consuming individual while the wastage of the pizza crust works up to 0.31 of âÂ?Â?large pizzasâÂ?Â? per individual. This translates into a water footprint of 20.28 liters of green water, 5.16 liters of blue water and 6.77 liters of grey water, adding up to a total water footprint of 32.21 liters per pizza consuming individual in India, per month. In addition, pizza crust waste would have a carbon footprint of 0.43 kg of carbon dioxide per pizza consuming Indian, per month. The research recommends flavoring the crust to reduce wastage.
Keywords
Water Footprint, Carbon Footprint, fast foods, food wastage, pizza crust, India.
Introduction
In India, post liberalization, the dietary choices/food habits of the Indian lot have undergone a change due to the impact of globalization and an increased disposable income in hand. People have started to consume more of fancy fast foods with high calorific content (Solomons, 1995, et al. 2019). This group of neo-consumers, estimated at 45% of the population of India, account for 39% of consumption expenditure (Singhi & Jain, 2016). Gauba (2015) infers that with the expanding job opportunities for the youth, the growth of the economy, the emergence of dual income families, and an increased exposure to different cultures, the traditional Indian consumer began exploring diverse cuisines. The surge in the number of working women has also led to a greater demand for processed and ready-to-eat food products in India (Bullis, 1997; International Trade Administration, 2000). The preference for fast foods over customary Indian food has gained traction (Sriram, 2014). For example, a dinner for an Indian family could now consist of soup and pizza, a menu that was unthinkable even in the early 1990s. India?s quick-service restaurant segment, which was estimated to be USD 968 million in 2015 (Whitehead, 2015), is expected to grow at a compound annual rate of 18% between 2001-25 (Globe Newswire, 2020).
Research has shown that this shift in the food system has resulted in significant negative environmental outcomes, one such being global warming (Campbell-Arvai, 2015). Global food production accounts for 26 % of greenhouse gas emissions (Hannah & Roser, 2020) and about 6000 km3 of water footprint (Rekonnen & Gerbens-Leenes, 2020) for review of water footprint studies). India?s food production accounts for 15% of the total global water footprint and 31% of unsustainable blue water footprint (Mekonnen & Gerbens-Leenes, 2020). Studies have also documented that processed food utilize more energy and resources during the production process as compared to traditional food (Carlsson-Kanyama et al., 2003; Pelletier et al., 2011; Garnett, 2011).
Over and above changes in food consumption habits, the rising middle class have the tendency to waste part of the food. A study in 2012 claimed that ?about 943 tonnes of high-calorie quality food? estimated at INR 339 crore (USD 52 million) is wasted during marriages in Bangalore (Vyas, 2012). Rao (2015) reported that nearly a tonne of food is wasted at an average every day at the Indian Institute of Technology, Mumbai. The ET Bureau (2016) estimates that the food wasted annually in India is equivalent to the total food consumption of the United Kingdom. The study also states that if the value of the food wasted is invested at a 10 % compounded rate of return, it will fetch a return of INR 4 million (0.65 million USD) in 30 years. Notwithstanding the monetary loss, food waste has grave environmental consequences. The Sustainable Development Goal 12.3 therefore aims to ?halve per capita global food waste at the retail and consumer levels? (Khadka, 2017).
Research Objective
While consumers could be aware that their behavior contributes to climate change, they may not want to sacrifice their lifestyle to rectify any negative issue. There is therefore, a need to identify small behavioral changes which can enable them to work towards it. This study is an attempt in this direction. This paper aims to provide a rough quantification that would prompt individuals initiate changes in behavior to contribute their bit towards environmental protection. The reason we have chosen pizza is because (a) the Indian middle class is increasingly consuming pizza and (b) the waste (pizza crust) is identifiable and quantifiable.
The next section presents literature review that highlights the environmental impact caused by food wastage and pizza consumption in India. The subsequent section describes the methodology for data collection and the process by which the water and carbon footprint is estimated. The section that follows presents the findings and leads to the discussion and conclusion.
Literature Review
Food Wastage and Environmental Impact
Food wastage is a global problem. The Food and Agriculture Organization (FAO) estimates that annually around ?1.7 billion tonnes or almost one third of the total food produced is wasted globally? (Bordoloi, 2016).
India is ranked seventh in terms of food wastage (Daily Pioneer, 2016) and approximately USD 4.97 billion worth of food is wasted during the consumption process (Bordoloi, 2016).
In landfills, decaying food is the single largest source that creates methane (a greenhouse gas) (Lee, 2015). Food waste generates eight per cent of the total greenhouse gases (4.4 gigatonnes of CO2 annually), approximately 87 per cent of the greenhouses gases emitted by the transport sector (Pandey 2016). This may increase four fold by 2050 (DTE staff 2016). Aich & Ghosh (2016) also estimated that about 250 km3 of water is used during the production of food that is wasted.
This is estimated to have an economic cost of USD one trillion, environmental cost of USD 700 billion and social cost of USD 900 billion per year (Bordoloi, 2016).
Pizza Consumption in India
In India, pizza as a food segment has recorded a steady growth over the last few years and thereby attracted many foreign players. The pizza market in India, growing at a compound annual rate of 26%, was worth around INR 1500 crores in 2013 (Pizza Power, 2013 quoted in MBA Rendezvous, 2013) and more than doubled to INR 3,000-3,500 crore (USD 500 million) in 2016 (Kumar, 2016). Euromonitor has postulated that the pizza market has grown to USD 1.5 billion in 2019 (Geeter, 2020).
A sizeable increase in disposable incomes and preference for western fast foods is driving the demand for pizzas. As a result, companies are not only augmenting their product offerings but also expanding marketing activities to penetrate Tier-II and Tier-III cities as well.
Pizza Crust
The pizza topping covers the entire pizza except for the outermost part along the circumference. This outermost part that is not covered by the topping is generally thicker in order to prevent the cheese from flowing out when heated. It has been found that people do not consume this outer part because it is just plain bread that is thicker, drier and not as tasty as the rest of the pizza. Pizza lovers use the term cornicione for the dry and crusty outer edge, but for easy reference, we will use the word ?crust? to refer to it.
Methodology
The objective of the study being a rough indication of the water and carbon footprint of pizza crust wastage vis a vis an accurate scientific reading, a two stage methodology to understand pizza consumption behavior similar to the one endorsed by Prabhavathi et al. (2014), was adopted. Initially, a survey was conducted amongst the cosmopolitan middle income population of India to understand their pizza consumption and pizza crust waste behavior. Since the study focussed only on understanding preferences and consumption behavior, the survey did not include attitude based questions (the survey questionnaire is given in Annexure 1). The survey was supplemented by observations of actual pizza consumption behavior in a dine-out setting.
Sample
The sample consisted of 141 valid responses, the respondents belonging to different locations of India, various age groups and palate choices. 82 were in the age group of 15-25 years, 54 in the age group of 25-35 years and 5 in the age group of 35-50 years. The sample profile matches a typical walk into a pizza restaurant. For the purpose of calculations, only the two main age groups (15-25 years 82 respondents and 25-35 years 54 respondents) were taken into consideration.
Pizza Crust and Wastage
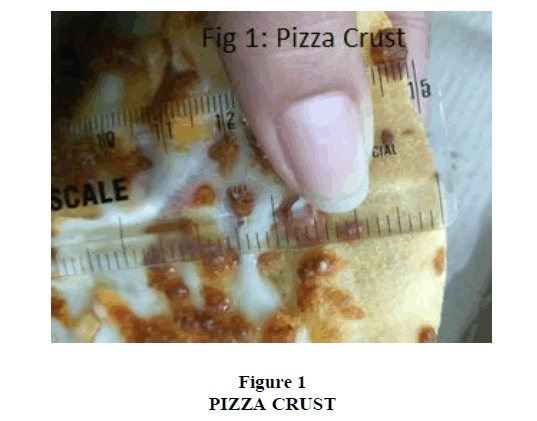
Since there is no standardization for making a pizza, we deliberated upon the crust size with the staff of two different pizza outlets. They maintained that the crust could be anything between 0.75 and one inch. We measured it and found the crust varying between 0.8 and 1.2 inches Figure 1. For this study, we have assumed a 1 inch crust width for a large pizza of 14 inches. Thus, for a pizza of 14 inches (153.94 sq. inches), the topping diameter would be 12 inches and the balance 1 inch on either side would form the outer crust (40.84 sq. inches)1.
During the same visit, we also studied the wastage behavior of customers. During an hour of our observation, 6 customers ordered 6 pizzas and all of them wasted the crust.
Water Footprint
Water footprint is defined as ?the sum of water used in the various steps of the production chain? (Hoekstra and Chapagain, 2008). Water footprint can be divided into the green, blue and grey domain, referring to the source of water and stands respectively for rainwater, stream water and polluted water sources. The Water Footprint Calculator (2020) found that the water footprint due to food consumption is higher than that of other activities (long showers etc) of an individual. The calculator also identified water footprint for different food items.
The basic margherita pizza consists of a flour base, a single sauce (tomato puree) and mozzarella cheese. Studies from different sources cite different figures for the amount/volume of water used in the process of making a pizza and also its ingredients. In this study, we use the water footprint for Italian Pizza calculated and presented in the UNESCO-IHE research report (Aldeya & Hoekstra, 2009). As we are considering pizza crust only, the water footprint of the ?bread wheat flour? part was used to calculate the water footprint of the wasted crust Table 1.
Table 1: Water Footprint for Pizza
| Ingredients | Weight (kg) | Water footprint per kilogram of pizza | |||
|---|---|---|---|---|---|
| Green | Blue | Grey | Total | ||
| Bread wheat flour | 0.3 | 605 | 154 | 202 | 961 |
| Tomato puree | 0.1 | 117 | 200 | 63 | 380 |
| Mozzarella | 0.125 | n.a | n.a | n.a | 7117 |
| Water | 0.2 | 0 | 1 | 0 | 1 |
| Total | 0.725 | ||||
| Bread wheat flour for large pizza equivalent | 0.980 | 817.8 | 208.2 | 273.1 | |
Source: Adopted from Aldeya and Hoekstra, 2009
Carbon Footprint
Carbon footprint is the measure of a ?product?s contribution to global warming through the emission of greenhouse gases throughout its lifecycle ? right from agriculture, through processing, packaging, retail to disposal? (Tesco, 2012). Different researches have used different methodologies to calculate the carbon footprint of products. The UK retail chain, Tesco, had put forward a report on the carbon footprint of different food products. Tesco?s ?family cheese and tomato pizza? had a carbon footprint of 440g carbon dioxide per 100g of pizza. This would translate to 4.3 kg of carbon footprint for a large pizza of 980 grams2. These values would be higher for frozen pizzas as there is a process of re-heating involved. In another report, Small World Consulting (2012) calculated the carbon footprint of different products for the UK retail chain, Booth. Their calculations have estimated that the carbon footprint of processed foods like pizzas is 6kg carbon dioxide per kilogram. For a 980 grams pizza, it would be 5.88 kg of CO2. To accomplish what we intend through this study, an average of the Tesco and Small World Consulting studies being 5.1 kg carbon dioxide per large pizza would be used.
The next section presents the findings from the survey.
Findings
Liking for Pizza
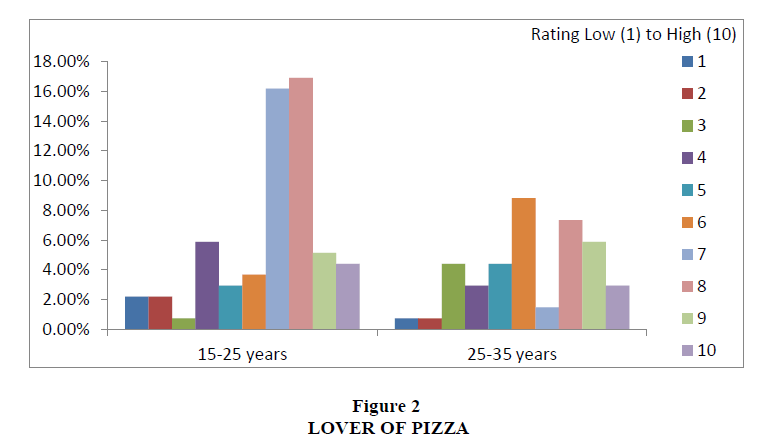
In general, the respondents (72.79%) have given a rating of more than 6 on a 10 point scale for their ?love for pizza? Figure 2. The 15-25 years age group has a higher preference for pizzas to the tune of 76.8% as against 66.67% for the 25-35 years age group. If a rating of 5 is added, the ?love for pizza? percent for the sample is enhanced to 80%.
Consumption of Pizza
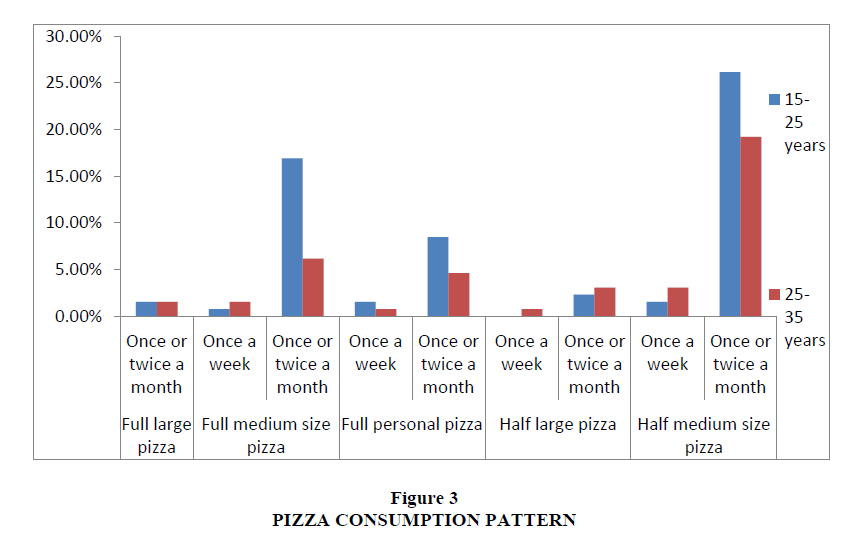
Figure 3 gives the consumption pattern for pizza. Since the study is not focusing on variations in consumer behavior, the consumption is converted to ?large pizza equivalent? per month Table 2. The consumption of pizzas for the sampled population translates into 108.54 ?large size pizzas equivalent? per month Annexure 2 for details. The ratio of consumption is around 60% by the younger age group and 40% by the older group. This implies that, on an average, a pizza consuming individual consumes 0.8 ?large pizza equivalent? per month.
Table 2: Pizza and Pizza Crust Area
| Type of Pizza | Inches | Pizza Area | Large pizza equivalent conversion ratio |
|---|---|---|---|
| Personal pizza | 8 | 50.26 | 0.326 |
| Medium | 12 | 113.10 | 0.734 |
| Large | 14 | 153.94 | 1 |
Source: Calculated using Pizza Calculator
These findings are within acceptable limits of fast food consumption studies in India. An ACNielsen survey found that an urban Indian consumes food from take-away restaurants atleast once a month; 37 per cent consuming the same as often as once a week. The study also states that India is among the top ten countries in terms of frequency of fast food consumption (Anand 2011). Prabhavathi et al. (2014) found that 45 per cent of the respondents consumed fast food thrice a month, while 34 per cent did so once a month and 13 per cent occasionally did.
Pizza Crust Wastage
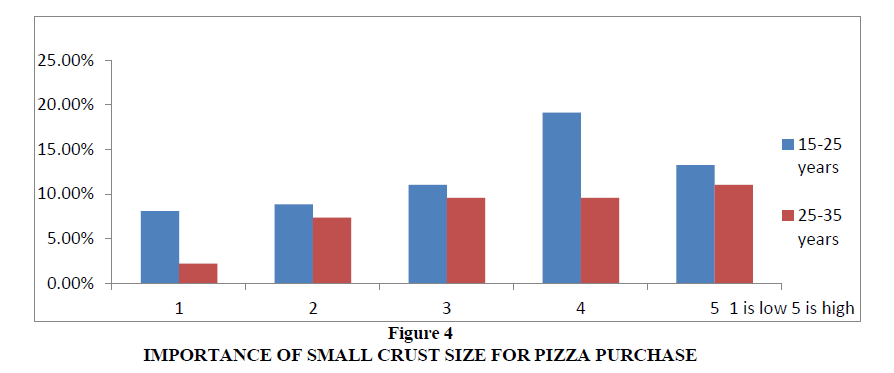
Figure 4 shows the importance of smaller crust size during the purchase of pizza. 53.19 % rate smaller crust to be important at 4 or 5. If rating of 3 is added then the figure goes up to 74.47%. So, it can be said that smaller crust size is an important attribute for purchase decision.
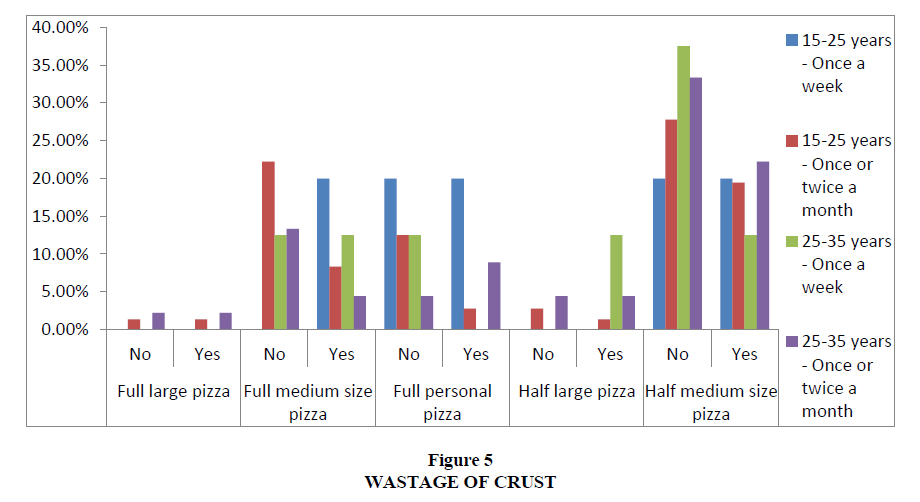
Figure 5 shows the number of people who waste the crust. 38.97% of the consumers leave (waste) the crust. Of these, 22.06% fall in the age bracket of 15-25 years and 16.91% fall in the 25-35 years age group. As was done while calculating pizza consumption, the number of pizzas in which the crust is wasted is calculated as ?large pizza equivalent? per month. The survey shows that the crust of 42.38 ?large size pizza equivalent? is wasted per month for the sampled population (out of a total consumption of about 108.54 ?large size pizza equivalent? per month. See Annexure 2 for the basis of our calculations). That means, on an average, the crust of 0.31 ?large pizza equivalent? per month per pizza consuming individual is wasted (out of the average consumption of 0.8 large pizza equivalent per month per pizza consuming individual).
Water and Carbon footprint
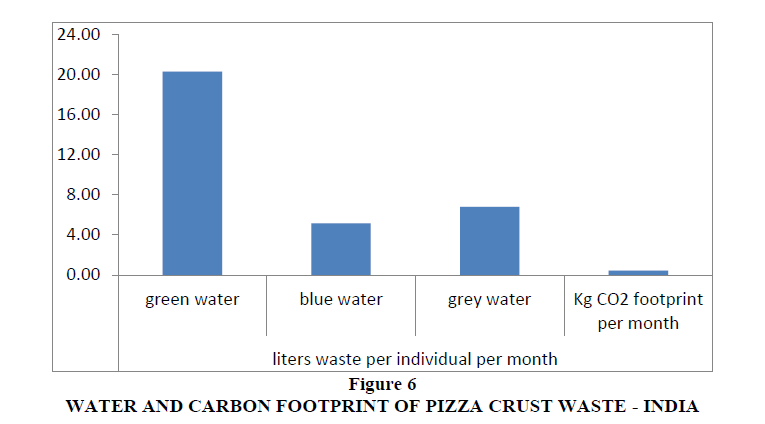
The crust of 0.31 large pizzas wasted per individual per month is used to calculate the water and carbon footprint. Using the crust area of large pizzas, the water footprint data from Table 1 and 5.1 kg CO2 for carbon footprint as described in the methodology section, the water and carbon footprint for pizza crust wasted is calculated. Figure 6 gives the water and carbon footprint due to pizza crust wastage per individual per month.
The water footprint for pizza crust wasted per pizza consuming individual in India per month equals to 20.28 liters of green water, 5.16 liters of blue water and 6.77 liters of grey water (total water footprint being 32.21 liters). In addition, pizza crust waste would have a carbon footprint of 0.43 kg of carbon dioxide per pizza consuming Indian per month.
Discussion
As stated earlier, India has a large population which consumes fast foods like pizza. According to NCAER (Gyan Research and Analytic, 2012), India has 53.3 million middle-class households which amounts to about 267 million people in this category. The new SEC classification (MRSI 2011) up to C1 class also suggests a similar number of 265 million people. Making an assumption that 50% of this population eats pizzas, the total water footprint for India due to pizza crust waste would be 4.24 billion litres per month (2.7 billion litres of green water, 0.64 billion litres of blue water and another 0.9 billion litres of grey water) and the carbon footprint for the same would amount to 56.4 thousand tonnes of CO2 per month. Consumers need to be educated about this and urged to consume smaller portions of pizza without wasting the crust and thereby reduce the negative environmental impact caused.
Along the lines of a food calorie chart, a footprint chart for different food wastes could also be developed. Policy makers could use these charts to spread awareness and thereby modify food waste behavior.
Once this is initially done for food items that do not hamper the lifestyle of the individual and they start becoming environmentally conscious, other behaviors impacting their lifestyle could also be worked upon.
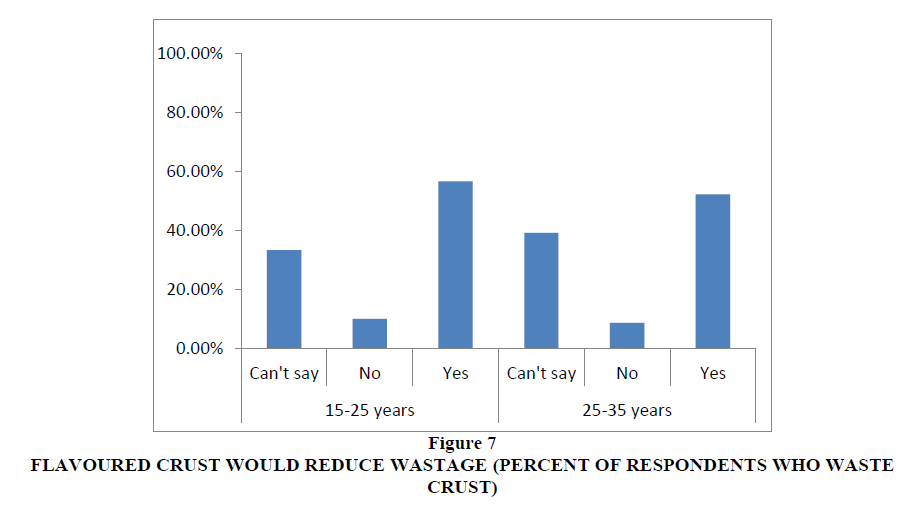
Pizza companies, on the other hand, would lose revenue if consumers made a shift from bigger portion sizes to smaller ones. So, pizza makers could devise innovative methods like flavouring the crust to make it more ?tasty? and thereby reduce wastage and the subsequent environmental damage. The sampled population have shown interest in the idea of a flavoured crust. Figure 7 shows that 57% of the respondents in age group of 15-25 years and 52% in the age group of 25-35% have stated that they would consume the crust if it is flavoured. One third in the age group of 15-25 years and 39% in the age group of 25-35 years were undecided. Only 10 % in the age bracket of 15-25 years and 8.7% in the age group of 25-35 years stated that they would not consume the crust even if it is flavoured.
In addition, corporates could design campaigns against food wastage as part of their Corporate Social Responsibility.
Conclusion
Increased disposable income among the cosmopolitan middle-class Indians has increased the consumption of processed foods. These foods are prepared through processes that are energy intensive. Growing consumption of such "convenient" food is also leading to growing wastage, with people ordering larger quantities and habitually leaving out portions of their food. While it would be difficult to change the lifestyle of the people, corporates and policy makers could help minimize the food wasted by educating consumers about the environmental damage caused by the habitual wastage of food. With this objective in mind, we studied the pizza consuming behavior of urban Indian population and calculated the water and carbon footprint resulting from the wastage of the pizza crust.
The study estimates the water and carbon footprint per month due to pizza crust wastage per pizza consuming individual to be 32.21 litres of water and 0.43 kg of CO2. The study recommends that consumers consider ordering smaller portions of pizza and companies flavor the crust to minimize wastage.
This study documents only a rough estimation of the water and carbon footprint of pizza crust wastage. Though limited in scope, the paper offers key insights into a common phenomenon, which poses a significant environmental problem. It highlights an important issue for policy makers and suggests dynamic measures to counter food wastage and its attendant environmental concerns.
ANNEXURE 1
Pizza consumption survey
This a short survey to determine the pizza consumption behavior. We request you to spare a few minutes. Thanks!
Age
How often do you eat pizza?
- Once a week
- Twice a week
- Thrice or more in a week
- Once or twice a month
Size of serving you generally consume?
- Full personal pizza
- Half medium size pizza
- Full medium size pizza
- Half large pizza
- Full large pizza
- Other:
On a scale of 10, with 10 being highest and 1 being lowest, how much of a pizza lover are you?
On a scale of 1-5 rank the following factors in order of their importance while choosing a pizza (1 being least important, 5 being extremely important)
- Small Crust
- Toppings
- Extra cheese
- Extra toppings
- Cost
- Time to Prepare
- Crust
- Toppings
- Extra cheese
- Extra toppings
- Cost
- Time to Prepare
Do you consume the outer part of the crust? (the plain bread along the circumference that hardly has any toppings)
- Yes
- No
If the crust was flavoured, would you eat it completely? (including the outer part)
- Yes
- No
- Can't say
How much extra are you willing to pay for a flavoured crust?
- 10-15% of the pizza cost
- 15-25% of the pizza cost
- >30% of the pizza cost
- Not willing to pay extra
How much extra would you be willing to pay for extra toppings
- 10-15% of the pizza cost
- 15-25% of the pizza cost
- >30% of the pizza cost
- Not willing to pay extra
Which is your favourite pizza chain?
- Pizza Hut
- Dominos
- Papa John's
- Eagle Boys
- Other:
Please specify in few words why the pizza chain is your favourite
Annexure 2
Pizza Consumption and Crust wastage
