Research Article: 2022 Vol: 26 Issue: 1S
Understanding Customer Loyalty In The Online-To-Offline (O2O) Model by Measuring Emotion and Cognition In The Indian Context
Kanwal Kapil, Management Development Institute-MDI
Citation Information: Kapil, K., (2022). Understanding customer loyalty in the online-to-offline (O2O) model by measuring emotion and cognition in the Indian context. Academy of Marketing Studies Journal, 26(S1), 1-12.
Abstract
Online to Offline Model is fast catching up in India and is still an unexplored territory for a lot of organizations. Unique features of O2O commerce and their affect on consumer use of O2O commerce is a huge research gap to be yet explored. In this research paper, we try to study the impact of emotion and cognition on the customer loyalty in the O2O context. The paper uses research model integrating customer loyalty and cognition to influence of the features of O2O commerce on consumer use intention. The research model is tested with data collected from a field survey using structural equation modelling. The findings validate that the two will influence customer loyalty in the online to offline business model
Keywords
Online To Offline Commerce, Physical Experience, Integration of Online and Offline Information, O2O Commerce, Consumer Behaviour, Cognition, Emotion.
Introduction
Emotions drive consumption (Bagozzi et al., 1999; Holbrook and Hirschman, 1982; Leone et al., 2005; Watson & Spence, 2007) and form critical determinant factor for customer loyalty especially in service environments (Foxall & Greenley, 1999). Mixed emotions (i.e. consumer ambivalence) also play a key role in consumer behaviour buy was beyond the purview of this research. For understanding the ramifications of mixed emotions, resaerchers have called from more study (Watson & Spence, 2007). This paper takes emotions and cognition for consumer ambivalence (Olsen et al., 2005; Otnes et al., 1997; Ruth et al., 2002), to investigate the inter-relationship between emotion and cognition to create customer loyalty in Online-to-Offline, O-2-O setting. The O2O market in India is estimated at $64 billion and the very fact that for a country with 200 million mobile phones, there are only 20 million online shoppers, the preference for offline buying is apparent. Players like PayTM, Little and Nearbuy are fast capitalizing on this insight that the consumers want to try before they buy. These firms are therefore, investing big on the O2O model.
Online-to-Offline aims at driving consumers from the web to the stores. O2O reaches its customer segment through online social media, internet advertising, and personal emails to convert them to the offline space. Thus, O2O helps in combining the offline with the online Figure 1.
The increasing use and growth of Internet and the growth of smartphones especially low cost ones have fast forwarded the integration of online and offline commerce. The new trend especially post Covid 2019, the consumers have got into habit of searching and purchasing goods and services online. Also post covid several products and services which were considered a pure domain of offline commerce have built online commerce environment. But as covid lockdown eased out and economy came back on tarck, consumers have linked the online search with consumption in a physical store. This online to offline (O2O) commerce (Li Shen & Bart 2018, Rampell 2010). From sellers perspective the search for end consumers and bringing them to offline marektpalce is the core challenge (He Cheng Dong & wang 2016, Rampell 2010). The sellers need to keep in mind the consumer needs, because whatever experience that they create needs to appeal and engage the consumer Shun (2001) in order to drive greater loyalty and thereby, more cash flwos. This paper aims to capture the customer perspective for this fast emerging model through the Facebook check-in service, makemytrip, oyo. When we consider the check-in service, there are two aspects. First, a customer receives information about a product, store or service through social media, via web check-ins by friends or family. The customer then influenced by the same visits the store to buy the product or avail the service. Also, basis the degree of influence, the check-in service might be used as a promotional instrumental, leveraging the customer’s social network.
A big challenge is that sometimes the consumers do not make any purchases in physical stores and they still choose to ultimately transact online to take advantage of the cost savings of online stores. As a result, storeowners are being defeated by e-retailing, and many traditional retailing giants have collapsed (wang 2018). Thus Discounts, updated information and reservations are a few methods by which stores try to increase offline consumption (Kulkarni, G., Ratchford, B.T., & Kannan, P.K. (2012). Many sellers try in the O2O business model aims at providing an integrated consumer experience, combining the offline with the online. The customer can be attracted to the store through geo-fencing where there can be customized notifications can be sent to the customer through mobile phone notifications, once inside they can be customized discounts depending upon their earlier purchases or current purchasing activity and once they are outside, they can be made loyal consumers by staying relevant ((Tse-Ming Tsai et al. (2015). Some consumers follow “research online, purchase offline” pattern to buy specialized goods that dents the online retailer’s cash flows. Such kind of cross-channel free-riding (Chiu, et al., 2011) is also detrimental to online-offline marketplace.. Free showroom and free-riding costs are reduced by efficient integration of online and offline operations as O2O commerce.
O2O commerce aims at creating omnichannel customer experience. Like some online retailers create an offline presence with physical shopping experience. For example, Amazon, eBay, and Alibaba have all launched trials of physical stores, allowing consumers to complete purchases via smartphones in showroom centres (Orendroff 2018). The existing literature is silent regarding how the unique features of O2O commerce affect consumer use especially emotion and cognition.
On line business model, help localized stores to broaden their customers. User feedback from Internet helps stores to provide customized service to enhance high stickiness. Customer loyalty in terms of O2O, includes two main attributes: purchase intention (Would the customer purchase the product from that particular store?) and recommendation (Would the customer recommend the store to a friend?). ( Jacoby & Jacob 1971) The O2O business model creates two environments: the social and the one at the store, where the retailer has to ensure that the online promotion translates to offline sales. This experience depends on the emotion preceding cognition model or cognition preceding emotion model to create customer experience. Therefore, the emotion preceding cognition model best serves our purpose in the context of O2O Model (Zajonc, & Markus, 1982).
The PAD Model initially proposed by Russell and Mehrabian can be used to represent the initial emotional states of a customer (Mehrabian, & Russell (1974). As per PAD model stimuli affect the three main emotions of individuals and thus influence the experience of users with the environment. Russell and Pratt suggest that dominance is more influenced by cognition than emotion Russell & Pratt (1980). Further, when people see the online check-in activity, they have more control over whether they actually want to go to the store and buy the product and hence, this study has taken dominance as an essential component of the emotion model (Eroglu, et al., & Davis, (2001)
.
Cognition represents the represents the views or judgements that a customer has to different products which may be indicated by different indices Chang & Chen, (2009); Evanschitzky, & Wunderlich, (2006). The social environment is the one on social media Eysenck, et al., (1972); Everett, et al., (1994), where the customer forms a judgement about the product whereas the store environment refers to the interiors, service, etc of the store that the customer goes to.
The paper attempts to create model using both social as store environment as the customer forms an opinion about the products online through the check-in activity of their friends and family and then they enter the store where it is reinforced. This reinforcement is then reflected through further check in by the person and so on Lin, & Liang (2011); Dholakia, et al., (2004)
.
Conceptual Framework and Hypotheses Development
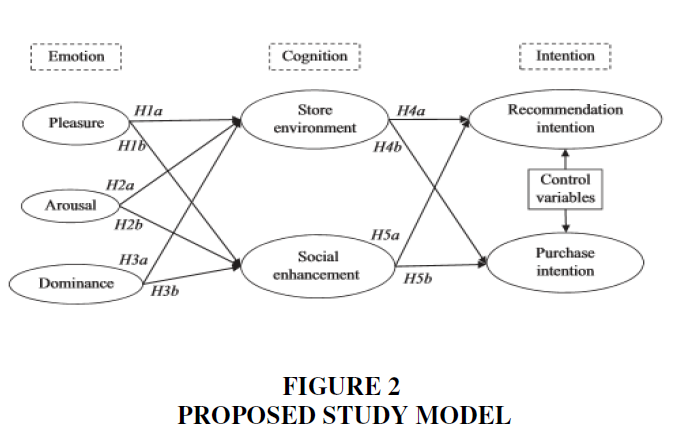
This study proposed a research model to explain the online to offline customer loyalty and role of emotion and cognition behavior of consumers. The study model includes constructs like; customer value, cognition & emotion like pleasure, arousal, dominance, store environment and social environment in Figure 2. The measurement instrument used for the data collection was a structured questionnaire with close-ended questions.
Hypothesis Proposed
Based on conceptual framework and literature review, the following study hypotheses were formulated:
H1: Cognition elements are directly influenced by Pleasure
H2: Cognition elements are directly influenced by Arousal
H3: Cognition elements are directly influenced by Dominance
H4: Intention elements are directly influenced by Store Environment.
H5: Intention elements are directly influenced by Social Environment.
Based on above hypothesis the paper proposes a model Figure 2.
Sample and Data Collection
Pilot test: A survey questionnaire was designed to capture the proposed measures. The items were recorded on a seven-point Likert scale ranging from strongly disagree “1” to strongly agree “7”. To ensure efficacy of the model and questionnaire a preliminary test was conducted with 30 college students. On basis of their inputs, the questionnaire was revised for clarity. After that, a larger scale pilot test was administered in three classes of post graduate business management students around 120 responses were collected. Subsequently exploratory factor analysis was conducted with SPSS, according to the loadings on the corresponding factors; we deleted the items whose loadings were lower than 0.5 ((hair black babin Anderson & tatham 2010, manually 1978). The questionnaire measures are adapted to the context of O2O commerce Table 1.
| Table 1 Definitions and Sources of Constructs | |||
| Component | Survey Measures | Source | |
| Emotion | Pleasure | 1. Unhappy-Happy 2. Annoyed-pleased 3. Despairing-Hopeful 4. Bored-Relaxed |
Marketing handbook of scales |
| Arousal | 1. Calm-excited 2. Sluggish-Frenzied 3. Dull-Jittery 4. Sleepy-Wide awake |
Marketing handbook of scales | |
| Dominance | 1. Controlled-Controlling 2. Influenced-Influential 3. Awed-Important 4. Submission-Dominant |
Marketing handbook of scales | |
| Cognition | Social Environment | 1. I have a favourable opinion of the store 2. I like this store 3. The store was good 4. I have positive opinion of the store |
Archana kumar a p, Youn-Kyung Kim |
| Store Environment | 1. The check in helped me to Impress 2. Feel important 3. Feel accepted 4. Gain social approval |
U M Dholakia Et al | |
| Behavior | Purchase Intention | 1. I will shop from the store in near future 2. Whenever I need to buy something it is very likely that I will purchase from the store |
Summers, T.A., Belleau, B.D., Xu, Y., 2006 |
| Recommendation Intention |
1. I would recommend the intention to a friend 2. I have positive things to say about this check in 3. I intent to encourage friends and family to take part in promotional activity |
Jung- Kuei Hsieh (2017) | |
Sample Statistics
To assess the structural relationships among the study constructs, Structural Equation Modeling (SEM) with AMOS 20.0 (Covariance based SEM) with maximum likelihood estimation was used. As SEM is used for testing robustness of study model, but one needs to adhere to minimum sample size. In Structural Equation Modeling generally, any number above 200 (critical sample size) is is considered statistically adequate for data analysis (Hoelter, 1983; Hoe, 2008). In this study, a sample size of 314 was used for testing model fit and study hypotheses.
The survey was spread over three months, and 314 valid responses were collected with a valid rate of 72.33 % of total responses. The descriptive analysis of respondents is shown in Table 2.
| Table 2 The Descriptive Analysis of Respondents | ||
| Variables | Frequencies | Percentages (%) |
| Male | 200 | 48.08 |
| Female | 216 | 51.92 |
| Less than 18 | 7 | 1.68 |
| 18-30 | 326 | 78.36 |
| 31-40 | 69 | 16.59 |
| Greater than >40 | 14 | 3.37 |
| Graduate | 271 | 65.14 |
| Undergraduate or lower | 61 | 14.66 |
| Business employee | 131 | 31.49 |
| Government & other organization staff | 67 | 16.11 |
| Student | 182 | 43.75 |
| Others | 36 | 8.65 |
| Ordering online, consuming offline | 198 | 47.60 |
| Experiencing offline, purchasing online | 20 | 4.81 |
| Purchasing online, picking up offline | 88 | 21.15 |
| Hybrid pattern | 110 | 26.44 |
| Mobile payment | 162 | 38.94 |
| Web page payment | 106 | 25.48 |
| Others | 148 | 35.58 |
| Less than 500 | 251 | 60.34 |
| 501 to 1500 | 135 | 32.45 |
| Greater than 1500 | 30 | 7.21 |
As per descriptive analysis, three categories of O2O commerce pattern are covered. The most popular is “ordering online, consuming offline”, which accounts for 52.6 % of the total O2O transactions in the sample. Most of the respondents were 18-35.
Data Analysis: Model Fit and Hypothesis Testing
The data analysis involves model fitting and hypothesis testing. The testing is divided into measurement model and structured model. The measurement model is tested using Confirmatory Factor Analysis and the structured model is tested using SEM. The hypothesis testing will be done by measuring the standardized regression weights of the different paths in the model. The models have been specified, assessed and measured using AMOS version 25.
Measurement Model
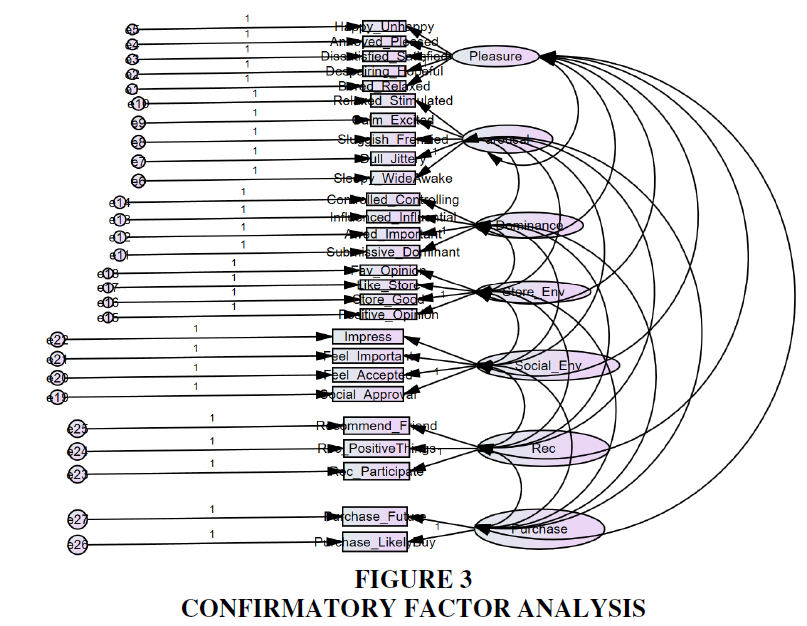
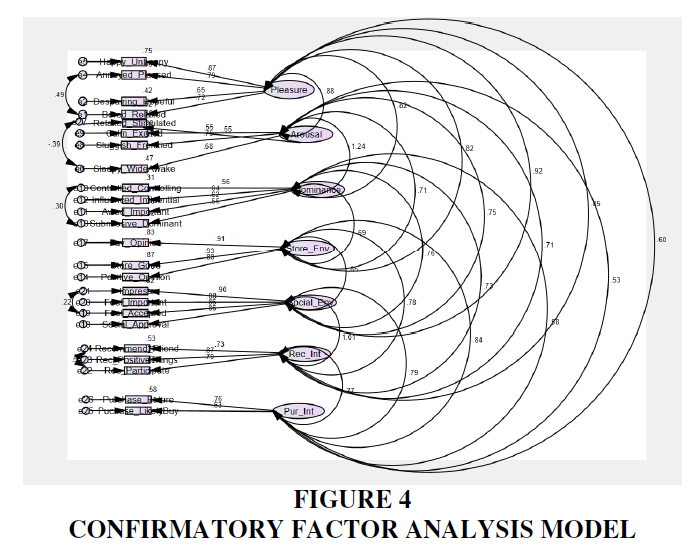
The measurement model was tested using Confirmatory Factor Analysis (CFA). The measurement model was fit in AMOS (Table 3; Figures 3 & 4).
| Table 3 Model Fit Measures | ||
| Measures of Fit | Indications of Model Fit | Value |
| CMIN/DF(χ2/df) | The value should be between 1 and should not exceed 5 | 3.4 |
| CFI | The CFI value should be between 0 and 1 | 0.96 |
| GFI | This value should be between 0 and1, the closer to 1 the better | 0.93 |
| AGFI | This value does not have a lower bound and the closer it is to 1, the better | 0.89 |
| RMSEA | The value should not exceed 0.1 and 0 indicates an exact fit of the model | 0.05 |
CMIN/DF: This parameter measures the minimum discrepancy divided by the degrees of freedoms. The ratio should be less than 5 or as close to 1 as possible.
RMSEA: The Root Mean Square Error of Approximation should be between 0 and 1, closer to 0 indicating the best fit. According to (Wheaton (1987), the RMSEA value should be less than 0.05 for a good fit. However, according to MW Browne, R Cudeck (1993), the value of 0.08 can also indicate a valid model.
GFI: The GFI was developed by JC Anderson, DW Gerbing (1984) and was later improved upon by JS Tanaka, GJ Huba, (1985). It should always be less than or equal to 1, the closer to 1, the better it is
Hypothesis Testing
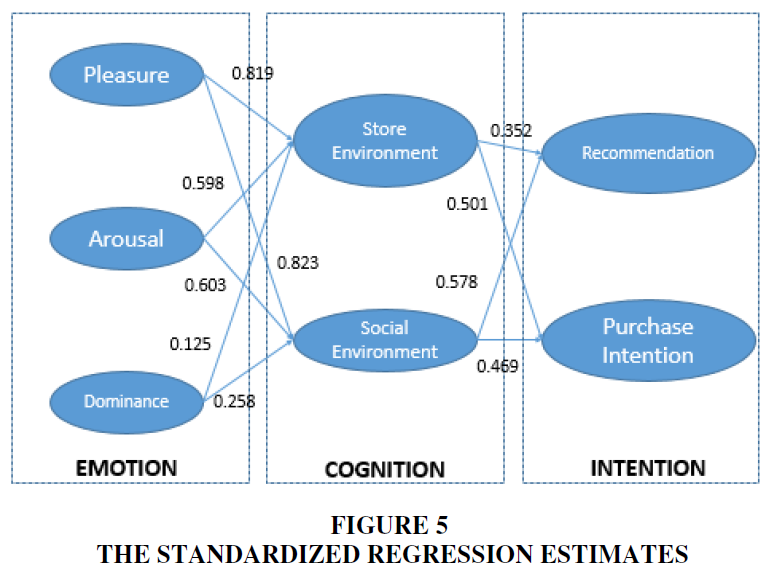
Table 4 gives us Standardized Regression Estimates along with the Critical Ratios C.R. It helps us to inspect the relationships between the different constructs. According to (Hair, Black, Babin, Anderson and Tatham (2006), when the CRs are above or equal to 2.58, then it shows a 99 percent significance level.
| Table 4 Standardized Regression Estimates | ||||
| Standardized Estimates | C.R. | P | Remarks | |
| Pleasure -> Social Environment | 0.823 | 7.910 | *** | Accepted |
| Pleasure -> Store Environment | 0.819 | 7.784 | *** | Accepted |
| Arousal -> Social Environment | 0.603 | 6.259 | *** | Accepted |
| Arousal -> Store Environment | 0.598 | 6.286 | *** | Accepted |
| Dominance -> Social Environment | 0.258 | 5.733 | *** | Accepted |
| Dominance -> Store Environment | 0.125 | 3.110 | *** | Accepted |
| Social Environment >Purchase Intention | 0.469 | 7.259 | *** | Accepted |
| Social Environment >Recommendation | 0.578 | 7890 | *** | Accepted |
| Store Environment >Purchase Intention | 0.501 | 7.468 | *** | Accepted |
| Store Environment >Recommendation | 0.352 | 6.340 | *** | Accepted |
The entire hypothesis is accepted since they regressed positively and significantly. The model given below was finally accepted Figure 5.
Discussion
Emotional reactions to any environment include pleasure-displeasure (PL), arousal-nonarousal (AR) and dominance-submissiveness (DO) (known as PAD dimensions) and are said to fully account for emotional responses to any environment (Donovan & Rossiter, 1982; Donovan et al., 1994). PL describes feelings of joy and happiness while AR refers to excitement, alertness and stimulation (Van Kenhove & Desrumaux, 1997). Emotions can be viewed as the outcome of explaining arousal, and are positive, negative or mixed (ambivalence) (Harrist, 2006; Hogg & Vaughan, 2005; Schachter & Singer, 1962). Baker et al. (1992) argued that “affective states produced by the store environment do influence consumers’ willingness to buy” (p. 457). Affective states determine whether or not consumers spend time in a store and will return again (Donovan & Rossiter, 1982).
In this study all hypothesis were accepted. Customer loyalty in offline to online market is positively affected by cognition and emotion. Cognition construct denoted by social and store environment, is affected by emotion. This is triggered through advertising or through a check-in activity by a customer’s social network like friends, family and peers. If Sellers reduce the impact of consumers’ emotional responses to the retail setting to avoid customers leaving store. Inducing behavioural reactions that motivate consumers to return and explore the web site even beyond search use.
Online involves a sharing of easy and real time communication, it increases the social connections, thereby leading to higher customer loyalty. Compared to online, interpersonal communication in the offline space is quite constrained. The store environment construct like the lighting, interiors and the service affect positively the customer loyalty. This is further validated by the positive correlation between the store environment and the intention construct. The sellers gain when they highlight the features in the store environment. Promotion and advertising by offline sellers should leverage the social network. Social network augment the confidence and faith of customers when the check-in activity comes from a personal source is a friend or family member. Nonsocial network advertising i.e. traditional advertising did not create same influence and hence customer loyalty. When the source of the same is a friend, it tends to add to more weight to customer consideration and opinion about the product or store, thereby increasing the recommendation intention as well.
When sellers advertise and emphasize on the emotional construct and get to involve the consumer more, the likelihood of purchase increases. When it comes to domination, the insight that we get is that advertisements should not overemphasize or put too much pressure on the consumer, so that they feel that they still have a choice.
For emotional construct, pleasure, and dominance/control were higher in the online store, as well as the desire to return and explore the store. The emotional and cognition was higher in the traditional store. Online shopping construct on emotion and cognition is more complex. Thus pleasure, return and explore and enjoyment lead to higher purchase intention. The emotional and behavioural aspects of consumers’ approach-avoidance conflicts differed between online and offline channels. The level of arousal is important in relation to the emotions which consumers experience and shapes subsequent consumers behavior. Traditional retail stores need strategies, which enhance customers’ experiences in-store so that shoppers experience positive emotions of pleasure, arousal and dominance. Bricks and mortar retailers have to monitor and manage customers’ feelings of pleasure, arousal and dominance very carefully. Retail atmospherics can play a very important role in ensuring that offline environments offer just the right amount of stimulation to arouse consumers’ positive emotions, while avoiding either stimulating negative emotions or provoking no arousal at all Figure 1, thus confirming earlier research (Foxall & Greenley, 1999; Foxall & Yani-de-Soriano, 2005).
Conclusion
When it comes to the Indian context, it is yet another amazing opportunity for marketers to increase customer loyalty by personalizing the experience for the customer. This can be done by leveraging their social network and figuring out what the likes and dislikes of their group are. Once that is done, the customer can be offered exciting deals and vouchers that he can buy online and avail offline in the store. Also, with the new techniques like iBeacon and geofencing it becomes all the more exciting for the marketer to devise strategies that connect the offline with the online as well. As soon as the customer is around a store, the marketer can send customized notifications and offers to the consumer which can further drive him to the store. Even after the feedback, the data collected from the customer can be used to send offers, check-in notifications online, thereby making the process more relevant for the customer. Thus sellers in offline mode should ensure their physical environment facilitates affiliation like friends, family and peers. In contrast for online sites, consumers need to be enticed to return, explore and complete the purchase. Online channels have higher weightage in the search stage of the consumption process. Online sellers should ensure that visiting customers return and complete the purchase. Online sellers need to include positive experiences, and reinforcers to return and complete purchase on web site.
References
Baker, J., Grewal, D. & Parasuraman, A. (1994), “The influence of store environment on quality inferences and store image”, Journal of the Academy of Marketing Science, 22(4), 328-339.
Chang, H.H. & Chen, S.W. (2009), “Consumer perception of interface quality, security, and loyalty in electronic commerce”, Information & Management, 46(7), 411-41.
Dholakia, U.M., Bagozzi, R.P. & Pearo, L.K. (2004), “A social influence model of consumer participation in network-and small-group-based virtual communities”, International Journal of Research in Marketing, 21(3), 241-263.
Evanschitzky, H. & Wunderlich, M. (2006), “An examination of moderator effects in the four-stage loyalty model”, Journal of Service Research, 8(4), 330-345
Eysenck, H.J., Arnold, W., & Meili, R. (1972), Encyclopedia of Psychology, Seabury Press, London
H Woodruffe-Burton (2011) “Revisiting experiential values of shopping: consumers' self and identity”
Hair, Black, Babin, Anderson & Tatham (2006), Multivariate data analysis 6th edition.
Jacoby, Jacob (1971). Brand loyalty: a conceptual definition. Washington, DC: American Psychological Association In Proceedings of the American Psychological Association, 6, 655–656.
Lin, J.S. & Liang, H.Y. (2011), “The influence of service environments on customer emotion and service outcomes”, Managing Service Quality, 21(4), 350-372.
Mehrabian, A. & Russell, J.A. (1974), An Approach to Environmental Psychology, MIT Press, Cambridge, MA.
MW Browne, R Cudeck (1993), Alternative ways of assessing model fit
Shun Yin Lam (2001),"The Effects of Store Environment on Shopping Behaviors: a Critical Review", in NA - Advances in Consumer Research Volume 28, eds. Mary C. Gilly and Joan Meyers-Levy, Valdosta, GA: Association for Consumer Research, Pages: 190-197.
Wheaton, B (1987), “Assessment of Fit in Overidentified Models with Latent Variables”


