Research Article: 2021 Vol: 20 Issue: 5
Trim Loss Optimisation for Construction Rebar Steel: Development of Decision Support System
Jassim M. Alshemmare, The George Washington University
Basial Ali, The George Washington University
Citation Information: Alshemmare, J.M., & Ali, B. (2021). Trim loss optimisation for construction rebar steel: Development of decision support system. Academy of Strategic Management Journal, 20(5), 1-13.
Abstract
Many construction projects consume a significant amount of reinforcing steel bar (rebar). They require the provision of this steel in different specified sizes and lengths according to the construction design. The cutting processes incur significant trim loss which is considered as waste, one of the losses that increase the cost of the project. Therefore, the “TLP is one of the most challenging issues in the context of optimisation research. The aim is to determine the optimal cutting pattern of items of various lengths from a stock of standard size material to meet the customers” needs, such that the wastage due to trim loss is minimised.
In this research a mathematical model and procedure has been developed to arrange cut plans with the minimum loss to address the TLP. The integer linear programming technique is applied to generate the optimal stock procurement plan and the cutting plan for each alternative layout arrangement for a particular structural component. The programme and the approach have been evaluated using data from ten multi-storey buildings constructed in recent years in Bahrain. The results clearly show that the proposed methodology and the developed programme are capable of producing solutions in terms of reducing wastage and lowering total cost, due to the identification of the optimal cutting layout. The results of the study have a significant impact on the amount of steel wasted and thus on the cost of the projects.
Keywords
Trim Loss Problem (TLP), One-dimensional Cutting, Construction Waste Minimisation, Cutting Stock Problem.
Introduction and Literature Review
Due to the importance of the TLP, it has been given considerable attention by researchers seeking to develop a model and recommend various methods to solve it efficiently. The TLP is regarded as one of the most challenging problems in various types of construction projects and industrial processes (Ali et al., 2013), such as the steel industry. Many businesses and enterprises in the paper, furniture, plastic film and wiring industries, as well as construction, are required to decide on an optimal cutting pattern of standard size materials with minimal waste due to trim loss (Fairee et al., 2020). The amount of waste generated from the trimming process can significantly affect the cost of the project especially in the construction field. The waste generated from the cutting of steel reinforcement bar (rebar) during the construction of concrete structures represents a major waste stream. The patterns of cutting steel rebar to their final required lengths determine the amount of waste and the cost of the project. Minimising the material waste generated during construction is one of the major objectives of sustainable construction (de Lara Andrade et al., 2021; Kim et al., 2004; Melega et al., 2008).
Wang et al. (2020) addressed a two-dimensional problem of skiving and cutting stock, with setup cost, which was motivated by a real production problem encountered in the steel industry. The problem was to cut a limited set of different rectangular steel coils into small rectangular sheets and minimise the total production cost. They propose an integer programming formulation for the problem that contains an exponential number of binary variables. The linear programming relaxation is solved using a column-and-row generation framework that involves a knapsack subproblem and a nonlinear subproblem. The computational experiments show that these algorithms are efficient and of high quality. de Lara Andrade et al. (2021) investigated the problem of multiple manufacturing modes integrated into the cutting stock problem (CSP), based on a real-life application to concrete pole manufacturing. The concrete structures can be reinforced by various combinations of steel bars of varying thicknesses and lengths; they therefore proposed, formulated and tested the integrated program, which can be applied to the construction industry and other contexts of multiple manufacturing modes with cutting processes. The integer programming mathematical formulation is thus proposed to minimise the total cost and to meet the demand for final products with different possible configurations. The approach showed how different parameters of the proposed model had an impact on the value of integration. A real instance was used to show that the diversity and combination of modes resulted in a cost reduction of 8.1%, which is relevant in a low profit margin business. Zheng et al. (2019) developed mathematical models to analyse and so minimise cutting losses while integrating engineering design, workface planning, detailed estimating, plus environmental factors into optimisation. Using rebar detailing design and work planning for a slab case, their work demonstrates how to integrate multiple stakeholders into the project delivery process by addressing their individual needs. Nadoushani et al. (2018) developed a framework and an approach to minimise trim loss and cutting waste generated from steel bars by identifying the lap splicing pattern for the steel reinforcement used in the shear walls and columns. In order to measure the effectiveness of the framework, they applied the approach to an actual case study of a six-storey building involving the construction of shear walls and columns. They compared the results obtained using the conventional method and the newly developed method. They found that steel bar waste produced from shear walls and columns was reduced by 52.2% and 55.7% respectively. They also reported a total reduction in steel reinforcement consumption of 7.7% and 11.8% for columns and shear walls respectively. They concluded that a noticeable reduction of steel bar usage can be achieved by selecting the right cutting pattern when preparing the demand list of the project. Ma et al. (2018) studied the combining of the sizing and cutting problems, taking into account the pattern setup cost. In order to reduce cutting losses in high voltage switch equipment in leading companies in China, a mixed-integer linear programming model was developed. They focused on integration of both the production planning and the stock cutting as one process. Their results showed significant impact on the total cost, enhancing competitive advantage. They were able to reduce the total cost by 8.81% on average, resulting in a cost-saving of 3.46 million RMB.
Benjaoran & Bhokha (2013) developed a procedure for the cutting plan arrangement for construction reinforcement steel to address the one-dimensional CSP. By using an intensive search algorithm, they generated a set of efficient cutting patterns, and then the cutting replications are determined from the optimisation. The model contains oversupply constraints that do not allow any item to be cut more than for the set pieces. Their test results showed several efficient cutting patterns and proved that the approach could produce low trim loss cutting plans. Chen & Yang (2015) developed an automation platform for the reinforcements of a continuous beam of an RC building which automatically checks all designs to ensure that the arrangement of reinforcements complies with the American Concrete Institute code. The optimal stock length for a specific lapping pattern can be determined by either trial-and-error or the linear programming approach. The results of the optimal stock length obtained by these two methods have been checked and are consistent with each other. Thus, the cutting pattern of longitudinal reinforcements, cut in order of decreasing length with a stock length specified by the trial-and-error method, will yield the minimum required amount stock, the most economical way to supply a proper stock length for cutting.
Danatzko & Sezen (2011) reported that a major objective of sustainable construction is to minimise the amount of material waste generated during the construction of buildings. The engineering community aims produce more sustainable buildings by reducing both raw material requirements and energy use during all phases of design and construction. Waste reduction and energy savings will consequently have a positive impact on the environment as they will result in a reduction of carbon emissions in the atmosphere. Reinertsen & Vossen (2010) presented novel optimisation models and procedures which solve the CSP when orders must be completed to a deadline. The models produce a cutting plan with the minimum amount of waste. They addressed especially complex structures and showed how common and well-known traditional industrial solutions for traditional CSPs can be incorporated. They evaluated their approach using data from a large manufacturer of reinforcement steel and showed that their model can solve industrial-size problems while also addressing common cutting considerations such as the aggregation of orders, multiple stock lengths and cutting different types of material on the same machine. They also evaluated operational performance in terms of resulting waste and punctuality of orders using the suggested model in a rolling horizon framework.
Salem et al. (2007) presented three approaches for solving the one-dimensional CSP. A genetic algorithm GA model, a linear programming LP model, and an integer programming IP model were developed to solve the one-dimensional CSP. Three real-life case studies from a steel workshop have been undertaken. The generated cutting schedules using the GA, LP, and IP approaches are presented and compared to the workshop’s actual cutting schedules. The case studies showed that the amount of waste produced in the actual cutting of the steel sections in the workshop was reduced, on average, by 29% using the output of GA or IP models. The results of this research support the suggestion that better planning, using optimisation techniques, in cutting one-dimensional stocks would substantially reduce the quantities of construction waste.
Construction waste accounts for a significant proportion of waste stream round the world. The ultimate objective of planners, designers, and constructors is to have a cutting plan that satisfies the demand list and at the same time reduces the amount of raw materials that need to be used in construction, with minimum trim losses. This in turn reduces the project cost and the impact on the environment. In this research, TLP methodology will be applied to mathematically model the optimum cutting pattern for steel bar used in a multi-storey building structure, specifically a six-storey building in the Kingdom of Bahrain.
Methodology
In this research, a solution for the TLP has been obtained by using developed and existing methods where the aim is to reduce wastage to a minimum. TLP is based on cutting pieces of standard length (SL) into a set of smaller lengths with length Li, of demand number of Ni while optimising the objective function (OF). The OF is to minimise the wastage and cost, thus maximising profit. Before collecting the data, clear planning took place about the mathematical model (including decision variables (DVs), objective functions and constraints) and the method to be used to tackle the problem; hence this research is quantitative. Furthermore, the desired lengths of steel bars of all diameters are specified for each project. These differ from one stage to the next. The available data (of ten multi-storey buildings) in the Bahrain Manager construction company are collected and analysed to obtain the minimum costs and to compare them with the actual costs to see how much saving can be obtained. Ten buildings were chosen that represent a sample of the residential buildings required in Bahrain.
Data Collection
Data collected from the projects will be the source for checking and testing the efficiency of mathematical composite linear programming models and for calculating the material and cost savings, compared with the actual data gathered from ten six-storey buildings. The data of steel bars related to project 1 includes diameters in mm (arranged in ascending order 8, 10, 12, 16 and 20 mm. For reasons related to the size of the research, only one rebar diameter (16 mm) required for project No. 1 will be presented and shown in Table 1.
| Table 1 Ten Storey Building: Required Types And Numbers of 16mm Diameter Steel Bars (In Metres) | ||||||||||||||
| SICOE NO. | L=8.5 | L=7 | L=6 | L=5.8 | L=5.5 | L=5 | L=4.8 | L=4.7 | L=4.3 | L=4 | L=3.9 | L=3.6 | L=3.5 | L=1.7 |
| F1 | 0 | 0 | 0 | 0 | 0 | 0 | 0 | 0 | 0 | 0 | 0 | 0 | 270 | 0 |
| F2 | 0 | 0 | 0 | 0 | 0 | 0 | 0 | 0 | 0 | 0 | 234 | 0 | 0 | 0 |
| F3 | 0 | 0 | 0 | 0 | 0 | 0 | 0 | 0 | 168 | 0 | 0 | 0 | 0 | 0 |
| F4 | 0 | 0 | 0 | 0 | 0 | 0 | 0 | 0 | 40 | 0 | 0 | 0 | 0 | 0 |
| C1 | 0 | 0 | 0 | 0 | 0 | 0 | 0 | 168 | 0 | 0 | 0 | 0 | 0 | 0 |
| C2 | 0 | 0 | 0 | 0 | 0 | 0 | 0 | 56 | 0 | 0 | 0 | 0 | 0 | 0 |
| C3 | 0 | 0 | 0 | 0 | 0 | 0 | 0 | 488 | 0 | 0 | 0 | 0 | 0 | 0 |
| C4 | 0 | 0 | 0 | 0 | 0 | 0 | 0 | 192 | 0 | 0 | 0 | 0 | 0 | 0 |
| C5 | 0 | 0 | 0 | 0 | 0 | 0 | 0 | 140 | 0 | 0 | 0 | 0 | 0 | 0 |
| TB | 20 | 20 | 10 | 20 | 30 | 80 | 40 | 0 | 20 | 102 | 0 | 70 | 0 | 10 |
| TOTAL | 20 | 20 | 10 | 20 | 30 | 80 | 40 | 1044 | 228 | 102 | 234 | 70 | 270 | 10 |
| TOTAL LENGTH | 9664.80 metres | |||||||||||||
Steel bar purchase prices per ton for each diameter and selling rates for waste as provided at the time the buildings are constructed are given in Table 2.
| Table 2 Pricing of Steel Bars at the Time of Project Execution | |||
| D mm | Weight kg/m | Price BD/ton | Price waste BD/ton |
| 8 | 0.395 | 219 | 95 |
| 10 | 0.617 | 211 | 95 |
| 12 | 0.888 | 211 | 95 |
| 16 | 1.58 | 211 | 95 |
| 20 | 2.47 | 211 | 95 |
The Mathematical Modelling
The TLP can be analysed in the class of CSP. In this research, the TLP is addressed by cutting a set of different lengths of steel bars for different requirements. Consider Table 3, which facilitates understanding and the ability to construct the mathematical model:
| Table 3 The Trim Loss Problem: Variables and Requirements | ||||||
| Sequence Number | Lengths required Variables | L1 | L2 | Lj | L n | Waste |
| 1 | x1 | a11 | a12 | a1j | a1n | w1 |
| 2 | x2 | a21 | a22 | a2j | a2n | w2 |
| 5 | ... | |||||
| i | xi | ai1 | ai2 | aij | ain | wj |
| m | xm | am1 | am2 | amj | amn | wm |
| Number of steel bars required of each length | N1 | N2 | Nj | Nn | ||
In order to build the project, the required lengths of bars Lj (for all j=1, 2… n), as given in row 1, have to be cut from standard steel bars of length (SL); the required numbers of each length are given in the last row and represented by Nj Groups for all j=1, 2… n. The SL can be purchased at price P BD/metre and the waste can be sold back to the supplier or other stockholders at scrap price S BD/metres. Note that aij are integer values.
The constraint of the mathematical model became:
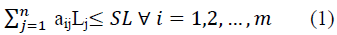
Where,
aij are integer values representing the possible number of cutting SL into the length Lj
Li is the required length for each steel bar, i =1 to n
wi is the waste of each SL of sequence i, for all i=1, 2,… n .
xi wi is the wastage in metres for sequence i
Numbers of sequences are dependent on the enumeration of the rebars and of the number of ways of dividing the SL into the required lengths.
xi is the number of standard lengths (SL) at sequence i in which the SL bar is to be cut such that the restrictions mentioned above are satisfied. In fact, xi is the number of standard lengths to be ordered at sequence i, and these standard lengths are to be cut as indicated by the solvers.
- There are n groups containing the required lengths (Group 1 contains the number of the required lengths L1, Group 2 contains the number of the required lengths L2, Group n contains the number of the required lengths Ln).
- Note that m is both the number of possible cutting patterns and the number of lengths required. /Note that m is the number of possible cutting patterns and N the number of lengths required.
- Note that this number will be the number of constraints in the formula.
The TLP has been formulated and the mathematical model constructed so that it can be programmed easily.

Subject to:
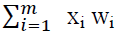 is the total wastage in metres for all the sequences (5)
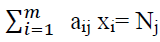 For all j=1, 2, …, n for each length Lj (6)
i=1
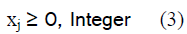
xi ≥ 0 For all i=1, 2, .., m and integer (7)
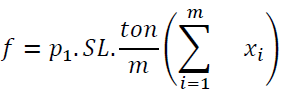
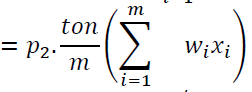
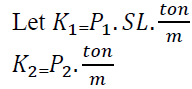
Where
K1=price of purchasing steel bars in (BD/ton) * SL in metres * unit weight (ton/metres) = BD
K2=price of wastage of steel bars sold back in (BD/ton) * unit weight (ton/metres) = units are in BD/metres
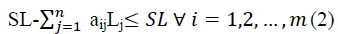
In the above mathematical model, there is no slack in constraints 5, hence they are augmented with an artificial variable Rj, to form a starting solution; however, because artificial Rj for all j, are extraneous to the above model, a feedback mechanism should be used in which the optimisation process automatically attempts to force these variables to zero level. The required outcome is affected by penalising the artificial variables in the OF. Such a model can be solved by using the big M-Method. Accordingly, the model can be rewritten as:

Subject to:
 for each length Lj. (9)
xi, Rj> = 0 For all i=1, 2... m and integer, (10)
where M is a sufficiently large positive value. Mathematically M tends to infinity.
Solution Methods
In this research it is important to illustrate two arguments – the cutting patterns, and the limitations – and hence the assumptions to be imposed. To tackle the TLP and find the optimum solution, an attempt has been made by constructing a MATLAB computer program to generate all possible ways of cutting the number of required lengths from the steel bars of standard length. It is found that a huge number of combinations have to be generated and hence a huge number of constraints need to be written in a certain form. The number of all possible ways of cutting (cutting patterns) can be found by using Combination Theory. It is expected that the numbers will be very large making it almost impossible to create the mathematical models and solve them; therefore, the number of variables need to be reduced such that they can be solved. In this case cutting patterns which are alike or are only slightly different are eliminated.
Current Applied Method Used For Steel Bars
Most contractors do not study what is the required quantity of steel to produce the least waste. Instead, they identify the required quantity by summing the theoretical required quantities from the engineering drawings and adding a margin, representing the expected waste during shearing and forming processes, based on long experience of increasing the expected cost of the concrete to cover expected waste of structural steel. This is due to several factors:
a. This field of research does not have computer software to determine how to shear steel to produce the required lengths and numbers with the least waste possible.
b. The lack of software to determine the lengths of steel bars which can be produced to get the least waste after shearing and forming.
c. Local steel industries cannot produce steel bars of special lengths as a result of monopoly policies.
Matlab Computer Program
The models presented in this research are linear integer programming models. These can be solved by the research packages of many operations. In this paper a MATLAB Computer Program Generate-CP (stands for Generate Cutting Patterns) has been developed and programmed to generate all feasible cutting patterns.
Generate-CP
i= 1,sum = 0,rem = SL= 12, ? = 1, K1 = 0 , K2 = 0
For i ← 1,2,....,10000 do
For j ← 1,2,....., (n) do
comment Initialise the 2-dimensional array a(i,j) to zero values.
a (i, j ) = 0
end For
end For
For j ← ?,? + 1, ? + 2,...,() do
iv = rem/L(j) , a (i, j ) = iv
if k1 = j then
iv = o, a (i , j ) = 0
end if
if iv > 1 & j = k2 then
iv = iv – 1
end if
sum ← sum + iv. L ( j )
rem ← rem – iv. L ( j )
if sum < SL
else if sum = SL & j < n & a ( i, j ) > 0 then k1 ← j
else if sum = SL & j = n then
if a ( i, j -1 ) > 0 & a ( i , j ) = 0 then
i ← i = 1;
else if ( i , j – 1 )=0 & a ( i , j ) > 0 then
? = ? + 1 , i )= i + 1 , K2 = ?
else if a ( i , j -1)& a (i ,j ) = 0 then
i =i + 1 = 0
else if a (i,j – 1)> 0 & a (i ,j )>0 then
i = i+1, k2 = j – 1
k1 = j – 1 = n – 1
end if
sum = 0, rem = SL = 12
end if
end for
comment
i is the counter (index) of the decision’s variables
sum is the value starting by 0 to a max=SL.
value = SL=Standard length of the steel bar =12 or 10 m.
rem is the value = start with max. =SL to a min. value=0.
? is the indicator to move from one column to another (e.g., from L1 to L2)
a (i, j) are the integer values
iv is the integer value of dividing rem by L(j) = rem / L ( j )
The output of this program, Generate-CP, will be an input to another program to construct and solve the mathematical model. This can be done by using Generate-MM which stands for generating the mathematical model.
For big problems, more efficient computer programs and solvers can be used, such as Cutting Optimisation Pro-1D or CutLogic 1D.
• Pro-1D is the most efficient computer program, a top-class length cutting optimisation software; it is the best way to save materials, cost and time when any linear materials need to be cut.
• CutLogic 1D is very flexible and complex solution providing extensive features.
Both programmes automatically find optimal cutting layouts, using the most advanced optimisation techniques. Their optimisation engine takes advantage of Genetic Algorithms and Fuzzy Logic bringing better results than any other software.
Decision Support System
Most engineering and scientific researchers have used MATLAB to analyse and design the systems and solve problems. The matrix-based MATLAB language is the most natural way to convey computational mathematics. Built-in graphics make it easy to visualise and gain insight from data. These MATLAB tools and abilities are all carefully tested and designed to work together.
The MATLAB version that has been used is Release 2021a, with the following computer specifications: Operating System: Windows 10; Processer: Intel or AMD x86-64 processor; RAM: 8 GB.
The main function of this programme DSS-TLP is to support the decision Makers to take the appropriate decisions in ordering the steel bars used in construction, such that the total cost will be minimised. It displays a variety of data – required, actual, and calculated by the solvers Pro-1 D and CutLogic 1D, minimum cost ...etc. The decision-maker can take his decision based on this information. The flowchart of the decision support system is shown in Figure 1.

Figure 1 Flowchart of Decision Support System
Sample of Calculation
Details on how the weight, costs and minimum cost were calculated using the two cutting optimisation solvers, Pro-1D and Cut Logic 1D, for each diameter and for each project will be presented in this section. The data used belongs to project 1 (see Table 5), where the steel bar diameters used were 8 mm, 10 mm, 12 mm, 16 mm and 20 mm.
In the following, TW is the total weight of steel bar in tons for the project W8, W10, ...... W20
Tw = W8+ W10 + .......... W20 = No. of steel bars of diam8 * (SL=12m) * weight/m + No. of steel bars of diam10 * (SL=12m) * weight/m +............................ +No. of steel bars of diam20 * (SL=12m) * weight/m
Tw = 1118*12*0.000395+ 532*12*0.000617+ 5445*12*0.000888+ 929*12*0.00158+1341*12*0.00247
= 124.621 ton
Minimum cost can be calculated by
P1: is the price in BD/ton of steel bar
P2: is the price in BD/ton of wastage sold back
To simplify the calculations:
 For steel bars diameters 8, 10, 12, 16, 20 mm respectively.

Note that  No. of SL (Standard length)
 is the wastage for each steel bar for each diameter
Minimum cost Z:
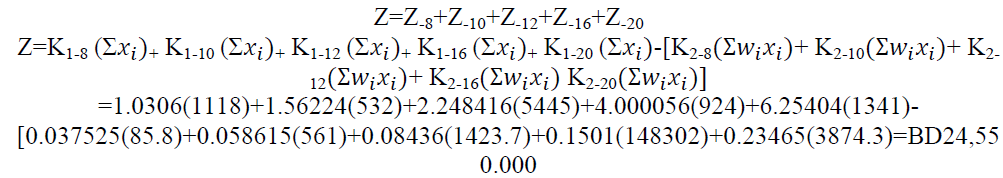
This is the minimum cost (OF) obtained for project 1
Note that  is the wastage = 24.9 tons while the actual is= 30.7 tons
x1= y1 + y2 + y3+ y4 = 1118 is the number of steel bars (SL=12) of diameter =8mm that must be used in this project such that:
y1 =864 to be cut into 864* (6 pieces each of 2 metres length) means the total numbers of parts =5184 with zero waste.
y2 =1 to be cut into 2 (2 pieces each of 2 metres length and 6 pieces of 1.3 metre length)
That means the total numbers of parts =2 (length 2 metres) and 6 (of length 1.3 metre) with waste: 0.2 metre
y3 =252 to be cut into 252 (9 pieces each of 1.3metres length)
That means the total numbers of parts =2286 with (0.3*252=75.6 metre) waste.
y4=1 to be cut into 1(1 piece of 2 metres length)
That means the total numbers of parts =1 with (10*1=10 metre) waste.
The same procedures could be followed for related steel bars of diameters 10, 12, 16 and 20 mm.
Results
Two solvers (Pro-1D and Cut Logic 1D) have been used to obtain the appropriate amount of material to be ordered for the project. Then, the developed DDS-TLP programme has been used to obtain and display the detailed data, such as what is required, actual, and what is to be ordered in terms of length, weight, cost, and what will be the wastage, etc.
Required lengths and weights for each diameter (8, 10, 12, 16, and 20 mm), the prices per ton at the time of execution of project 1 is shown in Table 4; the other data related to the other nine projects are available and can be obtained from the author. A comparison between the actual output and that of solvers for the projects are in ten tables but again, details of only project five is presented here and shown in Table 5, while the others are also available from the author. It includes required weights, actual weights, costs and what is recommended by the solver. The summary of actual and solver data for projects are presented in Table 6. Percentages of reduction of materials for ten projects are shown in Table 7.
| Table 4 Required Materials for Project 1 | ||||||
| D mm | Length in metres | Unit Weight m/kg | Weight in kg | weight in tons | Ton BD/Price | Cast BD |
| 8 | 13330.20 | 0.395 | 5265.43 | 5.27 | 219 | 1153.13 |
| 10 | 5823.00 | 0.617 | 3592.79 | 3.59 | 211 | 758.08 |
| 12 | 51109.30 | 0.888 | 45385.06 | 45.39 | 211 | 9576.25 |
| 16 | 9644.80 | 1.58 | 15270.38 | 15.27 | 211 | 3222.05 |
| 20 | 12217.70 | 2.47 | 30177.72 | 30.18 | 211 | 6367.50 |
| Total | 99691.38 | 99.7 | 21077.01 | |||
| Table 5 Comparison Between the Output of Actual and Solvers for Project 5 | ||||||
| Dia. | Required Weight in tons | Actual Total Weight in tons | Weight by solver | Actual Cost BD | Cost By solver BD | Saving by solver BD |
| 8 | 10.11 | 11.2 | 10.35 | 2401 | 2244 | 157 |
| 10 | 3.24 | 4.40 | 3.25 | 873 | 685 | 188 |
| 12 | 66.05 | 71.2 | 70.26 | 14778 | 14619 | 159 |
| 16 | 21.36 | 26.150 | 25.54 | 5290 | 4991 | 299 |
| 20 | 34.67 | 50.05 | 48.84 | 9830 | 9152 | 678 |
| Total | 135.43 | 163 | 158.25 | 33172 | 31691 | 1481 |
| Table 6 Comparison Between the Actual Output and that of Solvers: Summary of Results | |||||||
| Proj. No. | Required Weight in tons | Actual Total Weight in ton | Weight by in tons by solver | Cost of required steel bar | Actual Cost BD | Cost By solver BD | Saving by solver |
| 1 | 99.7 | 130.4 | 124.6 | 21196 | 26104 | 24549 | 1555 |
| 2 | 145.67 | 169.5 | 156.6 | 30970 | 34690 | 32350 | 2340 |
| 3 | 113.0 | 123 | 117.86 | 24100 | 25580 | 24649 | 931 |
| 4 | 114.46 | 141 | 137.2 | 24908 | 28678 | 26421 | 2257 |
| 5 | 135,.3 | 163 | 158.75 | 28792 | 33172 | 31691 | 1481 |
| 6 | 82.24 | 96.4 | 91.21 | 17484 | 19722 | 18721 | 1001 |
| 7 | 75.06 | 90 | 84.66 | 15957 | 18305 | 16829 | 1476 |
| 8 | 92.25 | 118 | 110.17 | 19612 | 23691 | 22051 | 1640 |
| 9 | 95.58 | 109 | 107.06 | 20320 | 22394 | 21672 | 722 |
| 10 | 99.62 | 122 | 111.55 | 21179 | 24729 | 22783 | 1946 |
| Table 7 Comparison between Actual Wastage and that Due to Solvers: | ||||||
| Proj. No. | Required Weight in tons | Actual Total Weight in tons | Weight in tons by solver | % of Actual Waste | % by solver | Reduction in % of waste |
| 1 | 99.7 | 130.4 | 124.6 | 23.54 | 19.98 | 3.56 |
| 2 | 145.67 | 169.5 | 156.6 | 14.06 | 6.98 | 7.08 |
| 3 | 113. | 123 | 117.86 | 8.13 | 4.12 | 4.01 |
| 4 | 114.46 | 141 | 137.2 | 18.82 | 16.57 | 2.25 |
| 5 | 135.43 | 163 | 158.75 | 16.91 | 14.69 | 2.22 |
| 6 | 82.24 | 96.4 | 91.21 | 14.69 | 9.83 | 4.86 |
| 7 | 75.06 | 90 | 84.66 | 16.60 | 11.34 | 5.26 |
| 8 | 92.25 | 118 | 110.17 | 21.82 | 16.27 | 5.55 |
| 9 | 95.58 | 109 | 107.06 | 12.31 | 10.72 | 1.59 |
| 10 | 99.62 | 122 | 111.55 | 18.34 | 10.69 | 7.65 |
| 44.03 | ||||||
N.B. Percentages of reduction in materials for the ten projects are shown in Table 7.
Discussion
a. In Table 5, for a sample project a full detailed comparison is given between required, actual and recommended qualities of steel bars in terms of weights, costs, savings etc., while the summary is given in Table 6. It is easy for the reader to see the significant differences and the resulting reasonable saving in materials and costs by using the solvers. The reduction in waste is at a rate of 4.4% as shown in Table 7. This leads contractors (of whom the author is one) to use the new techniques and research recommendations for ordering the quantities of steel bars instead of using their experience.
b. Most results obtained by solvers are directly obtained and are almost the same. The minor differences are due to the rounding of input data; any value of length input to Cut Logic 1D is rounded to only one decimal place.
c. DSS-TLP is a programme into which the input data and the output of the solvers are input. The programme will give all the details important for the decision-maker (Figure 1).
Conclusion
Studying the details of the cost of the ten buildings indicates that the cost of steel bars required to construct the structures of the projects under study is about 12% of the total cost of the required materials, which corresponds to the usual trend in the Kingdom of Bahrain. It also shown that the percentage of wastage is about 15%, or even as high as 25%. This shows the importance of reducing the amount of waste and consequently the cost of the projects, which is the aim of this study. By implementing the two solvers and the developed DSS-TLP programme, the following conclusion is drawn: the waste could be reduced by 4.4% (ranging from 1.59% to 7.65% for the ten buildings) and consequently the cost of the project. This amount of reduction of waste of steel bar may look small; it is due to the long and accumulated experience of the manager in construction of multi-storey residential buildings.
References
- Ali, M., Ahn, C.W., & Pant, M. (2013). Trim loss optimization by an improved differential evolution. Mathematical Problems in Engineering, 2013.
- Benjaoran, V., & Bhokha, S. (2013). Trim Loss Minimization for Construction Reinforcement Steel with Oversupply Constraints. Journal of Advanced Management Science Vol, 1(3).
- Chen, Y.H., & Yang, T.K. (2015). Lapping pattern, stock length, and shop drawing of beam reinforcements of an RC building. Journal of Computing in Civil Engineering, 29(1), 04014028.
- Danatzko, J.M., & Sezen, H. (2011). Sustainable structural design methodologies. Practice Periodical on Structural Design and Construction, 16(4), 186-190.
- de Lara Andrade, P.R., de Araujo, S. A., Cherri, A.C., & Lemos, F.K. (2021). The integrated lot sizing and cutting stock problem in an automotive spring factory. Applied Mathematical Modelling, 91, 1023-1036.
- Fairee, S., Khompatraporn, C., Sirinaovakul, B., & Prom-On, S. (2020). Trim Loss Optimization in Paper Production Using Reinforcement Artificial Bee Colony. IEEE Access, 8, 130647-130660.
- Kim, S.K., Hong, W.K., & Joo, J.K. (2004). Algorithms for reducing the waste rate of reinforcement bars. Journal of Asian Architecture and Building Engineering, 3(1), 17-23.
- Ma, N., Liu, Y., Zhou, Z., & Chu, C. (2018). Combined cutting stock and lot-sizing problem with pattern setup. Computers & Operations Research, 95, 44-55.
- Melega, G.M., de Araujo, S.A., & Jans, R. (2018). Classification and literature review of integrated lot-sizing and cutting stock problems. European Journal of Operational Research, 271(1), 1-19.
- Nadoushani, Z.S.M., Hammad, A.W., Xiao, J., & Akbarnezhad, A. (2018). Minimizing cutting wastes of reinforcing steel bars through optimizing lap splicing within reinforced concrete elements. Construction and Building Materials, 185, 600-608.
- Reinertsen, H., & Vossen, T.W. (2010). The one-dimensional cutting stock problem with due dates. European Journal of Operational Research, 201(3), 701-711.
- Salem, O., Shahin, A., & Khalifa, Y. (2007). Minimizing cutting wastes of reinforcement steel bars using genetic algorithms and integer programming models. Journal of construction engineering and management, 133(12), 982-992.
- Wang, D., Xiao, F., Zhou, L., & Liang, Z. (2020). Two-dimensional skiving and cutting stock problem with setup cost based on column-and-row generation. European Journal of Operational Research, 286(2), 547-563.
- Zheng, C., Yi, C., & Lu, M. (2019). Integrated optimization of rebar detailing design and installation planning for waste reduction and productivity improvement. Automation in Construction, 101, 32-47.