Research Article: 2023 Vol: 27 Issue: 6
The role of transshipment in a mono-echelon and multi-retailer inventory system: A Case study of a wholesaler in Tunisia
Elleuch fadoi, Faculty of Economics and Management of Sfax
Semi Boudabbous, Faculty of Economics and Management of Sfax
Citation Information: Fadoi. E., Boudabbous. S., (2023). The Role Of Transshipment In A Mono-Echelon And Multi-Retailer Inventory System: A Case Study Of A Wholesaler In Tunisia. International Journal of Entrepreneurship, 27(6),1-28
Abstract
Purpose: In this paper, we deal with the case of a network made up of a distribution center that supplies several retailers. We assume that the demand Di (i = 1, 2, 3) at site i follows a normal distribution with mean μ i and standard deviation σi (known). Retailers work together in the event of a shortage of inventory by shifting the necessary amount of transshipment to meet expected customer demand. Design/Methodology/Approach: First, a simulation-optimization approach based on a metamodel is applied to find the different measures of the initial level of replenishment. Secondly, a series of simulation experiments are performed to find the best strategy of Transshipment, in terms, of maximizing the Average Global Profit and minimizing the Average Global Desservice Rate. Findings: We study the effectiveness of different strategies (random, depending on the proximity of retailers, and depending on the risk confrontation) on the reduction of the level of risk and we conclude that, the transshipment strategy according to the confrontation of risks is the more economically profitable. Originality/value: We research all the possible strategies in the case of a system composed of multi-retailers and we compare their efficiency on the minimization of the number of lost orders.
Keywords
Transshipment, Discrete Event Simulation (Des), Vendor-Managed Inventory, Metamodel-Based Simulation, Supply Chain Management, Partial-Pooling Threshold.
Introduction
In the inventory system consisting of two-echelon of neighboring multi-retailers are located at shorter distances than the supplier, one can request stock from others when it is out of stock, that is to say that emergency lateral transshipment between these retailers is commonly practiced to improve the rate of fulfilled orders.
In this paper, we develop an inventory model composed of multi-retailer with continuous review by applying the stocking policy (R, Si), for consumable products when emergency lateral transshipments between these retailers are allowed. Approximations are derived for the expected level of average overall profit and the average global Desservice rate of retailers. Numerical examples are presented to illustrate the effects of emergency lateral transshipment on the performance criteria of inventory systems. The results of the experiments carried out by the simulation using the ARENA 16.0 software and then optimized using its OptQuest tool indicate that the emergency lateral transshipment leads to a significant decrease in the average global Desservice rate of retailer orders, which leads to a overall gain improvement of this centralized system.
In this research, we study in Section 2 the literature review of research.We studied the problem description in Section 3 to Section 4. Numerical results and interpretation are presented in Sections 5. Conclusion will be presented in Section 6.
Literature Review
Lateral Transhipment Policies
The literature on lateral transshipments can be divided in two main categories that differ in the timing of transshipments. The first category is known as proactive transshipment or preventive lateral transshipment, where lateral transshipments can be limited to take place at predetermined times before all demand is realized. In this case, lateral transshipments are used to redistribute stock amongst all stocking points in an echelon at programmed moments. Consequently, preventive lateral transshipment is appropriate when the transshipment costs are comparatively low compared to the costs associated with holding large amounts of stock and with failing to meet demands immediately. The second category which is called reactive transshipment, known also as emergency lateral transshipment, lateral transshipments can take place at any time to respond to stock outs or potential stock outs. In reactive transshipment, lateral transshipments are realized after the arrival of demand but before it are satisfied. If there is inventory at some of the stocking locations while some have backorder, lateral transshipments between stocking locations can work well. Some authors combine reactive transshipment and proactive transshipment policies together (known as service level adjustments) to reduce the risk of stock outs in advance and efficiently respond to actual stock outs. In fact, emergency lateral transshipment responds to actual stock outs while preventive lateral transshipment reduces the risk of possible future stock outs. Transshipment has been considered in the literature as a tool to balance inventory among locations in the same echelon to reduce shortage. Lateral transshipment policies can be classified into reactive (corrective) and proactive transhipment (preventive), (Paterson et al., 2011).
The first is that of emergency transshipment (transshipment reactive); it corresponds to the Transsipment carried out following an actual stock-out at a retailer resulting from the arrival of a demand. In the literature, several research studies are aimed at studying this approach. Most past studies considered reactive transshipment, in which transshipment occurs when an inventory shortage is, realized [Herer et al., (2006), Yao et al., (2016), Park et al., (2016)]. In these studies, the transshipment time was considered negligible to make the problem tractable.
Paterson et al., (2012) investigated the problem of a multi-level stock system composed of N- retailers, in the event of an actual retail outage due to a random customer demand arrival. They proposed a reactive approach to solve this problem.
Reyes et al., (2013) have studied the same problem as (Paterson et al., 2012) by focusing their research work on the impact of emergency transshipment on inventory management in this system in case of an actual stock-out, and they concluded that responsive transshipment can reduce costs and improve service r.ates by minimizing the amount of customer order lost.
Kim and Sarkar, (2017) proposed that time is one of the crucial elements of competition, customers get impatient and less tolerant of back orders. Partially unsatisfied orders are a common phenomenon in the retail trade. It has an obvious effect on the corrective transshipment performance because the latter is executed at the end of the sales season in the event of a stock shortage.
Dehghani and Abbasi (2018) considered an aged-based lateral shipment policy for the case of perishable items. They targeted the transshipment of blood units between hospitals. They developed partial differential equations to derive and solve a joint distribution problem that allowed them to determine the optimal inventory level at each location with transshipment based on the age of stock. They also showed that their approach could bring additional savings to a similarly structured distribution channel.
Yi et al.,(2020)studie optimal lateral transshipment and replenishment decisions under a decentralized setting. We construct a multi-stage stochastic model that captures demand uncertainty and customer switching behavior. We demonstrate that, similar to the centralized setting, the optimal transshipment decision follows a double-threshold structure.
The optimal replenishment quantities are determined under two pricing mechanismsindividual mechanism (IP) and negotiated mechanism (NP).
The second approach is that of proactive (or so-called proactive) transshipment, which is a redistribution of stocks at the beginning or end of each supply cycle but before customer demand is realized.
There is a vast literature that is interested in this type of transshipment approach. Preventive transshipment research is dominated by periodic review, because at the beginning and end of each period it is necessary to periodically check the quantities stored to attribute a redistribution of these quantities. In this regard, (Agrawal et al., 2004) envisioned a two-step inventory system in which they aimed to rebalance the quantity stored at a predetermined time before the demand was made and they presented a formulation dynamic programming to determine the best decisions. (Van et al., 2009) studied the problem of a two-tier stock system. They applied the Markov process to solve it by applying preventive transshipment on a specific date. Paterson et al., (2010) analyzed a multi-warehouse inventory system that follows inventory policy (S-1, S) combined with the proactive transshipment policy. They assumed that the cost of transshipment is fixed, and they aimed to set the optimal time of the redistribution of stock to minimize the breakage, which entails a minimization of the global cost.
Some research projects have studied the inventory problem with preventive transshipment in a decentralized system. (Li et al., 2013) analyzed an inventory system with two storage depots which uses proactive transshipment as an approach to deal with the gap between demand and supply. A bidirectional an income sharing contract has been proposed to coordinate the transhipment quantities between the two entropots. (Abouee-Mehrizi et al., 2015) proposed a proactive transshipment model to minimize the mismatch between supply and request. They considered a multi-period inventory with a finite horizon system for two locations and optimal determination of joint replenishment and transhipment policies.
Dan et al.,(2016) developed a two-period order and pricing model with preventive transshipment and conditional return. To reduce the imbalance within the system, the manufacturer controlled preventive transshipment between two independent retailers. (Feng et al., 2017) addressed the problem of the stock system by applying preventive transshipment. A heuristic combined with dynamic programming algorithms has been proposed to solve the problem. They proposed a non-linear model for a supply chain with transshipment between buyers who had limited warehouse capacity. They have resulted that transshipment increased the rate of use of storage capacity. (Meissner & Senicheva, 2018) studied a multi-site, multi-period storage system with proactive (preventive) transshipment and approximate dynamic programming used determine an optimal order policy and transshipment policy.
To significantly improve a purely reactive transshipment policy, it would be possible to combine it with another proactive policy; this will be named by “Hybrid transshipment policy”.(Glazebrook et al., 2015) proposed a hybrid lateral transshipment policy such that the transshipment decisions are made when a location faces a shortage that resembles a reactive transshipment policy, however, the quantity of transshipment can exceed the current shortage to avoid future imbalance in the inventory system. They employed dynamic programming to solve their model, using a heuristic to approximate the future cost of a decision. (Dijkstra et al., 2019) consider the case that the return products ordered online at any offline store may result in unbalanced inventories. To deal with these unbalanced inventories, they study the optimal transshipment policy and prove that it can reduce the cost.
Transshipment Direction
The literature on unidirectional transshipment for a supply chain is, however, scarce. (Seifert etal., 2006) studied unidirectional transshipment integrating direct and indirect sales channels through a traditional retail store and a decentralized virtual store. They analyze how the supply chain of a single manufacturer and several identical retail stores can be coordinated by taking into account a combination of wholesale prices, inventory subsidies and transfer payments. (Dong et al., 2012) studied a multi-level framework considering a contract manufacturer and two inventory locations which differ in scale and scope such that transshipments are performed only unidirectional to analyse information asymmetry within the context of transshipments. (He et al., 2014) studied a dual channel supply chain with unidirectional transshipment policies between retailer and manufacturer under endogenous and exogenous transshipment prices. The setting in both papers is somewhat different to our horizontal setting as they consider unidirectional transshipments between different echelons.
Toyasaki etal., (2017) considered bidirectional and unidirectional transshipment of relief items in a decentralised humanitarian supply chain under correlated demands. However, since they consider a supply chain network in the non-commercial setting, their model shows significant differences to the commercial setting in terms of cost and price parameters. But, in centralized systems, most publications focused on bidirectional transshipment in supply chains.
This work assumes that transshipment is mutually beneficial for all retailers and object to maximize the global profit of the system and no longer of such a retailer.
Rudi and al., (2001) show that the decentralised system can be coordinated by appropriately set transshipment prices. However, (Hu et al., 2007) provide examples which show that such coordinating prices may not exist in several cases. Especially with increasing asymmetries in the economic parameters for the two locations, coordination of bidirectional transshipments may not be possible by varying the transshipment prices. (Li et al., 2013) discuss the coordination problem of preventive bidirectional lateral transshipments between two independent locations and propose a bidirectional revenue sharing contract to coordinate the system.
Park et al., (2016) extend the transshipment models of (Rudi et al., 2001) & (Hu et al., 2007) by considering uncertain capacity of the supplier. They find that the sufficient condition for the existence of coordinating transshipment prices is more restrictive under supply capacity uncertainty and limitation than in the case of infinite capacity.
Li and Li, (2017) discussed the impact of bargaining power in a two-tier supply chain consisting of a manufacturer and two symmetrical retailers with bidirectional transhipment between them.
Nature of Stock Management Policy
Most research work focuses on policies (No Pooling) and (Complete Pooling). For the first policy of transshipment, we cite some research (Guan & Zhao, 2010, Glock, 2012) and for the second policy of transshipment, we give as example (Bouma et al., 2014).
First, we are interested in the problem of transsipment cooperated with the stock management policy (R, S).
In this field, at the end of each basic period, the stock is evaluated, the possible emergency transshipments are then carried out simultaneously and a supply order is placed if it is a revision period. This work generally adopts the deferred claims hypothesis. Recall that the policy (R, S) is particularly appropriate under the assumption of negligible command / setup costs.
Examples of work emphasizing the importance of politics (R, S), (Banerjee et al., 2003) and (Burton & Banerjee, 2005), which focused on the evaluation, by the and 2, 4, and 8 retailer site configurations, the benefits of policy-based transshipment (Complete-Pooling), and those of preventive transshipment.
The research of (Herer et al., 2004)) focuses on the study of a stock system composed by multi-retailers that are not identical in terms of costs, without constraints of carrying capacity to achieve a reactive transshipment. The random demands arriving at the warehouses are supposed to be correlated (the demands are independent, identically distributed (i.i.d)).
The work of (Özdemir et al., 2006)) focused on the research of (Herer et al., 2004) considering transport capacity constraints according to which the transshipment quantities between deposits located at the same level are limited by the capacity of the means of transport. These researchers have developed an effective stochastic approximative approach using Monte Carlo simulation. The numerical results show that transport capacity constraints increase the global cost as well as alter the distribution of inventory throughout the network.
The same problem studied by (Özdemir et al., (2006)) was also treated by (Ekren & Sunderesh, 2008)) applying the simulation-optimization method of resolution. The optimization procedure is performed by the OptQuest of the ARENA®software.
Hu et al., (2007) studied a storage system consisting of two retailers and they focused on emphasizing the non-coordination of transshipment prices.
Archibald et al., (2009), for their part studied a model composed of multi-retailers not identical in terms of costs, without constraints of transport capacity to achieve a transshipment. The demands arriving at the sites follow the fish law (the demands are independent, identically distributed (i.i.d)). To solve this problem they use Markovian resolution methodology.
Pazhani et al., (2015) focused in their research work on reducing the global cost of the storage system by minimizing the cost of disruption (minimizing the service rate) and transportation costs, and reducing the cost of transportation. improving the efficiency of the supply chain by making the best decision by selecting the optimal supplier under a stochastic demand constraint.
Second, we focus on the relationship between transshipment with stock management policy (s, Q)
About this, for work that has adopted the continuous revision policy, the system (s, Q) is the most commonly used because it is relatively simple. Investigations have been conducted under the two assumptions of lost-demand systems and delayed-demand systems.
Evers (2001), developed two heuristics to determine the conditions in which transshipments generate benefits for the stock system.
The first heuristic seeks to solve the problem of the transshipment of a single unit and the second addresses the transshipment of multiple units (multiple sites). The all-or-nothing transshipment policy is adopted in the (Evers (2001)) model with a linear transshipment cost, depending solely on the quantity transferred.
The research (Minner et al., (2006)) focuses on a relaxation of the hypotheses of (Evers, 2001) by accepting transshipments by quantities lower than those demanded and by adding a fixed cost per satisfied query. They also completed the model by taking into account the cost of supply as well as any possible costs of disruption as a result of the transshipment decision.
Satyendra and Venkata, (2005) studied a storage system (s, Q) composed by two-retailers assuming that the demand is random and follows the Normal N law (for that they applied the method of resolution by Simulation for search for the best solution in terms of global cost and rate of service (Olssen., 2009, 2010) was interested in solving the problem of "unidirectional lateral transshipment" in (s, Q) or (S -1, S) with deferred or lost demands.
Olssen (2015) studied a storage system (s, Q) composed of a distribution center and two retailers, he applied the analytical resolution method to find the optimal solution by applying the policy of transshipment (Partial Pooling).
We focus- on the cooperation between the problem of transshipment with the stock management policy (S-1, S). In this context, the study by (Wong et al., 2005), is one of the few to have assumed that the time of non-negligible transshipment and a delayed transshipment (ie in case of rupture at a warehouse, if no deposit has stock available so the transshipment is delayed (put on hold) until the stock becomes positive in one of the storage sites).
Liu and Lee (2007) focused their research on a single-level, multi-product and multi-retail stock system. They emphasized the influence of partial transshipment on reducing global cost by applying the Markovian method of resolution.
Paterson, et al., (2012) analyzed an inventory system consisting of a single-level, single-product and two-retailers. They demonstrated the importance of making a decision to make the transshipment only if the stock position is above a set threshold. To solve this problem, he applies the analytical resolution method.
Seidscher and Minner, (2013) examined policy (S-1, S) in a stock system composed of a distribution center and N-Retailers, to determine an optimal trans-shipment policy, they applied, first Instead, the policy reacts to minimize the out-of-stock rate, but they deduce that the amount of unsatisfied order is high. For this, they have combined this policy of transshipment with another proactive, which results in an efficient improvement of the optimal result in terms of cost and rate of service.
Patriarca et al., (2016) studied a two-tier stock system, the first includes a distribution center and a maintenance department for repairable parts. The second echelon contains a large number of retailers. First, they applied Complete-Pooling when using transshipment, then they set a threshold beyond which they would make the decision to apply such transshipment.
Finally, we aim to study the transshipment problem with stock management policies (s, S) and (R, s, S)
In this area, the study of transshipment for stock systems (s, S) or (R, s, S) has given rise to relatively less work, probably because of its more complex nature.
Hu et al., (2005) examined the policy (R, s, S) in a stock system composed of a distribution center and multiple-retailers with centralized stock management at the distribution center level to improve the overall performance of the system whole. The assumptions considered in their model are very restrictive: zero supply and transshipment times, identical demand parameters, identical costs and infinite time horizon. In this framework, the authors proposed a dynamic programming approach to find the approximate optimal policy (s, S) of the entire system at the distribution center level.
Tlili et al., (2010) examined the policy (R, s, S) in a two-step inventory system, the first contains a distribution center with infinite storage capacity and the second composed of multi-retailers. Their research aimed to reason the benefits of complete-pooling and those of partial-pooling on cost reduction. To solve this problem, they applied the "Simulation-Optimization" resolution method and they showed that "partial-pooling" is more efficient than "complete-pooling", because with a partial transshipment, there remains such a quantity in deposit in overstock position, which may reduce the amount of order lost; this will improve the optimal result in terms of global cost and service rate by reducing the unsatisfied amount of customer demand.
Previous works have tended to assume that the demand function is linearly dependent on variables such as retail price or promotion cost, and that the constant term of the function, which is usually referred to as the initial market share, is disrupted by a variation (Shen &d Li., 2016). We argue that the conventional technique of modeling a demand disruption is not suitable for characterizing disruption of stochastic demands. The conventional characterization of demand disruption is to assume there is an additive variation on the experienced demand value (Shen & Li., 2016). However, when a demand is stochastic, it is hard to recognize whether an additive difference between the materialized demand value and the experienced demand value is due to the demand disruption or the essential uncertainty of the stochastic demand. So it is necessary to develop an alternative method to characterize the disruption of stochastic demands. In addition, in the presence of today's economic globalization, consumer demands are becoming even more unstable since they can be disruptedvery frequently, and even continuously (Grossman, 2016; Wolcott, 2016). This fact requires that the desirable characterization of disruption of stochastic demand should not only give the disrupted value biasbetween materialized value and the experienced value, but also reflect the decreasing systemic stability.
Xiao and Shi (2016) examined the problem of dual channel SC coordination where the manufacturer's production process works to a random yield rate. Since in this situation shortages are common, optimal decisions and coordination in SC are significant.They proposed two priority strategies to optimize decision variables.
Ji et al., (2017) considered demand disruption in a two-stage supply chain from the manufacturer to the retailer and then to the consumer, with a transshipment-before-buyback contract. This contract was also investigated for a supply chain of two retailers and a manufacturer and showed that it was beneficial for all parties to enter this contract. Their results also showed that a predetermined or negotiated transshipment price could benefit all parties where there is a disruption in demand and that a buyback guarantee does not influence transshipment price despite a manufacturer's incentive.
Mathematical Modelling
Hypotheses
n: the number of retailers which set at three;
i: the index of retailers, with i = 1, 2, 3;
The demand of each retailer i is uncertain, stationary and independent of the demands of the other warehouses (i.i.d),
The stock control is done periodically according to the storage policy (R, S_i),
At the start of each supply cycle, an order of size Q_i is placed to reach the replenishment level S_i,
The distance between the retailer and the central warehouse is very long, which implies a long lead time and a high procurement cost,
The distance between the different retailers is short, because they are located on the same level, so that the transshipmnet time will be negligible,
The cost of transshipment changes from one pair of retailers to another, but it remains low,
In the event that depot 1 faces an effective out of stock and if the warehouse of the same level 2 or 3 has a surplus of stock, then a "lateral transshipment" of the necessary quantity will take place from 2 to 1 and / or from 3 to 1 to respond in a more efficient manner and at the right time to the random customer demand of retailer 1: this is the case with “Transshipment-Réactif” which aims to eliminate a feasible disruption. Otherwise he can place an order of size Q_(i )to the central warehouse.
But, before applying transshipment, it is necessary to study the following steps:
Control the inventory level of each storage depot;
Observe the customer demand of each retailer;
If there is an actual stock shortage in such a warehouse, the stock of the one belonging to the same level must be checked;
If the retailer at the same level has excess stock and can fill the break from the other site, this will require the application of transshipment;
When retailers collaborate with each other with transshipment, the necessary policy must be taken (“Complete-Pooling”, “Partial-Pooling”);
The transshipment will be applied at a very low cost compared to that of an emergency order from the central warehouse;
Satisfy aggregate demand;
Any unfulfilled request after the application of the transshipment will be lost;
Determine the stock position after the demand has been satisfied by transshipment.
The Main Simulation Models for the Different Transhipment Strategies
Having decided that sites will fully share their stocks in the event of a risk of shortage, the objective of this paragraph is to determine how that risk can be most effectively shared in the event that only one site has a shortage of stocks while the other two have a surplus, or two sites run out of stock and they request the necessary amount from the third site which has excess stock. As there can be two shippers or two receivers of a surplus of stocks that will be shared between them, it is necessary to define a lateral transfer strategy of product which will make it possible to determine the channels and quantities to be transferred in the event of 'a shortage in the stock. In this model, three strategies were proposed: the Random Transshipment Strategy, the strategy according to the distance between the retailers which are named by the Strategy according to the Proximity of the retailers (Retailer Proximity Strategy) and the Strategy according to the Risk level (Risk Balancing Strategy).
The Arena simulation software was used to develop the simulation model of the supply network. Arena, developed by Rockwell Automation, is a simulation and automation software based on SIMAN processor and simulation language.
Random Transshipment Strategy:
- If Retailer 3 is faced with an actual out of stock, (PS3T<0), while, warehouses 1 and 2 are in a surplus stock position (PS1T> 0 and PS2T> 0), the source site which extradites the quantity needed to decrease the number of lost orders at warehouse 3 is chosen at random.
- If warehouses 1 and 2 face an effective stock shortage (PS1T<0 and PS2T<0), while the storage site 3 has a surplus of stock (PS3T> 0), the choice of the depot which receives the product is done arbitrarily and without constraint.
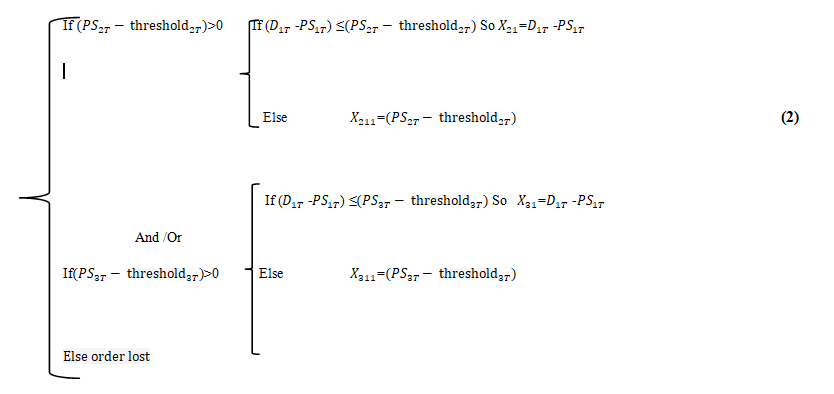
Taking for example, if retailer 1 faces a shortage of stock, the choice of donor of the quantity of the necessary transshipment will be carried out randomly, then, in case of "Complete-Pooling", if,

For the first transshipment strategy called “Random Transshipment Strategy” and more precisely for the “Complete-Pooling” transshipment policy, the modeling by the ARENA 16.0 software can be presented in figure 1.

Figure 1 The Simulation Model SC: Complete-Pooling for Random Transshipment Strategy
While, for the “Partial-Pooling” policy,
For the “partial-pooling” transhipment policy, the modeling by the ARENA 16.0 software can be presented in figure 2.

Figure 2 The Simulation Model SC: Partial-Pooling for Random Transshipment Strategy
Retailer Proximity Strategy:
In our research work, we introduce the notion of the distance between the storage sites located at the same level; this gives priority to the nearest depot to transfer or to receive the necessary quantity of transshipment. In fact, we are adding another strategy called the “retailer proximity strategy” which allows to:
- If site 1 is confronted with an effective out of stock (PS1T<0) while 2 and 3 have a surplus of available stock (PS2T> 0 and PS3T> 0), the first shipper of the quantity necessary to eliminate the shortage in 1 is the closest one between the other two storage sites 2 and 3.
So for the first “Complete-Pooling” transshipment policy
But, for the second transhipment strategy called “Retailer Proximity Strategy” and specifically for the “Complete-Pooling” transshipment policy, the modeling by the ARENA 16.0 software can be presented in figure 3.

Figure 3 The Simulation Model SC: Complete-Pooling for Retailer Proximity Strategy
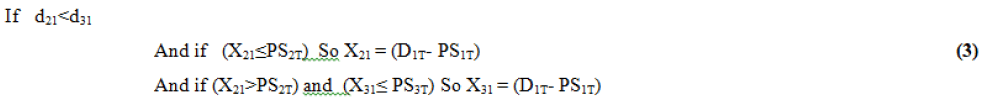
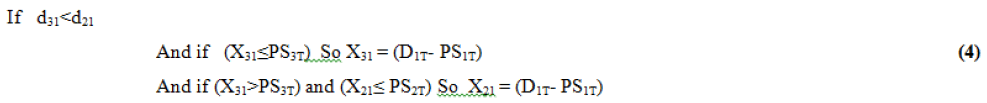
But, for the second policy, "Partial-Pooling":
- If d21<d31
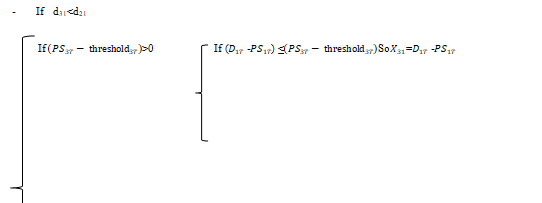
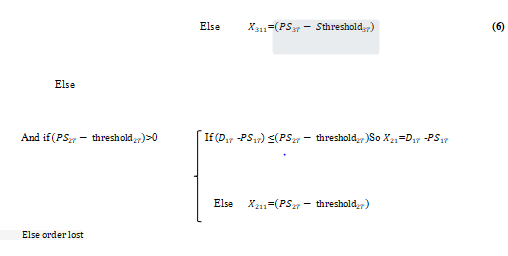
Whereas, for the second transshiopment policy, "Partial-Pooling", the modeling modeling by the ARENA 16.0 software can be symbolized by the figure 4.

Figure 4 The Simulation Model SC: Partial-Pooling for Retailer Proximity Strategy
Risk Balancing Strategy:
In fact, in the real world, to better cope with the shortage, you have to take into account the risk of the stock shortage. For this, we add another strategy called “the strategy of transshipment according to the confrontation of the risk”. It aims to redistribute the stock for all the same level retailers who collaborate with each other to better improve the Global Average Profit of the entire system while minimizing the Average Global Servicing Rate as much as possible.
This strategy requires that:
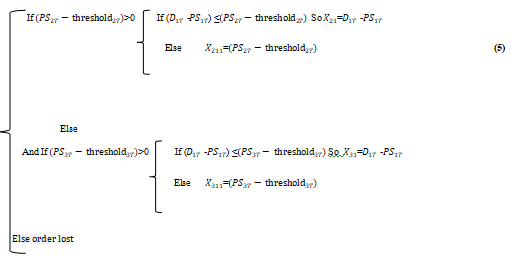
- If depot 1 faces a shortage of stock (PS1T<0), whereas, warehouses 2 and 3 have a surplus of stock (PS2T> 0, PS3T> 0), the necessary quantity which makes it possible to eliminate the stock which is missing in depot 1, for the first “Complte-Pooling” transshipment policy will be formulated by equation (7).

But for the last transhipment strategy “Risk Balancing Strategy” and precisely for the “Complete-Pooling” transhipment policy, the modeling by the ARENA 16.0 software can be presented in figure 5.

Figure 5 The Simulation Model SC: Complete-Pooling for Risk Balancing Strategy
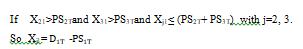
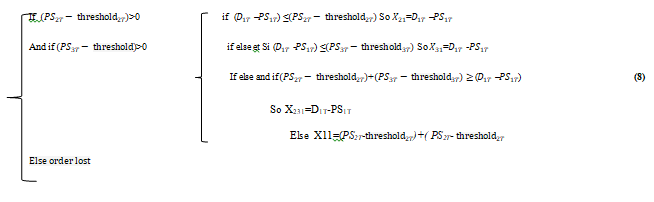
Whereas, for the second "Partial-Pooling" transshipment policy, this quantity transported laterally between retailers will be formulated using equation (8) Figure 6.

Figure 6 The Simulation Model SC: Partial-Pooling for Risk Balancing Strategy
Formulation of the problem
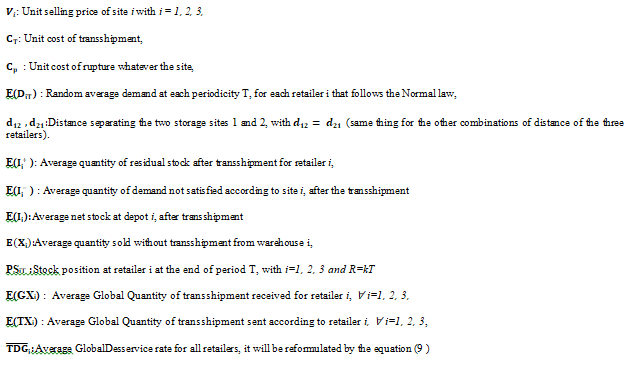
Notations:
We adopt the following notations:
Global Profit Function Without -Transshipment
The Average Global Profit without transshipment in a three-retailer inventory system with a linear transshipment cost includes the quantity sold without transshipment and the unfulfilled order quantity.
The mathematical formula of the Average Global Profit without transshipment for this stock system can be formulated by equation (10).

Profit Function With –Transshipment
The Average Global Profit with integration of transshipment for a multi-retailer distribution system contains both the quantity supplied without the integration of transshipment, the quantity of transshipment transferred between retailers at the same level and the quantity lost.
The mathematical formula of the Average Global Profit for this storage system with the application of transshipment, for the "Complete-Pooling" transshipment policy will be formulated by equation (11).

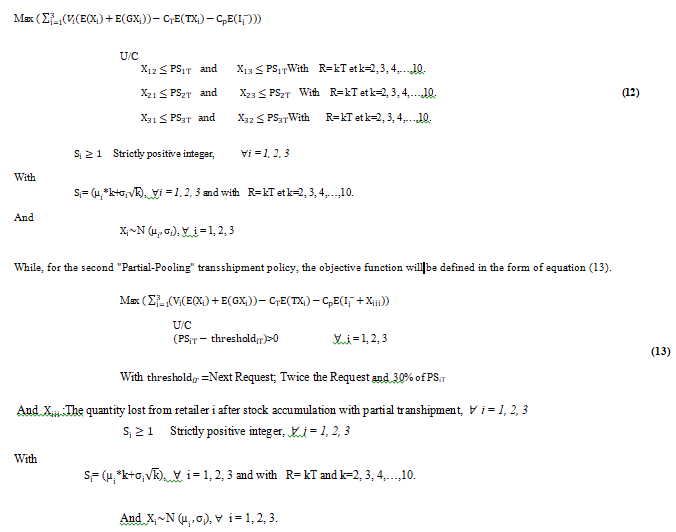
Objective Function
The objective is to improve the Average Global Profit of the distribution system over a finite time horizon R, composed of T periods. It includes the selling price, the unit cost of transshipment and the cost of rupture.
The mathematical formulation of the objective function, for the first "Complete-Pooling" transshipment policy, then takes the form of equation (12).
Characteristics of the Methodology Applied (Discrete Event Simulation)
Because of the limits of analytical resolution for certain aspects, remains complex and very difficult to solve. In particular, because the distribution of demand is random which makes the stock position for each retailer to be unknown and difficult to calculate, this leads us to resort to an approach by Discrete Event Simulation which we have given the possibility, at the same time, to relax the restrictive assumptions considered in the mathematical model and to analyze in a more detailed way the contributions of the transshipment and its sensitivity to different parameters (periodicity "T", threshold and unit cost of transshipment).
We describe, in the following section, the chosen resolution approach and the simulation model.
Besides, in our research work we assume that customer demand is a random variable, which leads to the application of the discrete event simulation approach. It consists of computer modeling by applying ARENA software, where the change in the state of a stock system over time is a series of discrete events. Each event (random demand) occurs at a given time and changes the state of the system.
Moreover, in this approach, we start by listing any events or state changes that may be encountered during the evolution of the inventory quantity. Then the logic of state changes is modeled in the form of algorithms by defining, for each type of event, the state conditions leading to the occurrence of the event as well as the corresponding state changes. The simulation of the stock system is obtained by executing the state change logics associated with each event on the date on which it occurs.
Analysis of the Results
We recall that the structure of the network considered in this paper is composed of a distribution center and multi-retailers, which are faced with random requests which follow a Normal law of the mean μ and the standard deviation σ. These requests are independent and identically distributed (i.i.d).
We then assume that :
R = 28 days,
C_T=1$, 3$,
C_pi= 30$,
V1=150$, V2=200$ et V3=170$,
k= 2, 3, 4, 5, 6,7 ,8 ,9 ,10.
We solved our problem via the simulation approach by successively testing the effect of "Complete-Pooling" and "Partial-Pooling" transshipment policies on the Average Global Profit and Average Global Desservice Rate.
But for a number of retailers greater than two, it is necessary to choose the recipient and the recipient of the quantity transferred laterally between sites at the same level. This leads to a first study which focuses on choosing the best transshipment strategy in terms of economic profitability.
To select the best strategy, we considered the following performance measures for evaluating the contribution of the transshipment:
• The number of orders fulfilled through transshipment,
• The quantity of transshipment transferred from a storage site which is in an overstock position to that of the same echelon which faces a rupture,
• The quantity of unsatisfied order at a retailer (quantity lost),
• The Average Global Profit at a retailer,
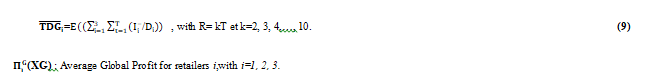
• The Average Global Desservice Rate.
Comparison of Similarity of Retailers
We assume that retailers face random demand that follows the Normal Law. But they are not the same in terms of the mean and standard deviation. For this we propose that the demand of the first retailer follows the law N (100,20), the second follows the law N (200,50) and the last follows the law N (150,30).
Table 1 presents an extract from various measurements of the initial level ofcompletelyS_i^0for these different demands with i = 1, 2, 3.
| Table 1 Determination of Different Measures of The Initial Level of Replenishment | |||
| K |  |
 |
 |
| 2 | 229 | 470 | 343 |
| 3 | 335 | 687 | 501 |
| 4 | 440 | 900 | 660 |
| 5 | 545 | 1112 | 817 |
| 6 | 648 | 1322 | 973 |
| 7 | 753 | 1532 | 1130 |
| 8 | 857 | 1741 | 1285 |
| 9 | 960 | 1950 | 1440 |
| 10 | 1063 | 2158 | 1595 |
Numbers represented in Table 2 and which are calculated by simulation using ARENA software reveal the effect of similarity of retailers on ProfitGlobal Average.
| Table 2 Determination of the Effect of Retailer Similarity on Profit Global Average | ||||||||||
| k | Détaillants Similaires | Détaillants Non Similaires | ||||||||
| Without –transshipment | Complete-Pooling | Partial-Pooling | Without-transshipment | Complete-Pooling | Partial-Pooling | |||||
| Twice the Demand | Next Demand | SS=30% of PSiT | Twice the Demand | Next Demand | SS=30% of PSiT | |||||
| 2 | 75670 | 80626 | 82697 | 93997 | 110076 | 72350 | ||||
| 78350 | 79590 | 87367 | 93670 | |||||||
| 3 | 133770 | 162904 | 165585 | 175999 | 187915 | 130325 | 155657 | 157693 | 172750 | 179690 |
| 4 | 155521 | 170978 | 173539 | 225498 | 234468 | 151235 | 167695 | 168665 | 220567 | 229567 |
| 5 | 143871 | 152975 | 153200 | 197250 | 212000 | 133773 | 147690 | 148693 | 185630 | 207580 |
| 6 | 127177 | 135233 | 137527 | 180360 | 197725 | 120688 | 129369 | 130366 | 176900 | 189750 |
| 7 | 112483 | 128157 | 129330 | 165200 | 179650 | 109796 | 119255 | 112696 | 155650 | 170670 |
| 8 | 105790 | 113230 | 117520 | 157590 | 170600 | 100903 | 105360 | 107655 | 149950 | 162530 |
| 9 | 99097 | 107200 | 109330 | 142597 | 160750 | 99307 | 101569 | 103575 | 133695 | 155765 |
| 10 | 98403 | 102256 | 105530 | 130950 | 150500 | 973819 | 99690 | 100570 | 122670 | 140670 |
We notice from the analysis of Table 2 that the groups of retailers who face similar demands outperform from an economic point of view those who face non-similar demands and this is explicit in terms of relative improvement of the Average Global Profit of the “Without-Transshipment” policy and also with the application of “Transshipment”.
For that we assume in what follows, that the random requests are identical and follow the law N (200,50).
Comparison between the Different Strategies In Terms Of Average Global Profit
Comparison between the two transshipment strategies: “Random transshipment strategy” and “Retailer proximity strategy”
Table 3 presents the different values of Average Global Profit for three storage sites located at the same level. First, we evaluated by simulation and using ARENA software these results without the application of transshipment between depots. Next, we study the possibility of existing cooperation between different retailers, and we seek to evaluate the performance of transshipment between warehouses on improving the economic profitability of the whole centralized system. This evaluation is done in the first place without taking into consideration any constraint, that is, by applying the "random transshipment strategy".
| Table 3 Determination of the Average Global Profit According to the Random Transshipment Strategy | |||||
| k | Average Global Profit | ||||
| Without-Transshipment | Complete-Pooling | Partial-Pooling | |||
| Twice the Demand | Next Demand | SS=30% of PSiT | |||
| 2 | 75670 | 80626 | 82697 | 93997 | 110076 |
| 3 | 133770 | 162904 | 165585 | 175999 | 187915 |
| 4 | 155521 | 170978 | 173539 | 225498 | 234468 |
| 5 | 143871 | 152975 | 153200 | 197250 | 212000 |
| 6 | 127177 | 135233 | 137527 | 180360 | 197725 |
| 7 | 112483 | 128157 | 129330 | 165200 | 179650 |
| 8 | 105790 | 113230 | 117520 | 157590 | 170600 |
| 9 | 99097 | 107200 | 109330 | 142597 | 160750 |
| 10 | 98403 | 102256 | 105530 | 130950 | 150500 |
We note, first of all, that these results verify those already obtained by the mathematical model of equations ((10) and (11)), for a stock system composed of three identical and independently distributed retailers (i. i. d).
By comparing the results of (Emel and Lena, 2017) where the number of collaborators is equal to two, with those found in this research for the same instances (the random requests are identical). It turns out that the Average Global Profit forecast by the sites in the group of two employees is lower than that forecast by the sites in the group of three. This means that the greater the number of sites in a group, the greater the gains, because breaking risk sharing is more effective when there are more sites sharing their inventories and there are more sources possible of lateral transfer in the event of an imminent out of stock..
From the table 3 and figure 7, we notice that the Average Global Profit has evolved by applying cooperation between retailers regardless of the periodicity. The percentage of relative improvement in the "Without-Transshipment" policy by applying cooperation between retailers ranging from 7% for k = 2 to 21% for k = 3 up to 10% for k = 4.

Figure 7 Average Global Profit
However, this improvement in profitability will be limited until the analysis of the effect of the distance constraint by applying the second transshipment strategy called "strategy according to the proximity of retailers".
For that, we require this constraint between the various retailers of the same level. So, we study all the possible combinations for these three sites (1, 2 and 3).
1^(st )Constraint : d_23<d_12<d_13
First, we require the second constraint by assuming that the distance between the two sites 2 and 3 is shorter than that between depot 1 and warehouse 2 and the latter is smaller than that between depots 1 and 3.
The table 4 summarizes the different results obtained by simulation by applying the first distance constraint.
| Table 4 Determination of the Global Profit average According to the Retailer Proximity Strategy | |||||
| k | Without-Transshipment | Complete-Pooling | Partial-Pooling | ||
| Twice the Demand | Next Demand | SS=30% of PSiT | |||
| 2 | 75670 | 83045 | 84577 | 98697 | 112277 |
| 3 | 133770 | 177780 | 179273 | 180933 | 195199 |
| 4 | 155521 | 180107 | 185765 | 230113 | 237165 |
| 5 | 143871 | 167675 | 172200 | 210750 | 221000 |
In fact, the “Complete-Pooling” transshipment policy improves the Average Global Profit of the random transshipment strategy by a value of 3% for k equal to 2, to 9% for k equal to 3 and finally to 5 % for k equal to 4.
However, the “Partial-Pooling” policy acts on this improvement by varying the threshold for transshipment.
In fact,
- For a threshold = Twice the Demand: the “Partial-Pooling” transshipment policy improved the Average Global Profit of the random strategy by a relative improvement value equal to 2% for k equal to 2, then to 8 % for k equal to 3 and finally to 7% for k equal to 4.
- For a threshold = Next Demand: the average Global Profit of the previous strategy has improved by applying this threshold by a value equal to 5% for k equal to 2, then to 3% for k equal to 3 and finally to 2% for k equal to 4.
- For a threshold = 30% of PSiT: the percentage of relative improvement of the previous strategy for a threshold equal to "30% of PSiT" is worth 2% for k equal to 2, to 4% for k equal to 3 and to 2% for k equal to 4.
From this table, we see that, for all the examples, the estimates calculated, with the application of the "Random Transshipment Strategy" have been increased by the integration of the first distance constraint. But the percentage of this improvement does not exceed 9%.
2^th Contraint : d_13<d_12<d_23
Next, we assume that, the distance separating the two sites 1 and 3 is shorter than that between depot 1 and warehouse 2 and the latter is narrower than that between depots 2 and 3.
From table 5, we notice that the Average Global Profit of the first strategy (Random) with the integration of the second proximity constraint between the different retailers has been improved but also with low percentages and close to those of the first constraint. Indeed, through the application of the "Complete-Pooling" transshipment policy, this percentage never exceeds 6%, and also, with the second "Partial-Pooling" policy, this value reaches only 5%.
| Table 5 Determination of the Average Global Profit According to the "Transshipment Strategy According to the Proximity of Retailers" | |||||
| k | Without-transshipment | Complete-Pooling | Partial-Pooling | ||
| Twice the Demand | Next Demand | SS=30% dof PSiT | |||
| 2 | 75670 | 82939 | 83997 | 972520 | 111980 |
| 3 | 133770 | 170665 | 171957 | 178115 | 193552 |
| 4 | 155521 | 181100 | 182997 | 228055 | 235978 |
| 5 | 143871 | 169205 | 165000 | 207957 | 210005 |
3^(Th )Contraint : d_12<d_13<d_23
After that, we propose that, the distance between the two sites 1 and 2 is shorter than that between the depot 1 and the warehouse 3 and the latter is shorter than that between the depots 2 and 3.
From the analysis of Table 6, we notice that the Average Global Profit of the random lateral transfer strategy, by applying this constraint of the distance tends to increase with a percentage improvement ranging from 3% to 8% for the “Complete-Pooling” policy while it reaches 7% for the second “Partial-Pooling” transshipment policy.
| Table 6 Determination of the Average Global Profit According to the Transshipment Strategy According to the Proximity of Retailers | |||||
| k | Without-transshipment | Complete-Pooling | Partial-Pooling | ||
| Twice the Demand | Next Demand | SS=30% of PSiT | |||
| 2 | 75670 | 85557 | 86517 | 95986 | 112277 |
| 3 | 133770 | 175785 | 177116 | 184519 | 194973 |
| 4 | 155521 | 176478 | 179097 | 223748 | 239380 |
| 5 | 143871 | 163205 | 165500 | 210750 | 230500 |
4^(th ) Contraint : d_23<d_13<d_12
Then, we assume that, the distance between the two sites 2 and 3 is shorter than that between the depot 1 and the warehouse 3 and the latter is shorter than that between the depots 1 and 2.
According to Table 7, by integrating this constraint of proximity between retailers, we will conclude that the “Complete-Pooling” transshipment policy improves the Average Global Profit of the first transshipment strategy by a percentage ranging from 3% to 'at 7% while according to the use of the second transshipment policy, “Partial-Pooling” this relative improvement reaches 6%.
| Table 7 Determination of the Average Global Profit According to the "Transshipment Strategy According to the Proximity of Retailers" | |||||
| k | Without-transshipment | Complete-Pooling | Partial-Pooling | ||
| Twice the Demand | Next Demand | SS=30% of PSiT | |||
| 2 | 75670 | 83295 | 85873 | 97697 | 111160 |
| 3 | 133770 | 174037 | 175271 | 186387 | 190573 |
| 4 | 155521 | 175946 | 180765 | 239773 | 243930 |
| 5 | 143871 | 162905 | 166700 | 213750 | 237700 |
5^th Contraint : d_12<d_23<d_13
Then, we require that, the distance between the two sites 1 and 2 is more limited than that between the depot 2 and the warehouse 3 and the latter is narrower than that between the depots 1 and 3.
According to table 8, by requiring this constraint of proximity we find that, for the “Complete-Pooling” policy, the percentage of relative improvement of the Average Global Profit of the first transshipment strategy ranging from 5% to 8%. But, for the “Partial-Pooling” policy, this improvement also depends on the threshold of transshipment. Indeed for a threshold = Twice the Demand: this relative improvement in the Average Global Profit reaches 8%, then, for a threshold = Next Demandthe economic profitability of the first lateral transfer strategy undergoes an improvement of a percentage reached 7 %. And finally for a threshold = 30% of PSiT: the percentage of relative improvement in profitability also going up to 6%.
| Table 8 Determination of the Average Global Profit According to the "Transshipment Strategy According to the Proximity of Retailers | |||||
| k | Without-transshipment | Complete-Pooling | Partial-Pooling | ||
| Twice the Demand | Next Demand | SS=30% of PSiT | |||
| 2 | 75670 | 86657 | 87382 | 98637 | 114750 |
| 3 | 133770 | 176057 | 178887 | 187770 | 199673 |
| 4 | 155521 | 179819 | 181897 | 240263 | 247782 |
| 5 | 143871 | 169907 | 173900 | 212950 | 240300 |
6^(th ) Contraint : d_13<d_23<d_12
Finally, we require that, the distance between the two sites 1 and 3 is shorter than that between the depot 2 and the warehouse 3 and the latter is more limited than that between the depots 1 and 2.
By analyzing Table 9, and comparing it with the results of the random strategy, we notice that there is an improvement in the economic profitability of a percentage going to 9% for the “Complete-Pooling” transshipment policy, while that, for the second “Partial-Pooling” transshipment policy, it reaches 8%.
| Table 9 Determination of the Average Global Profit According to the "Transshipment Strategy According to the Proximity of Retailers" | |||||
| k | Without-transshipment | Complete-Pooling | Partial-Pooling | ||
| Twice the Demand | Next Demand | SS=30% of PSiT | |||
| 2 | 75670 | 87670 | 88575 | 99876 | 115230 |
| 3 | 133770 | 177670 | 179281 | 189387 | 200270 |
| 4 | 155521 | 181527 | 182992 | 241269 | 248725 |
| 5 | 143871 | 170925 | 175350 | 213250 | 241522 |
Note that, transshipment is generally significantly less expensive than an emergency order from a supplier if the side sites are located nearby. However, the benefits of transshipment should always be weighed against the costs involved.
It is for this reason, we conclude, whereas, the strategy of the transshipment "according to the proximity of the retailers" is more advantageous compared to the strategy of the random transfer in term of the economic profitability, but with a small percentage of improvement. . From this conclusion, we will study in the next section the comparison between the strategy of random transshipment and the “strategy of transshipment according to the risk confrontation”.
Comparison between the two strategies: "Random transshipment strategy" and "Transshipment strategy according to risk confrontation"
To make this comparison, we assume that in order to improve the fulfilled order quantity, we need to consider the risk of out of stock.
In fact, the strategy "according to the confrontationrisk "target to redistribute the stock among all the retailers to improve the Average Global Profit of the centralized system, through risk sharing between these collaborators.
Table 10 presents the different values found of the Average Global Profit by simulation using the ARENA software and applying the strategy "according to the risk confrontation".
| Table 10 Determination of the Average Global Profit for the Policies According to the “Strategy of Transshipment According to the Risk Confrontation” | |||||
| k | Without-Transshipment | Complete-Pooling | Partial-Pooling | ||
| Twice the Demand | Next Demand | SS=30% of PSiT | |||
| 2 | 75670 | 105122 | 107537 | 120560 | 131222 |
| 3 | 133770 | 182187 | 185667 | 201675 | 207556 |
| 4 | 155521 | 246914 | 247646 | 255079 | 267059 |
| 5 | 143871 | 207325 | 209270 | 230350 | 259520 |
Interpreting this table, we notice that, whatever the transshipment policy applied, the Average global Profit of the "Random Transshipment Strategy" has tended to increase by sharing the risk between the different retailers.
In fact, by applying the “Complete-Pooling” transshipment policy, the Average Global Profit of the first strategy undergoes an increase whatever the periodicity T. Indeed, for k = 2, the relative improvement percentage is equal to 30%, for k = 3 it will be equal to 12% and for k = 4 it becomes 45%.
While, by using the second transshipment policy, "Partial-Pooling", the Average Global Profit of the first strategy has been improved according to the threshold level. To do this, first of all, with the setting of the threshold at Twice the Demand, the latter increased with a relative improvement percentage ranging from 12% for k equal to 3 up to 43% for k equal to 4. Then , for a threshold fixing to the Next Demand, the economic profitability at all the retailers tended to improve by a percentage of 28% for k = 2, by 15% for k equal to 3 and by 13% for k equal to 4. Finally, with a threshold equal to 30% of stock position, the relative improvement percentage will be equal to 20% for k = 2, to 11% for k = 3 and to 14% for k = 4.
We will then conclude, from the values found in Table 10, that the "risk confrontation" strategy is more advantageous over the previous strategy because it makes the centralized system more profitable.
This comparison leads to the conclusion that the strategy of lateral transfer of product between sites (random, according to the level of risk or according to the proximity of retailers) influences the performance of the centralized stock system.
Conclusion
We have first of all dealt with in this paper the problem of transshipment to several retailers (n≥3) in a two-tiered distribution network, for this, we conducted an empirical study by studying three different transshipment strategies (random, depending on the proximity of retailers, and depending on the risk confrontation).
Then, we study the effectiveness of different strategies on the reduction of rupture risk and we conclude that, the strategy of transshipment according to the risk confrontation is the most economically profitable.
Finally, we set out to measure the impact of the input parameters on the benefit of transshipment policies, “Complete-Pooling” and “Partial-Pooling” for the transshipment strategy according to the risk confrontation and we note that an increase in terms of average demand leads to a deterioration in economic profitability by reducing the Average Global Profit and increasing the Average Global Desservice Rate. While an increase in terms of uncertainty (standard deviation) acts positively on improving the economic profitability of the whole centralized system.
References
Archibald, T. W., Black, D., & Glazebrook, K. D. (2009). An index heuristic for transshipment decisions in multi-location inventory systems based on a pairwise decomposition. European Journal of Operational Research, 192(1), 69-78.
Banerjee, A., Burton, J., & Banerjee, S. (2003). A simulation study of lateral shipments in single supplier, multiple buyers supply chain networks. International Journal of Production Economics, 81, 103-114.
Bouma, H. W., & Teunter, R. H. (2014). The routed inventory pooling problem with three non-identical retailers. International Journal of Production Economics, 156, 223-234.
Burton, J., & Banerjee, A. (2005). Cost-parametric analysis of lateral transshipment policies in two-echelon supply chains. International Journal of Production Economics, 93, 169-178.
Dan, B., He, Q., Zheng, K., & Liu, R. (2016). Ordering and pricing model of retailers’ preventive transshipment dominated by manufacturer with conditional return. Computers & Industrial Engineering, 100, 24-33.
Dehghani, M., & Abbasi, B. (2018). An age-based lateral-transshipment policy for perishable items. International Journal of Production Economics, 198, 93-103.
Dijkstra, A. S., Van der Heide, G., & Roodbergen, K. J. (2019). Transshipments of cross-channel returned products. International Journal of Production Economics, 209, 70-77.
Evers, P. T. (2001). Heuristics for assessing emergency transshipments. European Journal of Operational Research, 129(2), 311-316.
Fadoi, E. (2022). The “Lateral Transshipment” is a Cooperative Tool for Optimizing the Profitability of a Distribution System. In Innovation, Research and Development and Capital Evaluation. IntechOpen.
Glazebrook, K., Paterson, C., Rauscher, S., & Archibald, T. (2015). Benefits of Hybrid Lateral Transshipments in Multi-Item Inventory Systems under Periodic Replenishment. Production and Operations Management, 24(2), 311-324.
Glock, C. H. (2012). The joint economic lot size problem: A review. International Journal of Production Economics, 135(2), 671-686.
Grossman, R. The industries that are being disrupted the most by digital. Harvard Business Review. (2016), 3 (21).
Guan, R., & Zhao, X. (2010). On contracts for VMI program with continuous review (r, Q) policy. European Journal of Operational Research, 207(2), 656-667.
Herer, Y. T., Tzur, M., & Yücesan, E. (2006). The multilocation transshipment problem. IIE transactions, 38(3), 185-200.
Hu, X., Duenyas, I., & Kapuscinski, R. (2007). Existence of coordinating transshipment prices in a two-location inventory model. Management Science, 53(8), 1289-1302.
Kim, M. S., & Sarkar, B. (2017). Multi-stage cleaner production process with quality improvement and lead time dependent ordering cost. Journal of cleaner production, 144, 572-590.
Lee, C., & Park, K. S. (2016). Inventory and transshipment decisions in the rationing game under capacity uncertainty. Omega, 65, 82-97.
Li, X., Sun, L., & Gao, J. (2013). Coordinating preventive lateral transshipment between two locations. Computers & Industrial Engineering, 66(4), 933-943.
Liu, J., & Lee, C. G. (2007). Evaluation of inventory policies with unidirectional substitutions. European Journal of Operational Research, 182(1), 145-163.
Meissner, J., & Senicheva, O. V. (2018). Approximate dynamic programming for lateral transshipment problems in multi-location inventory systems. European Journal of Operational Research, 265(1), 49-64.
Minner, S., Silver, E. A., & Robb, D. J. (2003). An improved heuristic for deciding on emergency transshipments. European Journal of Operational Research, 148(2), 384-400.
Olsson, F. (2010). An inventory model with unidirectional lateral transshipments. European Journal of Operational Research, 200(3), 725-732.
Özdemir, D., Yücesan, E., & Herer, Y. T. (2006). Multi-location transshipment problem with capacitated transportation. European Journal of Operational Research, 175(1), 602-621.
Paterson, C., Kiesmüller, G., Teunter, R., & Glazebrook, K. (2011). Inventory models with lateral transshipments: A review. European Journal of Operational Research, 210(2), 125-136.
Paterson, C., Teunter, R., & Glazebrook, K. (2012). Enhanced lateral transshipments in a multi-location inventory system. European Journal of Operational Research, 221(2), 317-327.
Pazhani, S., Ventura, J. A., & Mendoza, A. (2016). A serial inventory system with supplier selection and order quantity allocation considering transportation costs. Applied Mathematical Modelling, 40(1), 612-634. (2015).
Reyes P, Man J and Jaska P. A disaster relief inventory model based on transhipment. Independent Journal of Management & Production, (2013),vol. 4, p 481-509.
Satyendra, K., & Venkata, R. V. (2005). Evaluating lateral transshipment policy in a two-echelon inventory system. Journal of Comparative International Management, 8(2), 12-22.22
Seidscher, A., & Minner, S. (2013). A Semi-Markov decision problem for proactive and reactive transshipments between multiple warehouses. European Journal of Operational Research, 230(1), 42-52.
Seifert, R. W., Thonemann, U. W., & Sieke, M. A. (2006). Integrating direct and indirect sales channels under decentralized decision-making. International Journal of Production Economics, 103(1), 209-229.
Wolcott, R.C. Does your business model look to the future or just defend the present?. Harvard Business Review (2016), 3 (22)
Received: 25-Aug-2023, Manuscript No. IJE-23-14059; Editor assigned: 28-Aug-2023, Pre QC No. IJE-23-14059(PQ); Reviewed: 11-Sep-2023, QC No. IJE-23-14059; Revised: 16-Sep-2023, Manuscript No. IJE-23-14059(R); Published: 23-Sep-2023