Research Article: 2021 Vol: 20 Issue: 2
The Global Macroeconomic Impacts of Covid-19: Four European Scenarios
Marino Alfonso, University of Campania Luigi Vanvitelli
Pariso Paolo, University of Campania Luigi Vanvitelli
Abstract
The COVID-19 outbreak has upset the EU economy. The evolution and its economic impact are highly uncertain which makes it difficult for governments, firms, as big Company and SMEs, workers, policymakers to formulate an appropriate European policy response. In order to better understand possible economic outcomes, this paper explores four different scenarios of how Covid 19 might evolve in the coming years using database by European Banking Authority (2020). It examines the impacts of different scenarios both on macroeconomic and markets outcomes in European Union by examining a previously macroeconomic theory in a new context such as Covid 19 pandemic. The scenarios elaborated by SPSS 26.0, highlights that even a contained outbreak could significantly affect the European economy in the middle rung in terms of public social values and these weaknesses could undermine the objectives of building a united Europe in addressing the crisis created by Covid 19. Policies, reforms and behaviors that bring us back to growth rates before the pandemic, with sustained, broad-based and balanced support, would also help to maintain easing conditions on financial markets, the reduction of the average debt burden and the promotion of a gradual rebalancing of public finances
Keywords
Pandemics, Scenarios, Economic Crisis, Europe.
Introduction
The COVID-19 outbreak is attributable to the SARS CoV-2 virus. The outbreak occurred in December 2019 in Wuhan City, Hubei, China. The virus continues to spread throughout the world and, in fact, is still present in our midst. The epicenter of the outbreak In Europe was Italy, northern Italy, with reported cases in either South or being travelers from northern. After Italy, in Europe, four epicentres have been identified: France, Spain, Germany, in reality the virus is in all European countries and it is a worldwide experiment. This global experiment sheds light on two interrelated aspects: epidemiology and economics. The World Health Organisation (WHO) at the epidemiological level declares the pandemic state (Kaplan et al., 2020) as an international public health emergency. In addition to the epidemic crisis, there is the economic crisis. The global economic slowdown is a reality, shared by both advanced and developing nations (Caunhye et al., 2012). The European market has broken out: the job market has a high unemployment rate, products on the market are slowing down and consumers may not pay attention to old and new products (Chodorow-Reich et al., 2019). The state of only one country and the European Union join forces for the first time to fight the economic and health crisis affecting all Member States. From an economic perspective, Table 1 shows real GDP growth (Hornbeck & Moretti, 2019) in European countries between 2020 and 2022.
| Table 1 Real Gross Domestic Product Growth Rate Forecasts in European Countries From 2020 to 2022 | |||
| Countries | 2020 | 2021 | 2022 |
| Greece | -9.7 | -4.2 | 2.2 |
| Italy | -9.5 | -6.5 | 2.2 |
| Spain | -9.6 | -7 | 2.3 |
| Croatia | -9.3 | -7.5 | 2.4 |
| United Kingdom | -8.6 | -6.3 | 2.6 |
| France | -8.6 | -6.3 | 2.4 |
| Ireland | -7.6 | -6.2 | 2.7 |
| Lithuania | -7.8 | -5.7 | 2.8 |
| Cyprus | -7.4 | -4.7 | 2.4 |
| Bulgaria | -7.2 | -6.7 | 2.2 |
| Belgium | -7.8 | -6.8 | 1.4 |
| Slovenia | -7 | -5 | 3.2 |
| Latvia | -7.4 | -4.3 | 2.6 |
| Hungary | -7.4 | 6.3 | 2.3 |
| Estonia | -7.4 | -7.3 | 2.3 |
| Netherlands | -7.6 | -5.7 | 2.4 |
| Portugal | -7.3 | -6.6 | 2.3 |
| Slovakia | -6.7 | -6.2 | 2.4 |
| Germany | -5.6 | -4.2 | 3.2 |
| Finland | -5.5 | -5.7 | 2.4 |
| Czechia | -5.2 | -4.2 | 2.7 |
| Sweden | -5.7 | -3.6 | 2.4 |
| Romania | -5.2 | -4.6 | 2.4 |
| Denmark | -4.3 | -3.2 | 2.8 |
| Malta | -5.8 | -4.2 | 2.1 |
| Austria | -5.4 | -3.2 | 2.7 |
| Luxembourg | -5.2 | -3.2 | 2.2 |
| Poland | -4.2 | -3.2 | 2.1 |
The data in Table 1 (Appendix-Figure 1A) shed light on the current and future deep economic crisis in the Member States of the European Union. A crisis which foresees weak signs of recovery in late 2021. This scenario requires the entire European government to undertake the powerful investment and support actions for the economies of the European countries. To support member states, the following economic policy response to the COVID-19 pandemic has been developed, linked to three common macro-actions: Values, Policies and Investments (O’Reilly et al., 2015). Considering that the emergency Covid19 highlighted a scenario in constant evolution in which it is possible to catch only new trajectories, in order to better understand possible economic outcomes. For this reason, there is not a wide scientific literature that points out the future evolution at macroeconomic level of the phenomena. This paper, trying to bridge this gap, explores four different scenarios of how Covid 19 might evolve in the coming years using database by European Banking Authority (2020). It examines the impacts of different scenarios both on macroeconomic and markets outcomes in European Union by examining a previously macroeconomic theory in a new context such as Covid 19 pandemic (Salamzadeh, 2020).
Values
The Covid-19 pandemic corresponds to one never seen before challenge, with deep socio-economic consequences. The European government will make every effort to steer this challenge in a spirit of solidarity. Starting from a spirit of solidarity is required to implement actions that must develop a health strategy that supports economic activity and prepares the first stage of the recovery. In European Commission (2020) documents’ this strategy should combine short, medium and long run outcomes, taking into account both, economic and health outcomes. Several measures have already been taken at Member State and European Union level, in accordance with the Eurogroup declaration.
Policy
Following this line of action, a letter from the President Eurogroup (2020) indicated that other strategic elements of the political response were expanding. At this level and for the first time, the European Council, in its statement of 26 March, invited all Member States, to present proposals for the economic actions related to the Covid-19 pandemic within two weeks. In response to the mandate of the Member States, this declaration takes into account actions in an overall and coordinated economic logic. Key policy measures are implemented to:
• Fiscal stimulus;
• Public resources;
• Healthcare sector;
• Civil protection;
• Workers;
• Economic sectors.
A significant level of liquidity in all Member States is allowed and guaranteed, in order to provide policy actions that response to the deep crisis underway. Under these assumptions, it is possible to introduce new flexibility into European Union rules.
Investments
Policy actions, offer the flexibility necessary to the national budgets. The Member States, following these actions, may support national economies and to respond in a coordinated manner to the impact of the Covid-19 pandemic. It is interesting to note that political actions give the necessary flexibility to national budgets. The Member States, following these actions, may support national economies and to respond in a coordinated manner to the impact of the Covid-19 pandemic. The European Commission extends flexing action also to use public procurement framework, for all Member States, in this emergency. These actions are also linked to the decision to issue a specific framework to expedite public support to companies, without affecting the sphere in the Single Market. Furthermore, the Commission to make best use of the EU budget to fight the crisis (Ebbinghaus, 2015). These resources will be allocated in the context of cohesion policy and added to the Solidarity Fund. This investment policy will be implemented by the European Central Bank to support liquidity and financing conditions for administrations, businesses and banks, this will help maintain a steady supply of credit to the economy. This is an interesting decision related to the first phase of the outbreak, particularly in the Member States in which the big company, SMEs, banks, administrations and all private services were closed in order to realize the laws “stay at home”. These measures should ensure that all economic sectors can benefit from investments and conditions capable of coping with the economic crisis. The investments should help Member States to overcome the pressure of the economic crisis, making full use of the extra budget. There is a focus on SMEs, related to the time that the bank must spend to make liquidity available to SMEs, the strength advice is immediately. Nevertheless, the budget will be delivered within the regulatory framework by continuing to follow the course of the crisis. In fact, it is possible, if necessary, for the European Commission to take new measures, including legislative measures, to alleviate the impact of the economic shock. It is noteworthy that such measures may be particularly appropriate in certain Member States, with relatively small capital reserves and high levels of non-performing lending that can reduce the positive impact of a supplementary budget on bank loans. --Supporting national health systems is another strategic outcome to be achieved. This support reflects European funding in the coming semester. This instrument may provide support national health system's budget. This action is linked to the new recruitment of doctors and nurses in each Member State and investments in new critical care treatments. The national health systems are within largest safety net systems. Safety nets should be reorganized with instruments that could be used, as required, in a manner that is tailored to the nature of the economic crises caused by Covid-19. This backstop should be accessible to all Member States, with only one delivery system. This is an added challenge to the European Union and its government. The only requirement to access the safety net will be that Member States requesting support would commit to using this credit line to support both domestic healthcare and safety. In this framework, the executive proposal is supported to mitigate Unemployment Risks in Emergency (SURE), related to need to establish, for all emergency time, a loan-based instrument for financial assistance. This proposal is aimed at helping Member States protect employment in specific economic crises. This instrument must primarily support workers and jobs. The legislative process could delay implementation, but European Union underlines the necessity to realize this protection immediately. These instruments do not pre-judge the policies on future proposals related to unemployment actions. This strategy aims to support Member States' efforts to return to normal economic life and to promote a new agreement to secure sustainable growth. In this context, the Stimulus Fund is another strategic measure to support the start-up of a new economy, consistent with European priorities by: solidarity between Member States. At this point, all Member States that do not share this approach and the Recovery Fund should be a bottleneck to the European Commission’s results. Legal and practical aspects of the funds, generating considerable political friction in a minority of Member States. The stimulus package will be central to the economic recovery. It will have a strategic impact on the crisis, addressing and ensuring cohesion within the European Union supporting solidarity. Interestingly, without cohesion and solidarity, this road map will not be easy to achieve. Cohesion and solidarity, without responsibility are two outcomes with a low level of reliability. Roadmap and action plan to support Member States' economic reforms (Salman, 2020) to enhance resilience and competitiveness, in line with a sustainable growth strategy. The topic of sustainable growth is the condition of a new economic model, from linear to circular (Marino & Pariso 2020a) promoting economic convergence within and between European Member States. The European government has engaged in an effort in to defend and promote a new life style within Eurozone (Bonoli & Emmenegger, 2020). Total investment amounts to 750 billion euros, including 178 billion for Italy (Ansa, 2020). This is likely to be revised in the coming weeks (OECD, 2020).This amount, provided by short-term Europe, can create different scenarios within the Eurozone. Departing from the current economic situation of the Member States, which utilize the enormous resources made available by the European government, is possible to foresee four different scenarios for Europe related to: labor supply; risk of rewarding only some economic sectors; consumption demand; central government’s revenue. The paper is organized as follows: The second section provides a conceptual context for public value. Section 3 presents the methodology and Section 4 presents the findings and related discussions with reference to four scenarios related to European Member States. Finally, Section 5 presents the results of the study.
Literature Review
Values, Policy and Investments, provides both opportunities and challenges for the redesigning of European economic and service structures in terms of both production, health (Lynch, 2017) and information worldwide. Not surprisingly, many European countries are implementing reform policies (Bohle & Greskovits, 2012). These eyes are strictly linked to a new idea of Europe and one of the main goals is to ensure the creation of the continuous social and public value (Pavolini & Natili, 2020). In fact, in this emergency phase, related to Covid 19, it is strategic to ensure and activate policies (Ehrlich & Overman, 2020) related to need to distribute the wealth, because it could allow maintaining and adding to the creation of public and social value as in the case of European public policy and investments (Clasen, 2007). The research, in this study, starting from the emergency phase related to Covid-19 (Farzad et al., 2020) focuses on different four scenarios related to policy and investment by the European Government (Fathalikhani et al., 2020) associated with diffusion and adoption in Eurozone Member States. How these two factors affect Member States governments and to create value in the public sector are open question. These actions are strictly linked to how Member State governments operate at the micro and macro level using the opportunities and challenges of reform policies. In addition, reform policies (Hassenteufel & Palier, 2016) may create a bottleneck in the government’s change policies. Bureaucratic approach (Isett et al., 2006), that does not improve opportunities and challenges proposed by the European Commission or both, create social and public value (Bridgen & Meyer, 2018). Since the complexity of reform policies, is possible to note an increase expectation for transparency of the citizen part (Seeleib-Kaiser, 2018), especially during an emergency phase. Governments urgently demand innovation. Recent studies have highlighted the original character of the innovation (Bloom et al., 2019) in terms of both policy and investments during an emergency phase. On this track, the pillars are both, public and social value (Jing et al., 2019), particularly, how a Eurozone Member State (Guillen & Palier, 2004). Realize both public and social value(s) (PSV). It is interesting to note that these studies are in line with other conceptual investigations in which it appeared that the creation of PSV requires work of alignment, coordination and co-creation. Creating PSPs is about changing (Macaulay et al., 2006) the agendas of government departments. These changes have been implemented in many Member States (Kahanec et al., 2020) related to another and different emergency phase, i.e. immigration, and have produced interesting PSVs. These amendments concern communication, coordination and integration of services within the framework of new reform policies (Degryse et al., 2013). These actions and decisions underscore the need to negotiate procedures and restructure the budget and departmental employees. A recent study argues that these policies are functional for generating positive PSV. Governments operate within a constantly evolving environment. These conceptualizations of the PSV suggest that government can enhance collective and individual reform (FranKovic et al., 2020; Rhodes, 1996). In this sense, and in this phase of urgency, the exit of a government aims to improve the PSV as a collective objective. The value of the VSP means that the public interest (Ng, 2020) and the common good should be the primary concern of the public sector. Interestingly, this approach considers Member States as effective stakeholders in the PVS creation process. The Member States, (O'Connor, 2014) as stakeholders, can determinate a higher level of democracy (Klijn et al., 2007) and legitimate the Eurozone, by tying the two different processes of democracy: bottom up and top down (Kjhg Fink & Brady, 2020). In this perspective, reform policies, is an interesting model (Kvist, 2013) that could create the PSV as a best practice to replicate along the lines described in the introduction section. The PSVs are the strategic drivers for the enhancement of value. They are fundamental tools in the process optimization to increase the stakeholders’ engagement by including also the citizens in network governance (Osborne, 2006) logic. In fact, the governments might have to manage information, as in Covid 19 phase and gain legitimization in an instructional logic with stakeholders (Kawamorita et al., 2020; Salamzadeh & Dana, 2020). In this context, reforms may offer new ideas and business models to alter the linearity of the circular economy (Marino & Pariso, 2020b). There are interesting contributions that consider reform policies as enabling factors (Rhodes, 1996) create PSV. For example, reform policies can contribute by improving efficiency and bringing innovation (Federico et al., 2020) into government, enhancing relations between governments and citizens, and building departmental confidence, support and legitimacy. Following this research stream, PSVs are an enabling factor to empower citizens and support inclusive practices, especially for the differently able at the local government level. Furthermore, recent studies highlight the potential of reforms in the emergency phase, creating PSV, by enhancing Member States relations for the assessment of and intra-governmental projects, which produce added PVs. Recent studies, point out that each public, government, in the emergency phase, should promote more interactive and active contributions to policymaking through timely sharing of information and communication online, real-time discussions on social media as well as, through the old mass media such as TV and radio. As a result of this process, reform policies would contribute to the creation of the PSV by improving government action in terms of democracy and transparency of results (Ferrera, 2020). All these positive elements are weak because of the level of cohesion of the Member States within the euro area. On the one hand, the issue of the assessment of the reform policies in terms of quality and not only of economic utility has become strategic over the last few times. In addition, governments need to ensure transparency and encourage stakeholder engagement. Over the last period, from February to June 2020, PVP was also considered a strategic asset in response to the COVID-19 health emergency. Economic factors, such as production and businesses, in countries affected by COVID-19 are one of the major problems that emerged during the spread of this pandemic. On the one hand, countries try to avoid a total bloc of their productive sectors, and on the other hand, they have adopted policies of social distancing to avoid the spread of contagion. In fact, the countries worldwide are strongly promoting the hashtag #stayathome#. In this context, in order to create an effective balance between these two elements the countries are turning to a massive use of the reform tools, and in particular offering a new lifestyle related to safety contact and economic development. In this way, if necessary, this operating tool combines the need to create therapeutic isolation by enabling the work activities to be performed. The level of diffusion and adoption of ICTs (Marino & Pariso, 2020a) also represents the extent to which each country works towards the development, effectiveness and efficiency of human and economic progress. The reform policies, and its development process involve the creation of culture, investments (Cantillon, 2011) in network building by including both in the public and private field several sectors (i.e. education, health, efficiencies) at different levels (e.g., service provision, production process). In this context, it is fundamental for the countries be able to implement the processes of diffusing and integrating PSVs within their societies to translate the benefits (Hipp, 2020) of reform values into economic development. When there is divergence related to opportunities within a euro area, we are confronted with the phenomenon of the euro break-up. Despite this phenomenon, in the emergency phase, has had a tendency to contract, it is still a critical issue for many European countries. The PSV is in close correlation with different scenarios policies, in fact the chance to efficiently access to this tool represents on the one hand the countries' ability to provide innovative policies through adequate both, material and immaterial outcomes, and, on the other, to guarantee all stakeholders, full access to the opportunities offered by PSVs tools. The latter entails safeguarding the safety of a population in emergencies such as the Covid-19. Europe, during the final months of 2020, was one of the countries most affected by the coronavirus. On the hand, the countries have implemented social distancing as a restrictive measure, and on the other, public and private stakeholders are turning to the massive use of the different lifestyle. Europe shows a different degree of PSV in its zone with major differences among countries. This question represents a major bottleneck in order to avoid a strong slowdown in Europe’s production activities. This study assesses reform policy diffusion and adoption across European Member States and elaborates four scenarios in order to evaluate the different degree of PSV present in Member States. In an emergency context as declared by the European Government during the last months, with the outbreak of the Covid-19, this analysis can help to understand how this issue represents a slowdown for the stakeholder activities and therefore an economic bottleneck in the country. This analysis will be of interest to government researchers, decision-makers and planners for the development of national strategies.
Methodology
Starting from European Banking Authority, (EBA) dataset, with particular attention to Macroeconomic and Market scenarios dataset (2020), this paper applies and elaborated the data sources by “Macroeconomic scenario” and “Market risk shock”. The analysis, on the base of this database, extrapolates an Input/ Output matrix for each European Countries, which allows us to differentiate the sectors per country of production in a Eurozone framework. Each sector in each country has a KLEM standard: inputs of capital (K) and labor (L) as well as the intermediate or production chains of inputs in energy (E) and material inputs (M). Such factors are present both in one country and between countries. Using the list of European countries, Table 1, KLEM was included in the model and calculated for the following sectors: Energy; Information and communication technologies (ICT); Bio agriculture; Manufacturing; Non-manufacturing; Services. Several key features of the European Banking Authority related to Macroeconomic and Market have been considered in order to calculate the scenarios and are interesting to highlight here: First, the model, according to EBA, completely accounts for stocks and flows of physical and financial assets, i.e., budget deficits, public debt, current account deficits and external debt. The model imposes a time-bound budget on all Member States, households, businesses and governments. Therefore, a long-run equilibrium obtains through the adjustment of asset prices, the interest rate of debts, fiscal evasion, positions or real exchange rates for the proportion of payments; second, the policy of the government of the Member States, following the European reform policies, sets short-term macroeconomic performance (Moffett et al., 2008). This may limit long-term inflation rates in each country and allow for short-term policy adjustment to mitigate fluctuations in the real economy. Member States where the percentage of non-contract workers is high are disadvantaged. Companies hire workers in each sector insofar as the marginal product of labour is equal to the real wage defined in relation to the level of producer prices in this sector. Workers with contracts, but in redundancy benefit from unemployment benefits (Esping-Andersen & Schmitt, 2020). Excessive demand for labor causes nominal wages to adjust to market prices in the long - term. In the short term, unemployment (Van Oorschot & Chung, 2015) faces structural supply shocks with associated changes in aggregate demand; fourth, the reforms promoted in the euro area tend to remove rigidities in order to move the Member States' economies into a comfort zone. The rigidities created in the January - May 2020 phase. The elderly and people with limited mobility in particular that will be affected. The responsiveness of Member States in implementing reforms and overcoming the rigidity of the last period is important in assessing the impact of change and economic growth over the next two years. Following these assumptions and using the EBA database, four different scenarios can be established: labour supply shock; risk of rewarding only certain economic sectors; consumer demand; government spending. The EBA database, - Macro and market data, was developed with the Statistical Package for Social Sciences 26.0 (SPSS). The data processing was developed using a forecasting software package (SPSS) which allows complete forecasts and analyses of historical series with multiple models for the estimation of curves, Grading models and methods for estimating regression functions.
Results
Shock to Labour Supply
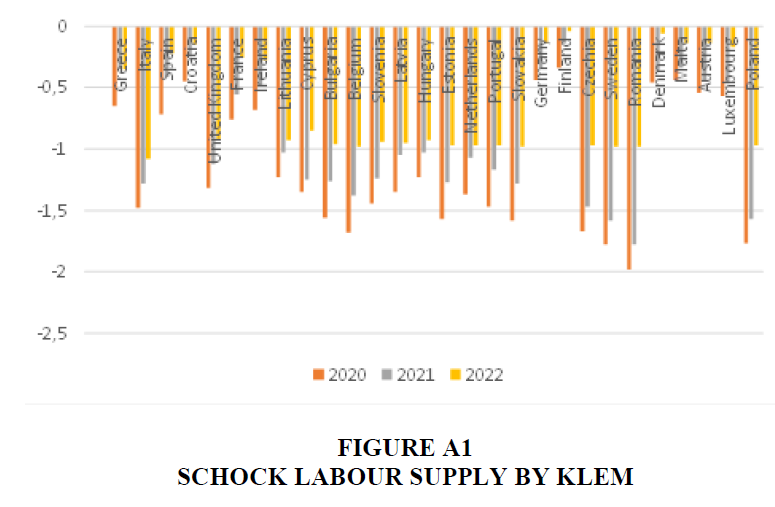
Table 2 shows a negative trend for all euro area Member States over a 3-year period.
| Table 2 Shock to Labor Supply by KLEM | |||
| Countries | 2020 | 2021 | 2022 |
| Greece | -0.65 | -0.35 | -0.35 |
| Italy | -1.48 | -1.28 | -1.08 |
| Spain | -0.72 | -0.42 | -0.22 |
| Croatia | -0.45 | -0.25 | -0.15 |
| United Kingdom | -1.32 | -1.12 | -0.92 |
| France | -0.76 | -0.56 | -0.26 |
| Ireland | -0.68 | -0.48 | -0.28 |
| Lithuania | -1.23 | -1.03 | -0.93 |
| Cyprus | -1.35 | -1.25 | -0.85 |
| Bulgaria | -1.56 | -1.26 | -0.96 |
| Belgium | -1.68 | -1.38 | -0.98 |
| Slovenia | -1.44 | -1.24 | -0.94 |
| Latvia | -1.35 | -1.05 | -0.95 |
| Hungary | -1.23 | -1.03 | -0.93 |
| Estonia | -1.57 | -1.27 | -0.97 |
| Netherlands | -1.37 | -1.07 | -0.97 |
| Portugal | -1.47 | -1.17 | -0.97 |
| Slovakia | -1.58 | -1.28 | -0.98 |
| Germany | -0.44 | -0.34 | -0.14 |
| Finland | -0.34 | -0.14 | -0.04 |
| Czechia | -1.67 | -1.47 | -0.97 |
| Sweden | -1.78 | -1.58 | -0.98 |
| Romania | -1.98 | -1.78 | -0.98 |
| Denmark | -0.46 | -0.36 | -0.06 |
| Malta | -0.44 | -0.34 | -0.14 |
| Austria | -0.54 | -0.44 | -0.14 |
| Luxembourg | -0.57 | -0.47 | -0.17 |
| Poland | -1.77 | -1.57 | -0.97 |
The negative values of 2020, based on the 2019 data, take into account the macroeconomic situation of each country before the pandemic, and the flows that in the period January - May 2020, were generated by of the closure of production activities and the lockdown of families and single people. In this lockdown period, inputs of capital (K) and labor (L) as well as the intermediate or production chains of inputs in energy (E) and material inputs (M), have suffered a powerful economic shock. The macroeconomic and market reforms put in place by EU reform policies could have an impact in the eurozone in the coming months and take shape in 2021. During this year, there is a change trend in the Eurozone, but the negative performance value is still high and evident. It is only in 2022 that some Member States, while maintaining negative values, report a reversal trend and the first positive effect of European governmental reforms.
The risk of rewarding only certain sectors of the economy: energy; information and communication technologies (ICT); agriculture; manufacturing; non-manufacturing; services.
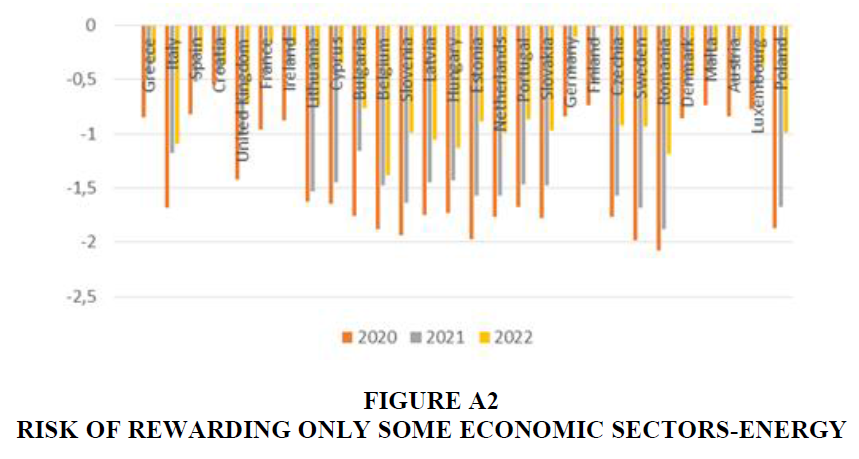
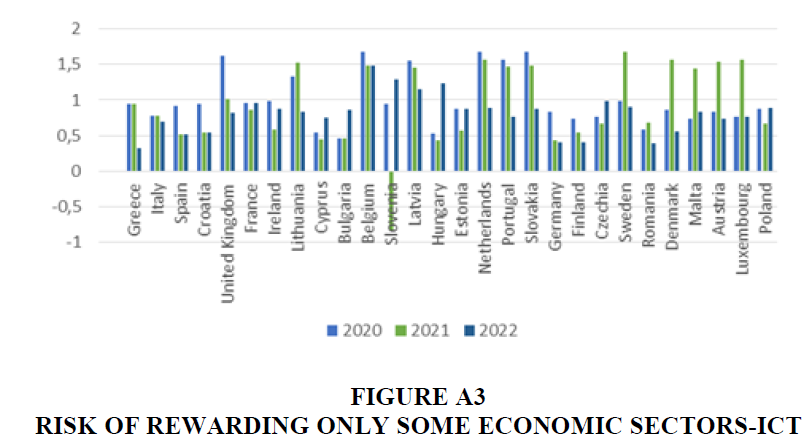
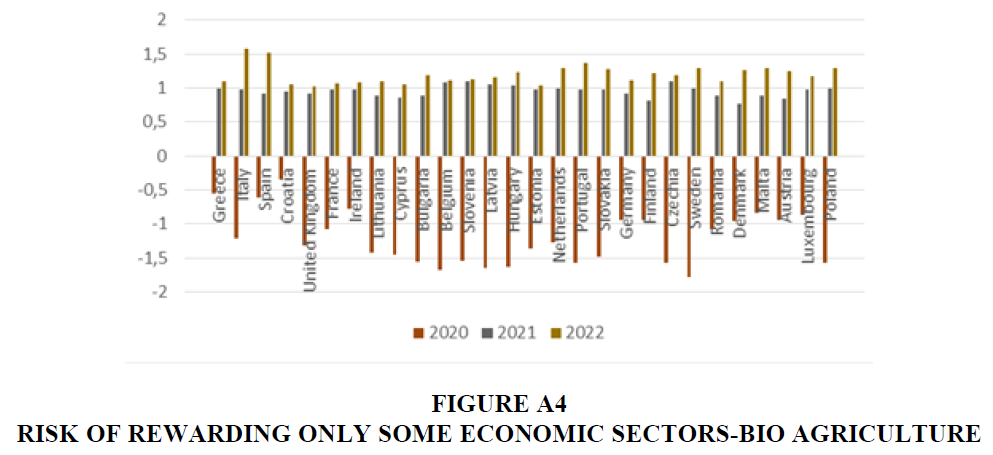
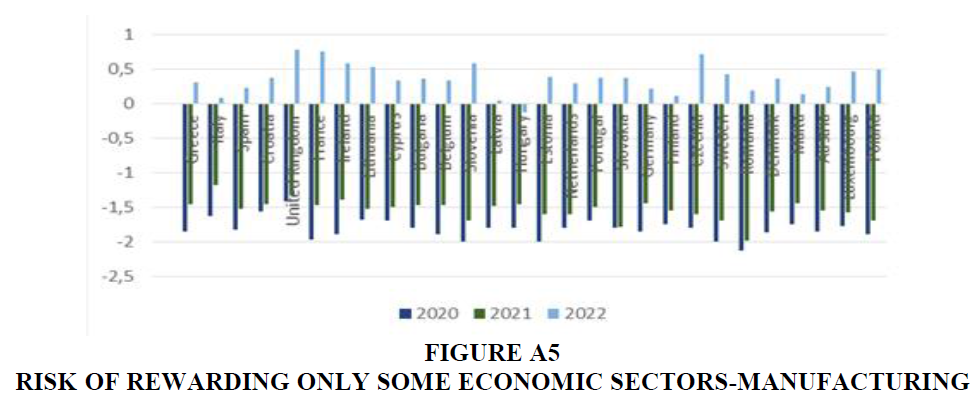
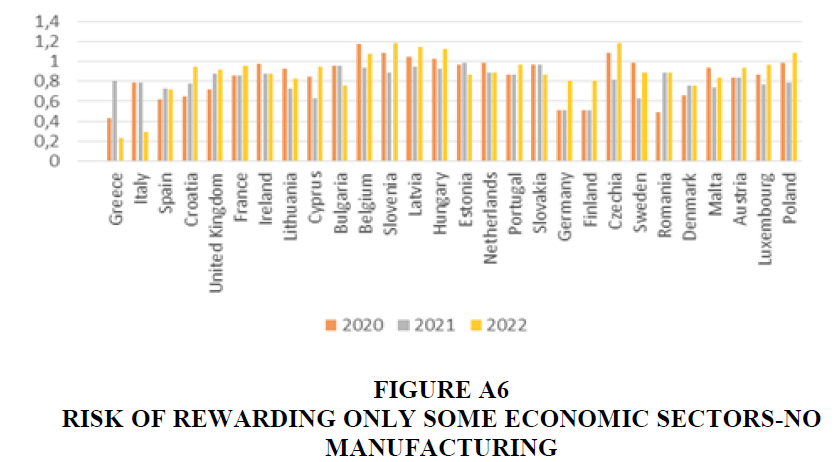
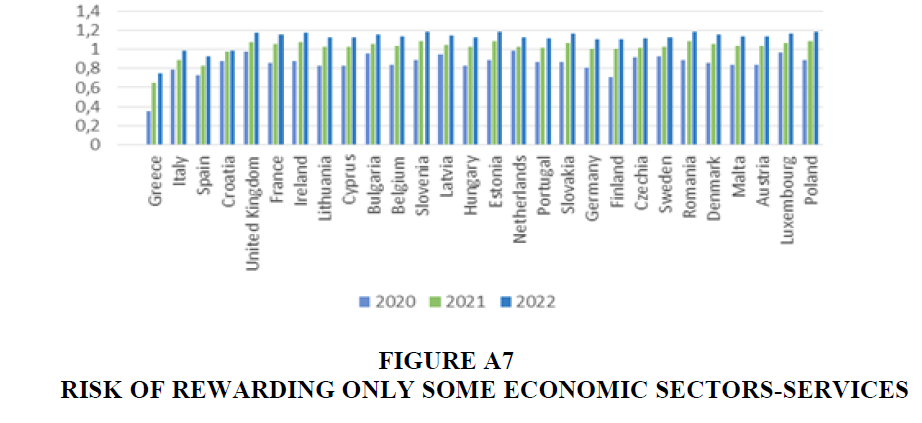
Table 3 shows a negative trend, not in all relevant economic sectors, over the estimated three years for the euro area Member States. Figures 2A to 7A in the Appendix provide trends for each sector.
| Table 3 Risk of Rewarding only some Economic Sectors | ||||||||||||||||||
| Energy | ICT | Bio Agriculture | Manufacturing | No Manufacturing | Services | |||||||||||||
| 2020 | 2021 | 2022 | 2020 | 2021 | 2022 | 2020 | 2021 | 2022 | 2020 | 2021 | 2022 | 2020 | 2021 | 2022 | 2020 | 2021 | 2022 | |
| Greece | -0.85 | -0.45 | -0.33 | 0.95 | 0.95 | 0.33 | -0.55 | 0.99 | 1.09 | -1.85 | -1.45 | 0.31 | 0.43 | 0.81 | 0.23 | 0.35 | 0.65 | 0.75 |
| Italy | -1.68 | -1.18 | -1.09 | 0.78 | 0.78 | 0.69 | -1.21 | 0.98 | 1.58 | -1.62 | -1.17 | 0.09 | 0.79 | 0.79 | 0.29 | 0.79 | 0.89 | 0.99 |
| Spain | -0.82 | -0.52 | -0.25 | 0.92 | 0.52 | 0.52 | -0.62 | 0.92 | 1.52 | -1.82 | -1.52 | 0.23 | 0.62 | 0.73 | 0.72 | 0.73 | 0.83 | 0.93 |
| Croatia | -0.55 | -0.45 | -0.35 | 0.95 | 0.55 | 0.55 | -0.35 | 0.95 | 1.05 | -1.55 | -1.45 | 0.38 | 0.65 | 0.78 | 0.95 | 0.88 | 0.98 | 0.99 |
| United Kingdom |
-1.42 | -1.02 | -0.72 | 1.62 | 1.02 | 0.82 | -1.32 | 0.92 | 1.02 | -1.41 | -1.32 | 0.78 | 0.72 | 0.88 | 0.92 | 0.98 | 1.08 | 1.18 |
| France | -0.96 | -0.46 | -0.16 | 0.96 | 0.86 | 0.96 | -1.08 | 0.97 | 1.07 | -1.96 | -1.46 | 0.76 | 0.86 | 0.86 | 0.96 | 0.86 | 1.06 | 1.16 |
| Ireland | -0.88 | -0.38 | -0.18 | 0.98 | 0.58 | 0.88 | -0.78 | 0.98 | 1.08 | -1.88 | -1.38 | 0.58 | 0.98 | 0.88 | 0.88 | 0.88 | 1.08 | 1.18 |
| Lithuania | -1.63 | -1.53 | -0.73 | 1.33 | 1.53 | 0.83 | -1.43 | 0.89 | 1.09 | -1.68 | -1.52 | 0.53 | 0.93 | 0.73 | 0.83 | 0.83 | 1.03 | 1.13 |
| Cyprus | -1.65 | -1.45 | -0.35 | 0.55 | 0.45 | 0.75 | -1.45 | 0.85 | 1.05 | -1.69 | -1.49 | 0.33 | 0.85 | 0.63 | 0.95 | 0.83 | 1.03 | 1.13 |
| Bulgaria | -1.76 | -1.16 | -0.76 | 0.46 | 0.46 | 0.86 | -1.56 | 0.89 | 1.19 | -1.79 | -1.46 | 0.36 | 0.96 | 0.96 | 0.76 | 0.96 | 1.06 | 1.16 |
| Belgium | -1.88 | -1.48 | -1.38 | 1.68 | 1.48 | 1.48 | -1.68 | 1.08 | 1.11 | -1.89 | -1.47 | 0.34 | 1.18 | 0.94 | 1.08 | 0.84 | 1.04 | 1.14 |
| Slovenia | -1.94 | -1.64 | -0.99 | 0.94 | -0.84 | 1.29 | -1.54 | 1.09 | 1.12 | -1.99 | -1.69 | 0.59 | 1.09 | 0.89 | 1.19 | 0.89 | 1.09 | 1.19 |
| Latvia | -1.75 | -1.45 | -1.05 | 1.55 | 1.45 | 1.15 | -1.65 | 1.05 | 1.15 | -1.79 | -1.48 | 0.05 | 1.05 | 0.95 | 1.15 | 0.95 | 1.05 | 1.15 |
| Hungary | -1.73 | -1.43 | -1.13 | 0.53 | 0.43 | 1.23 | -1.63 | 1.03 | 1.23 | -1.79 | -1.45 | -0.13 | 1.03 | 0.93 | 1.13 | 0.83 | 1.03 | 1.13 |
| Estonia | -1.97 | -1.57 | -0.89 | 0.87 | 0.57 | 0.87 | -1.37 | 0.97 | 1.03 | -1.99 | -1.59 | 0.39 | 0.97 | 0.99 | 0.87 | 0.89 | 1.09 | 1.19 |
| Netherlands | -1.77 | -1.57 | -0.99 | 1.67 | 1.57 | 0.89 | -1.27 | 0.99 | 1.29 | -1.79 | -1.59 | 0.29 | 0.99 | 0.89 | 0.89 | 0.99 | 1.03 | 1.13 |
| Portugal | -1.67 | -1.47 | -0.87 | 1.57 | 1.47 | 0.77 | -1.57 | 0.97 | 1.37 | -1.69 | -1.49 | 0.37 | 0.87 | 0.87 | 0.97 | 0.87 | 1.02 | 1.12 |
| Slovakia | -1.78 | -1.48 | -0.97 | 1.68 | 1.48 | 0.87 | -1.48 | 0.97 | 1.27 | -1.79 | -1.78 | 0.37 | 0.97 | 0.97 | 0.87 | 0.87 | 1.07 | 1.17 |
| Germany | -0.84 | -0.44 | -0.11 | 0.84 | 0.44 | 0.41 | -0.94 | 0.91 | 1.11 | -1.84 | -1.44 | 0.21 | 0.51 | 0.51 | 0.81 | 0.81 | 1.01 | 1.11 |
| Finland | -0.74 | -0.54 | -0.01 | 0.74 | 0.54 | 0.41 | -0.94 | 0.81 | 1.21 | -1.74 | -1.54 | 0.11 | 0.51 | 0.51 | 0.81 | 0.71 | 1.01 | 1.11 |
| Czechia | -1.77 | -1.57 | -0.92 | 0.77 | 0.67 | 0.99 | -1.57 | 1.09 | 1.19 | -1.79 | -1.59 | 0.72 | 1.09 | 0.82 | 1.19 | 0.92 | 1.02 | 1.12 |
| Sweden | -1.98 | -1.68 | -0.93 | 0.98 | 1.68 | 0.91 | -1.78 | 0.99 | 1.29 | -1.99 | -1.69 | 0.43 | 0.99 | 0.63 | 0.89 | 0.93 | 1.03 | 1.13 |
| Romania | -2.08 | -1.88 | -1.19 | 0.58 | 0.68 | 0.39 | -1.08 | 0.89 | 1.09 | -2.12 | -1.98 | 0.19 | 0.49 | 0.89 | 0.89 | 0.89 | 1.09 | 1.19 |
| Denmark | -0.86 | -0.56 | -0.46 | 0.86 | 1.56 | 0.56 | -0.96 | 0.76 | 1.26 | -1.86 | -1.56 | 0.36 | 0.66 | 0.76 | 0.76 | 0.86 | 1.06 | 1.16 |
| Malta | -0.74 | -0.44 | -0.24 | 0.74 | 1.44 | 0.84 | -0.84 | 0.89 | 1.29 | -1.74 | -1.44 | 0.14 | 0.94 | 0.74 | 0.84 | 0.84 | 1.04 | 1.14 |
| Austria | -0.84 | -0.54 | -0.14 | 0.84 | 1.54 | 0.74 | -0.94 | 0.84 | 1.24 | -1.84 | -1.54 | 0.24 | 0.84 | 0.84 | 0.94 | 0.84 | 1.04 | 1.14 |
| Luxembourg | -0.77 | -0.57 | -0.37 | 0.77 | 1.57 | 0.77 | -0.87 | 0.97 | 1.17 | -1.77 | -1.57 | 0.47 | 0.87 | 0.77 | 0.97 | 0.97 | 1.07 | 1.17 |
| Poland | -1.87 | -1.67 | -0.99 | 0.87 | 0.67 | 0.89 | -1.57 | 0.99 | 1.29 | -1.89 | -1.69 | 0.49 | 0.99 | 0.79 | 1.09 | 0.89 | 1.09 | 1.19 |
The negative values for 2020, based on 2019 data, relate to: the energy sector (EU Classification, 2020a) over three years, manufacturing industry (EU Classification, 2020d) in 2020 and 2021, and bioagriculture (EU Classification, 2020c) in 2020. Evolution of the manufacturing trend in 2022 with positive values, display minimum values of Latvia (0.05) and Italy (0.09) and peak values of France from -1.46 (2021) to 0.76. (2022). In Organic Agriculture, the trend changes in 2021 in all Member States with an increase in values between 2020 - 2021 and 2022. In others three economic sectors: ICT (EU Classification, 2020b), No Manufacturing (EU Classification, 2020e) and Services (EU Classification, 2020f), there are positive trends starting in 2020 and growing values are displayed in 2021 and 2022. It is interesting to note that the means of getting out of the crisis in the next three years provide for different paths in terms of economic sectors and Member States. In addition, the weight of sectors within each Member State has an impact on the economic development in terms of both, time and economic impact for each Country within the Eurozone. The sector most exposed in terms of K, inputs (capital and materials) and labour costs L is energy, followed by manufacturing as presented in Charts 2 and 5.
Shock to Consumer Demand
Table 4 highlights the shock to consumer demand, in assessed time, three years, for Eurozone Member States.
| Table 4 Shock to Consumption Demand | ||||||
| Country | Household | Public Administration | ||||
| 2020 | 2021 | 2022 | 2020 | 2021 | 2022 | |
| Greece | -0.95 | -0.95 | 0.05 | -0.99 | -0.89 | 0.09 |
| Italy | -0.99 | -0.99 | 0.09 | -0.98 | -0.98 | 0.09 |
| Spain | -0.93 | -0.93 | 0.03 | -0.97 | -0.87 | 0.08 |
| Croatia | -0.98 | -0.98 | 0.09 | -0.99 | -0.89 | 0.11 |
| United Kingdom | -0.98 | 0.08 | 0.18 | -0.99 | -0.89 | 0.15 |
| France | -0.96 | 0.06 | 0.16 | -0.98 | -0.88 | 0.14 |
| Ireland | -0.98 | 0.08 | 0.18 | -0.99 | -0.79 | 0.13 |
| Lithuania | -0.93 | 0.03 | 0.13 | -0.99 | -0.79 | 0.11 |
| Cyprus | -0.93 | -0.93 | 0.03 | -0.99 | -0.79 | 0.13 |
| Bulgaria | -0.96 | -0.96 | 0.06 | -0.99 | -0.69 | 0.16 |
| Belgium | -0.94 | 0.04 | 0.14 | -0.98 | -0.58 | 0.12 |
| Slovenia | -0.99 | -0.99 | 0.09 | -0.97 | -0.98 | 0.19 |
| Latvia | -0.95 | 0.05 | 0.15 | -0.99 | -0.91 | 0.16 |
| Hungary | -0.93 | -0.93 | 0.03 | -0.99 | -0.69 | 0.13 |
| Estonia | -0.99 | -0.99 | 0.19 | -0.97 | -0.67 | 0.13 |
| Netherlands | -0.99 | -0.93 | 0.13 | -0.99 | -0.59 | 0.11 |
| Portugal | -0.97 | -0.92 | 0.12 | -0.99 | -0.59 | 0.11 |
| Slovakia | -0.97 | -0.97 | 0.17 | -0.99 | -0.79 | 0.12 |
| Germany | -0.91 | 0.07 | 0.19 | -0.99 | -0.79 | 0.11 |
| Finland | -0.91 | -0.81 | 0.11 | -0.99 | -0.79 | 0.14 |
| Czechia | -0.99 | -0.99 | 0.02 | -0.99 | -0.59 | 0.12 |
| Sweden | -0.93 | -0.93 | 0.13 | -0.99 | -0.59 | 0.14 |
| Romania | -0.99 | -1.09 | -0.19 | -0.99 | -0.99 | -0.18 |
| Denmark | -0.96 | -0.96 | 0.16 | -0.98 | -0.58 | 0.18 |
| Malta | -0.94 | -0.94 | 0.14 | -0.99 | -0.59 | 0.16 |
| Austria | -0.94 | -0.94 | 0.14 | -0.98 | -0.58 | 0.18 |
| Luxembourg | -0.97 | -0.97 | 0.17 | -0.98 | -0.58 | 0.18 |
| Poland | -0.99 | -1.09 | -0.19 | -0.99 | -0.99 | -0.11 |
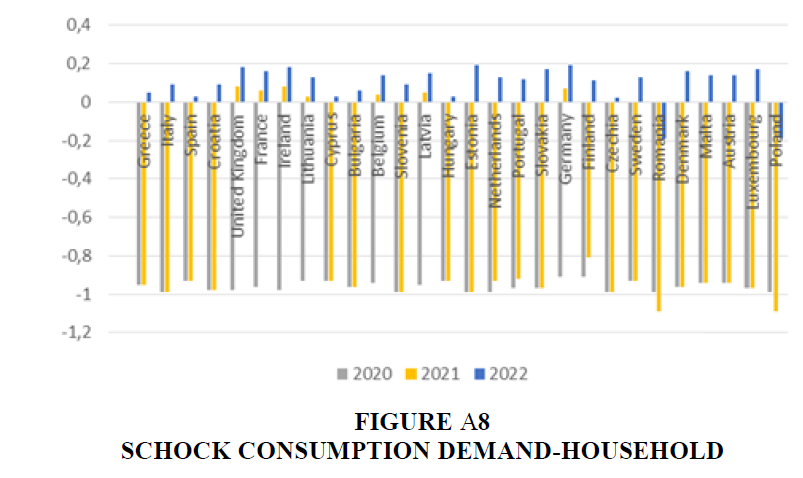
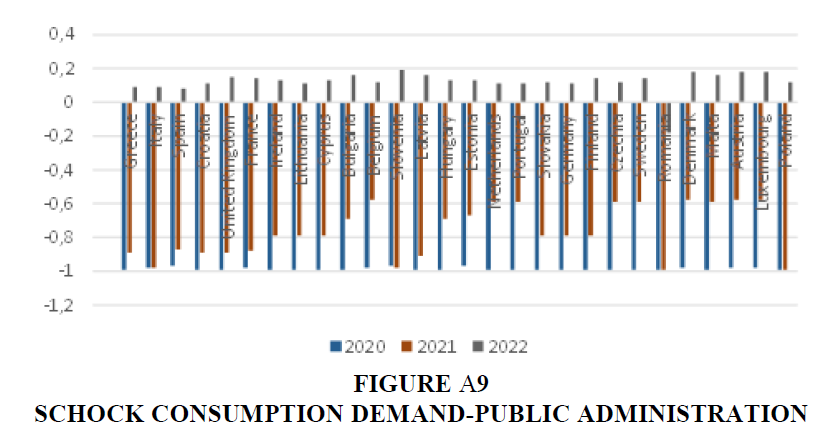
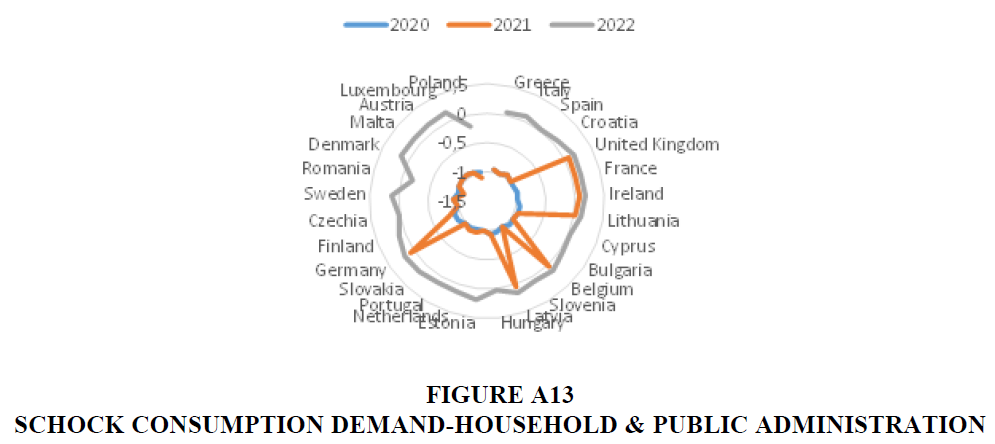
The variables common to each Member State, regarded as valid for comparison purposes, are household consumption and government. While the demand for consumption in the economy is an important macroeconomic variable also linked to other quantities, it was not possible to compare the demand values of enterprises, consequently, household and government data were evaluated over the three years under consideration. The Appendix, Figure 8A displays the trend of consumption demand household in each Member State. The household consumption demand displays a negative trend in each Member States, is possible to assess a positive trend in 2022 for 25/28 member States: unfortunately, this positive trend is between 0 and 0.2 and no adequate to support the economic development in the Eurozone. Table 4 and Figure 9A (Appendix) of government consumer demand show the following trend: all Member States in 2020 show a negative trend, with a variation in 2022. During this year, the wide range is between 0.8 and 0.18. It is also interesting to note that starting from a negative trend of all Member States in 2020; it will not be possible to modify it until 2022. In 2022, as shown in the table, only 4 Member States reach maximum value of 0.18. In 2022, Poland and Romania maintain a declining trend.
Shock to Central Government’s Revenue
Table 5 highlights the three-year revenue shock for the euro-zone Member States
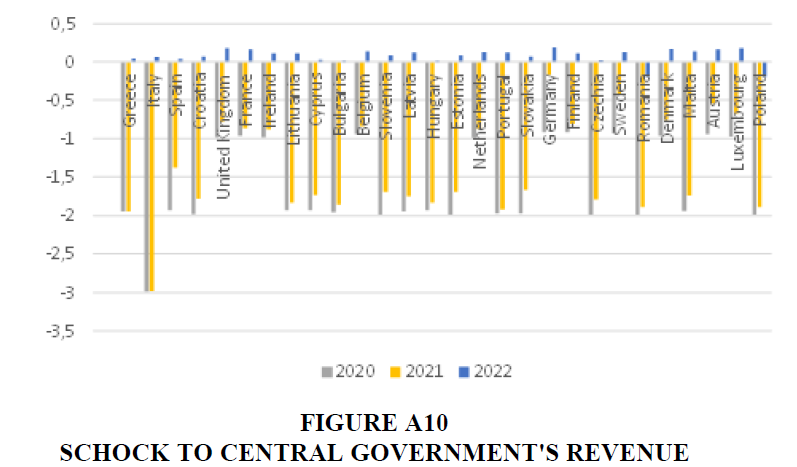
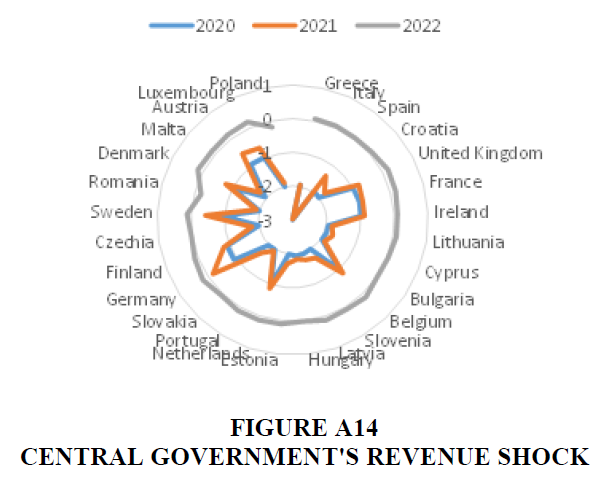
The trend in Table 5 is not so different from the previous ones: in this case too, a negative trend can be observed in 2020 with an intensive change process in 2021 only in certain Member States. The Figure 10A (Appendix) shown that in 22/28 Member States in 2021 is possible to realize a positive trend, but, growth is between 0,1 and 0,3 a low rate to sustain the shocks and risks affecting the Eurozone. From the analysis of the results emerges that the influence of social capital represents a strategic variable for entrepreneurs to overcome the Covid 19 crisis. The social capital should be supported by social innovation in terms of technologies and educational projects. In this context, the coronavirus (COVID-19) pandemic is a challenge among European entrepreneurs.
| Table 5 Shock to Central Government's Revenue | |||
| 2020 | 2021 | 2022 | |
| Greece | -1.95 | -1.95 | 0.05 |
| Italy | -2.99 | -2.98 | 0.06 |
| Spain | -1.93 | -1.38 | 0.04 |
| Croatia | -1.98 | -1.78 | 0.07 |
| United Kingdom | -0.98 | -0.78 | 0.18 |
| France | -0.96 | -0.86 | 0.16 |
| Ireland | -0.98 | -0.88 | 0.11 |
| Lithuania | -1.93 | -1.83 | 0.11 |
| Cyprus | -1.93 | -1.73 | 0.03 |
| Bulgaria | -1.96 | -1.86 | 0.01 |
| Belgium | -0.94 | -0.84 | 0.14 |
| Slovenia | -1.99 | -1.69 | 0.09 |
| Latvia | -1.95 | -1.75 | 0.12 |
| Hungary | -1.93 | -1.83 | 0.01 |
| Estonia | -1.99 | -1.69 | 0.09 |
| Netherlands | -0.99 | -0.87 | 0.13 |
| Portugal | -1.97 | -1.92 | 0.12 |
| Slovakia | -1.97 | -1.67 | 0.07 |
| Germany | -0.91 | -0.17 | 0.19 |
| Finland | -0.91 | -0.81 | 0.11 |
| Czechia | -1.99 | -1.79 | 0.02 |
| Sweden | -0.93 | -0.43 | 0.13 |
| Romania | -1.99 | -1.89 | -0.19 |
| Denmark | -0.96 | -0.76 | 0.17 |
| Malta | -1.94 | -1.74 | 0.14 |
| Austria | -0.94 | -0.54 | 0.16 |
| Luxembourg | -0.97 | -0.67 | 0.18 |
| Poland | -1.99 | -1.89 | -0.19 |
Discussion
The non-use of capital and labour (Table 2), their descent in recent weeks is not reassuring and does not reflect the action of monetary policy and European initiatives to support output, labour, investment. The difference between southern and northern Member States is almost double. Even for the incoming countries, the difference stems from values, which find no justification in the foundations of a Europe based on the creation of social value and solidarity. Carriers on which the European Commission declares its intention to develop the economy. It should be noted that KLEM must be consolidated if the European government wants to build a eurozone based on the principles of social values and solidarity that give responses in this phase to the pandemic challenges. Moreover, the sharp deregulation of the labour, capital, raw materials and energy (KLEM) markets in recent years has not facilitated the meeting of supply and demand in a period of acute social and economic crisis. Moreover, many production activities focus on these sectors, such as the health sector, where European public funds should not be reported and are not linked to performance. Analysis of economic sectors, Table 3 and Figures 3A-7A (Appendix) shows that some of them, energy and manufacturing, point to delays and difficulties. In recent months, they have therefore not resisted, not permitting the production of hundreds of thousands of workers. In the crisis months, the manufacturing and energy sectors rapidly lost their competitiveness, which led to a new deficit in the balance of payments, real and financial wealth of families, which increased corporate debt. Furthermore, there are investments that cannot be ignored, particularly those aimed at innovation in production activities and the improvement of the environment, investments that are increasingly integrated. In this course, the trend of the two, ICT and Service, displays interesting performances. A favorable environment requires resolute, rapid and far-reaching interventions to improve the quality of the environment and the dissemination and uptake of technological innovation. Inequalities (Gornick et al., 2020) are creating between the Member States, the Countries that reach first the positive sign in each considered sector, are likewise those with the highest growth values. Table 4, Figures 8A and 9A, family and public administration, shows negative trends in 2020, but in 2022 the Member States, characterized by their capacity for economic leadership, resumed a positive trend ahead of the other States, both in consumer spending and in the public sector. In particular, household consumption fluctuates between 2020 and 2022 between + 0.19 in Germany and Estonia and - 0.19 in Poland and Romania. The minimum positive values between +0.03 and +0.09 of Greece, Italy and Spain, although significant, given the initial shock of 2020, -0.99, are not useful growth values to support a revival of the economies of these Member States. Table 5 and Figure 10A show a positive trend in 2022 for all Member States, with the exception of Romania and Poland. In this case, the shock is also determined by the tax avoidance behavior which has been affecting some euro area member countries for some time. Greece, Italy, Portugal, Spain, but also Romania, Poland, Czechoslovakia, among others, show difficulties in terms of government revenue. In 2022, the year of stabilization of revenue, the trend highlights very different situations: from + 0.19 in Germany, to -0.19 in Romania and Poland, with minimum positive values of Greece, Italy, Spain that do not recover revenue such as to be capable to make a restart independently from the European government's aid. In these states, the burden of bureaucracy represents a bloc for the progress of reform in the delivery of funds, the control of revenues, the expenditures made. At the same time, the evaluation, risks and shocks taken into account, highlights, for each Member State, different scenarios of public and social value.
Scenarios
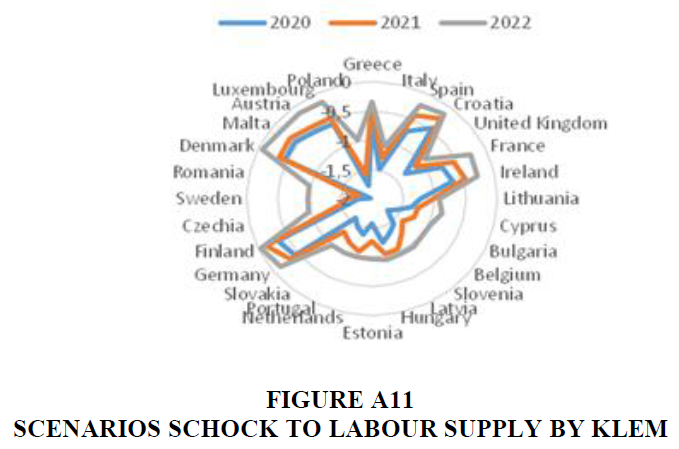
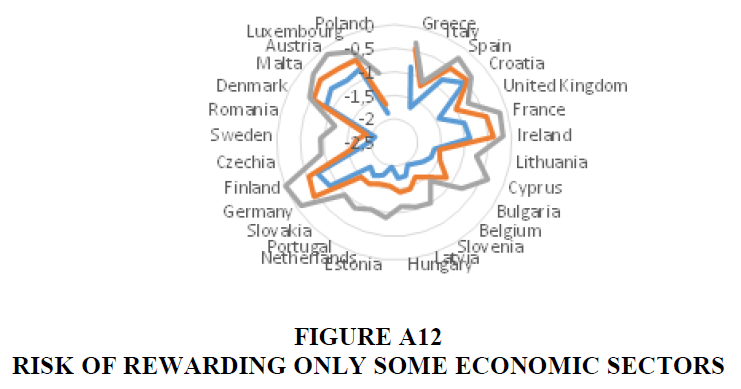
The assessment, both risks and shocks considered, reveals different scenarios for the Member States and thus a different capacity to identify and create economic and social value. The policies of change, display guidelines that unite individual states through shared economic and social results, but they do not make perceive a European union with a common policy of creation of social and economic value. In the case of scenario 1 (Figure 11A-Appendix), the labour supply shock per KLEM, the Member States reaching pre-andine utilization rates before the other are Germany, Finland, Denmark and Luxembourg. It is interesting to note that these Member States receive less money than the others in the European Community. Italy, i.e., that will receive more funds than others do not reach the previous rate in considering the period. In this Scenario there are Member States that share and achieve the same objectives by 2022, is the case of Germany and Finland, also as single State, another group is composed by Denmark, Malta, Austria and Luxemburg with the beginning and last as the two extremes of the scope. In the ring before this Spain and Croatia that France and Ireland make up two other groups that reach higher times in 2022 the utilization rates before the pandemic phase. For scenario 2 (Figure 12A - Appendix), risk of rewarding only certain economic sectors, the Member States reaching pre-pandemic utilization rates are Germany, Finland and Austria. In this scenario, Spain is also close to the last ring, hence the potential to achieve development rates prior to the pandemic phase. In addition, the same groups of Scenario 1, France and Ireland included reaching the outcomes as in prior to pandemic phase. In the case of scenario 3, (Figure 13A-Appendix) Latvia and Lithuania. It is interesting to note that also in this case also in scenario 2, Italy, Greece and many other countries are far from achieving the result. There are no group results for this scenario. In scenario 4, Figure 14A (Appendix) Central government revenue shock, as a profile of Member States, Germany, Sweden, Romania, Belgium, the Netherlands, as a group, Malta and Austria, France and Ireland. It is possible to note that there are not common scenarios for all Member State, but as indicate before, it is possible identify some trajectories involving only a few groups of Member States. The European Union, need a new relationship between the government, real economy, companies and finance, institutions, civil society; We cannot call it, as it is being suggested (von der Leyen, 2019), need for a new social contract, but also in this one perspective, it is necessary to carry out an orderly confrontation and create a constructive dialogue. A new relationship is essential in Europe as well. Each country must use the resources made available by the European institutions in a pragmatic, transparent and above all effective way. European funds can never be free: the European debt is the debt of each and all Member States, will always contribute significantly to the financing of initiatives, because they are the third largest economy in the world. Only a common action, strong and coordinated, it will be able to protect and help relaunch capacity of production and utilization throughout the European economic system.
Conclusion
The large fund allocated will not produce, until 2022cthe expected benefit. Member States that had both economic and social leadership prior to the pandemic, to achieve other levels of inputs, strategic economic sector development and revenues, in 2022. In most Member States, the pre-pandemic difficulties have become more acute and the establishment of new values in terms of PSV is quite difficult to realize in considering the period. In long run may possible, also if this is not an objective of the paper and may be a weakness of this work, but the reliability of the projection in a complex phase such as this cannot go further the three years. It is vital to rethink in depth the productive, economic and fiscal structure, which also takes into account a social protection system. Policies, reforms and behaviors that bring us back to growth rates before the pandemic, with sustained, broad-based and balanced support, would also help to maintain easing conditions on financial markets, the reduction of the average debt burden and the promotion of a gradual rebalancing of public finances. The uncertainty surrounding the return of the virus - COVID-19 - over the coming months raises the risk of loss of social value (de Souza Silva et al., 2020), work and taxation in the European Union. The weaker states, most of which constitute the Union, despite the impressive disbursement of investments, are not coping with the short-term crisis as our study shows. This lack of results can also weaken long-term social and economic policy decisions to construct Europe. The European macroeconomic scenario during the Covid19 pandemic is an open question, and therefore in conclusion the output of discussion linked to research results, suggest a stance whereby the transition must be seen as under constant development and re-interpretation.
Appendix
References
- Ansa. (2020). Italy and Spain major beneficiaries Recovery fund. Retrieved from https://www.ansa.it/sito/notizie/economia/2020/05/28/italia-e-spagna-maggiori-beneficiari-recovery- fund_1341c869-8e2e-4ee7-aedf-17d43873aed5.html
- Bloom, N., Van Reenen, J., & Williams, H. (2019). A toolkit of policies to promote innovation. Journal of Economic Perspectives, 33(3), 163-84.
- Bohle, D., & Greskovits, B. (2012). Capitalist diversity on Europe's periphery. Cornell University Press.
- Bonoli, G., & Emmenegger, P. (2020). The limits of decentralized cooperation: promoting inclusiveness in collective skill formation systems?. Journal of European Public Policy, 1-19
- Bridgen, P., & Meyer, T. (2018). Individualisation reversed: the cross-class politics of social regulation in the UK’s public/private pension mix. Transfer: European Review of Labour and Research, 24(1), 25-41.
- Cantillon, B. (2011). The paradox of the social investment state: growth, employment and poverty in the Lisbon era.
- Journal of European Social Policy, 21(5), 432-449.
- Caunhye, A.M., Nie, X., & Pokharel, S. (2012). Optimization models in emergency logistics: A literature review.
- Socio-Economic Planning Sciences, 46(1), 4-13.
- Chodorow-Reich, G., Coglianese, J., & Karabarbounis, L. (2019). The macro effects of unemployment benefit extensions: a measurement error approach. The Quarterly Journal of Economics, 134(1), 227-279.
- Clasen, J. (2007). Comparative social policy-old questions, new topics and original answers–by Jochen Clasen.
- Government and Opposition, 42(2), 250-257.
- de Souza Silva, T.A., Corrêa, V.S., Vale, G.M.V., & Giglio, E.M. (2020). Influence of social capital offline and online on early-stage entrepreneurs. Revista de Gestão, 27(4), 393-408.
- Degryse, C., Jepsen, M., & Pochet, P. (2013). The Euro crisis and its impact on national and European social policies.
- Ebbinghaus, B. (2015). The privatization and marketization of pensions in Europe: A double transformation facing the crisis. European Policy Analysis, 1(1), 56-73.
- Ehrlich, M.V., & Overman, H.G. (2020). Place-based policies and spatial disparities across European cities. Journal of Economic Perspectives, 34(3), 128-49.
- Esping-Andersen, G., & Schmitt, C. (2020a). Multi-dimensional couple bargaining and housework allocation. Acta Sociologica, 63(1), 3-22.
- EU Classification. (2020a). Economic sector: Energy classification. Retrieved from https://inspire.ec.europa.eu/codelist/EnergyClassificationValue
- EU Classification. (2020b). Economic sector: ICT classification. Retrieved from https://ec.europa.eu/eurostat/cache/metadata/en/isoc_se_esms.htm#cost_burden1585235476459
- EU Classification. (2020c). Economic sector: Bio Agriculture classification. Retrieved from https://www.organic-world.net/statistics/statistics-data-classifications.html
- EU Classification. (2020d). Economic sector: Manufacturing classification. Retrieved from https://ec.europa.eu/eurostat/statistics-explained/index.php/Manufacturing_statistics_-_NACE_Rev._2
- EU Classification. (2020e). Economic sector: No Manufacturing classification. Retrieved from https://ec.europa.eu/eurostat/documents/3859598/5902521/KS-RA-07-015-EN.PDF
- EU Classification. (2020f). Economic sector: Service classification. Retrieved from https://cices.eu/ European Banking Authority. (2020). Retrieved from https://eba.europa.eu/risk-analysis-and-data European Commission. (2020). Retrieved from https://ec.europa.eu/health/ern/covid-19_en
- Farzad, F.S., Salamzadeh, Y., Amran, A.B., & Hafezalkotob, A. (2020). Social innovation: Towards a better life after covid-19 crisis: What to concentrate on. Journal of Entrepreneurship, Business And Economics, 8(1), 89-120.
- Fathalikhani, S., Hafezalkotob, A., & Soltani, R. (2020). Government intervention on cooperation, competition, and coopetition of humanitarian supply chains. Socio-Economic Planning Sciences, 69, 100715.
- Federico, G., Morton, F.S., & Shapiro, C. (2020). Antitrust and innovation: Welcoming and protecting disruption.
- Innovation Policy and the Economy, 20(1), 125-190.
- Ferrera, M. (2020). Mass democracy, the welfare state and European integration: a neo-Weberian analysis.
- European Journal of Social Theory, 23(2), 165-183.
- Frankovic, I., Kuhn, M., & Wrzaczek, S. (2020). Medical innovation and its diffusion: Implications for economic performance and welfare. Journal of Macroeconomics, 66, 103262.
- Gornick, J.C., Milanovic, B., & Johnson, N. (2020). In search of the roots of American inequality exceptionalism: an analysis based onluxembourg income study (LIS) data. In Measuring and Understanding the Distribution and Intra/Inter-Generational Mobility of Income and Wealth. University of Chicago Press.
- Guillen, A.M., & Palier, B. (2004). Introduction: Does Europe matter? Accession to EU and social policy developments in recent and new member states. Journal of European Social Policy, 14(3), 203-209.
- Hassenteufel, P., & Palier, B. (2016). Still the sound of silence? Towards a new phase in the Europeanization of welfare state policies in France. In The Sovereign Debt Crisis, the EU and Welfare State Reform. Palgrave Macmillan, London.
- Hipp, L. (2020). Do hiring practices penalize women and benefit men for having children? Experimental evidence from Germany. European Sociological Review, 36(2), 250-264.
- Hornbeck, R., & Moretti, E. (2019). Estimating who benefits from productivity growth: Direct and indirect effects of city manufacturing TFP growth on wages, rents, and inequality. IZA Discussion Papers.
- Isett, K.R., Morrissey, J.P., & Topping, S. (2006). Systems ideologies and street?level bureaucrats: Policy change and perceptions of quality in a behavioral health care system. Public Administration Review, 66(2), 217- 227.
- Jing, T.K., Kuhnle, S., Pan, Y., & Chen, S. (2019). Aging welfare and social policy: China and the Nordic countries in comparative perspective. Springer.
- Kahanec, M., Szüdi, G., Kostolný, J., Gábos, A., Pawlowska, Z., & Pecillo, M. (2020). Research Infrastructure gaps report Central and Eastern Europe, Deliverable 7.2.
- Kaplan, G., Moll, B., & Violante, G. (2020). Pandemics according to HANK. Powerpoint presentation, LSE, 31.
- Kawamorita, H., Salamzadeh, A., Demiryurek, K., & Ghajarzadeh, M. (2020). Entrepreneurial Universities in Times of Crisis: Case of Covid-19 Pandemic. Journal of Entrepreneurship, Business and Economics, 8(1), 77-88.
- Kjhg Fink, J.J., & Brady, D. (2020). Immigration and preferences for greater law enforcement spending in rich democracies. Social Forces, 98(3), 1074-1111.
- Klijn, E.H., & Skelcher, C. (2007). Democracy and governance networks: compatible or not?. Public Administration, 85(3), 587-608.
- Kvist, J. (2013). The post-crisis European social model: developing or dismantling social investments?. Journal of International and Comparative Social Policy, 29(1), 91-107.
- Lynch, J. (2017). Reframing inequality? The health inequalities turn as a dangerous frame shift. Journal of Public Health, 39(4), 653-660.
- Macaulay, M., & Lawton, A. (2006). From virtue to competence: Changing the principles of public service. Public Administration Review, 66(5), 702-710.
- Marino, A., & Pariso, P. (2020a). Comparing European countries' performances in the transition towards the circular economy. Science of the Total Environment, 729, 138142.
- Marino, A., & Pariso, P. (2020b). From digital divide to e-government: Reengineering process and bureaucracy in public service delivery, Eletronic Government. An International Journal, DOI, 10.
- Moffett, S., Anderson-Gillespie, K., & McAdam, R. (2008). Benchmarking and Performance Measurement: A Statistical Analysis. Benchmarking: An International Journal, 15(4), 368-381.
- Ng, W.L. (2020). To lockdown? When to peak? Will there be an end? A macroeconomic analysis on COVID-19 epidemic in the United States. Journal of Macroeconomics, 65, 103230.
- O’Reilly, J., Eichhorst, W., Gábos, A., Hadjivassiliou, K., Lain, D., Leschke, J., McGuinness, S., Kureková, L. M., Nazio, T., Ortlieb, R., Russell, H., Villa, P., (2015). Five characteristics of youth unemployment in Europe: Flexibility, education, migration, family legacies, and EU policy. Sage Open, 5(1), 2158244015574962.
- O'Connor, J.S. (2014). Gender mainstreaming in the European Union: broadening the possibilities for gender equality and/or an inherently constrained exercise? Journal of International and Comparative Social Policy, 30(1), 69-78.
- OECD. (2020). Retrieved from http://www.oecd.org/newsroom/global-economy-faces-gravest-threat-since-the- crisis-as-coronavirus-spreads.htm
- Osborne, S.P. (2006). The new public governance?.
- Pavolini, E., & Natili, M. (2020). Towards a stronger relationship between national social dialogue and the European Semester?.
- President Eurogroup. (2020). Retrieved from https://www.consilium.europa.eu/it/press/press-releases/2020/03/25/letter-by-eurogroup-president-mario-centeno-following-the-eurogroup-of-24-march-2020/
- Rhodes, M. (1996). Southern European welfare states: identity, problems and prospects for reform. South European Society and Politics, 1(3), 1-22.
- Salamzadeh, A. (2020). What constitutes a theoretical contribution?. Journal of Organizational Culture, Communications and Conflict, 24(1), 1-2.
- Salamzadeh, A., & Dana, L.P. (2020). The coronavirus (COVID-19) pandemic: challenges among Iranian startups.
- Journal of Small Business & Entrepreneurship, 1-24.
- Salman, Y. (2020). Public management reforms in Pakistan. Public Management Review, 1-11.
- Seeleib-Kaiser, M. (2018). Citizenship, Europe and social rights. In Moving beyond barriers. Edward Elgar Publishing.
- Van Oorschot, W., & Chung, H. (2015). Feelings of dual-insecurity among European workers: A multi-level analysis. European Journal of Industrial Relations, 21(1), 23-37.
- von der Leyen, U. (2019). Retrieved from https://ec.europa.eu/commission/sites/beta-political/files/political-guidelines-next-commission_it.pdf
