Research Article: 2021 Vol: 25 Issue: 4S
The Effect of Foreign Trade Liberalization on the Foreign Direct Investment Inflows for Algeria Econometric Study Using Ardl Model during the Period (1994-2019)
Chemma Nawal, Ahmed Zabana University
Djelti Larbi, Ahmed Zabana University
Citation Information: Nawal, C., & Larbi. D. (2021). The effect of foreign trade liberalization on the foreign direct investment inflows for algeria econometric study using ardl model during the period (1994-2019). Academy of Accounting and Financial Studies Journal, 25(S4), 1-12.
Abstract
This study aims to analyze and diagnose the effect of foreign trade liberalization on the foreign direct investment (FDI) inflows for Algeria during the period between (1994-2019), autoregressive distributed lag model (ARDL) was applied. The results of this study indicate that on short run there is a negative impact of trade openness on FDI inflows for Algeria, owing to instability of investment environment in terms of the sudden changes in investment laws in Algeria, but on long run there is a positive relationship between trade openness and FDI inflows, because of the prominent contributor of Algeria’s exports value is hydrocarbon sector (HS), where multinational corporations (MNC) possess at least 49% of HS share. Although this positive relationship but the trade openness was in favor of imports at the cost of FDI inflows, and that it seemed clear through the weakness of FDI inflows value for Algeria, and the continuous growing of Algeria’s imports value.
Keywords
Foreign Trade Liberalization, Foreign Direct Investment, Co-Integration, ARDL Model, Algeria.
JEL Classifications
F13, E20, C32.
Introduction
After 1989, Algeria's economy has experienced deep transformations through structural economic reforms which were taken by Algeria under the supervision of the International Monetary Fund (IMF). One of these economic reforms is the liberalization of foreign trade to promote exports and reduce imports on the one hand, and to encourage the foreign direct investment inflows to Algeria on the other hand, also to rebuild the foreign exchange reserve as well as achieving economic and financial equilibriums .Algeria’s export value has increased from 44.43 US billion dollars in 1994 to 49.881 US billion dollars in 2019, as well as Algeria’s imports value has increased from 18.63 US billion dollars in 1994 to 56.272 US billion dollars in 2019, also the foreign direct investment inflows to Algeria have increased from zero US million dollars in 1994 to 1382 US million dollars in 2019. It appears from the first glance that there is an improvement on our national economy situation, but when we compare the value of these variables, we find that the value of foreign direct investment inflows to Algeria has increased with 1.382 US billion dollars from 1994 to 2019 while Algeria’s balance trade value has decreased from 25.8 US billion dollars to -6.391US billion dollars, which means that the Algerian economy has lost an important value is estimated with 32.191 US billion dollars at the same time. The importance of this study lies in the diagnosis of the success of Algeria's foreign trade liberalization policies in attracting foreign direct investment to encourage its economic growth.
From the above, we are faced with the following problem: what is the impact of foreign trade liberalization on the foreign direct investment inflows to Algeria?
To answer this questioning and investigate the relationship between trade liberalization and foreign direct investment inflows for Algeria, we have used descriptive approach to analysis the developments of these variables, also we have used econometric approach to study this phenomenon using mathematics methods as autoregressive distributed lag model (ARDL) and eviews10. Study’s data are a time series from 1994 to 2019, which was obtained from the United Nations Conference on Trade and Development (UNCTAD) database, and the World Bank (WB) database. Study’s variables are broken into dependent variable and explanatory variables, the first variable is the foreign direct investment inflows to Algeria as a ratio of real gross domestic product (FDIY), the second variables are trade openness index (TO) as a proxy for trade freedom score and the real growth rate (GY).
Among the previous studies that addressed some aspect of this topic:
1. Study of Qamar et al. (2018) indicated that increasing trade openness in India, Iran and Pakistan increases the FDI inflow in the short-run and as well as in the long-run.
2. In our study we found increasing trade openness in Algeria leads to increase the FDI inflows only on the long-run.
3. Study of Kunofiwa (2015) has found that there is no long run relationship between FDI and trade openness in Zimbabwe.
4. The results in our study show that there is a long relationship between FDI and trade openness in Algeria.
5. The results of the study of Khan & Qazi (2014) have indicated that trade openness along with real interest rate, negatively affect the inflow of FDI in Pakistan.
6. In our study we have concluded that there is a negative impact of trade openness on FDI inflows only on short-run.
This research paper is organized as follow:
Section 1 presents some Literature review. Section 2 we introduce a brief overview of trade liberalization and foreign direct investment. Section 3 contains methods and material applied. Section 4 contains the results of econometric and empirical study. Section 5 contains discussion, in this section we examine the robustness of the results in section 4, and finally in section 6 we present the conclusion.
Literature Review
Trade Liberalization
Economists have presented various definitions. According to Elizabeth (2006: 10) Trade liberalization policies are “policies that allow the unrestricted flow of goods and services”, Hasan (2016: 25) has defined Trade liberalization as the process of removing government controls on trade terms, enabling the opening of domestic markets and the assimilation into the international market.
Trade Freedom Score
Trade freedom is a composite measure of the extent of tariff and nontariff barriers that affect imports and exports of goods and services . The trade freedom score is based on two inputs:
1. The trade-weighted average tariff rate and
2. Non tariff barriers (NTBs) (Heritage, 2014: 477).
The base trade freedom score using the following equation:
Trade Freedomi = (((Tariffmax - Tariffi)/(Tariffmax- Tariffmin))*100) - NTBi
Where:
Trade Freedomi is the trade freedom in country i
Tariffmax is the upper bounds for tariff rates (%)
Tariffmin is the lower bounds for tariff rates (%)
Tariffi is the weighted average tariff rate (%) in country i.
NTBi is the penalty which subtracted from the base score of country i, this penalty ranges from 5 to 20 points. (Heritage, 2019: 465).
According to Heritage Foundation Company the trade freedom index is divided into five sub- categories: from 0 to 49.9 point repressed, from 50 to 59.9 point mostly unfree, from 60 to 69.9 point moderately free, from 70 to 79.9 point mostly free and from 80 to 100 point free (Heritage, 2021).
Foreign Direct Investment
Foreign direct investment (FDI) is very important especially at the level of developing countries as Algeria, because it creates added value, the economists have been contributing since 1960 to define FDI by several theories, which was summarized in the below Table 1.
| Table 1 Traditional Theories of Foreign Direct Investment | ||
| Theory | Contributor | Explanation |
| Monopolistic | Hymer (1960) | multinational corporations (MNC) must possess monopolistic advantages to outweigh the disadvantages faced in competing with indigenous firms of the host country |
| International Product - Life cycle | Vernon (1966) Wells (1972) |
The ability of MNC depends on its technological capability to introduce a new product in the market |
| Financial | Aliber (1970) | FDI can arise if the source country firm has an advantage in financing the capital over host country firms |
| Macroeconomic | Kojima (1973) Ozawa (1979) |
FDI should originate from the home country's comparatively disadvantaged industry to the comparatively advantaged industry in the host country |
| Internali-zation | Buckley & Casson (1976) Hennart (1982) |
to obtain a higher return on their investment, MNC will transfer their knowledge to foreign subsidiaries and then sell it on the open market. |
| Eclectic Paradigm | Dunning (1977) | FDI can arise when MNC have ownership, location, and internalization advantages. |
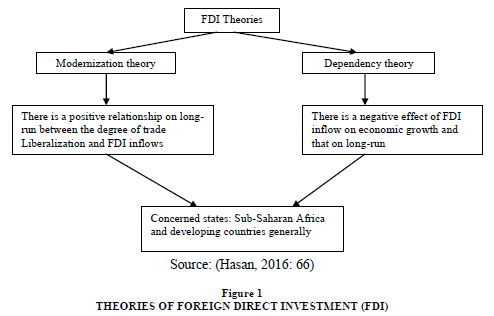
Besides these traditional theories of FDI, there are also two theories, which were illustrated in the following Figure 1.
We have proposed the following hypothesis: there is a positive relationship between the degree of trade liberalization and foreign direct investment inflows to Algeria.
Material and Methods
Model Specification
In order to test the relationship between foreign trade liberalization and foreign direct investment inflows into Algeria, we have used The Autoregressive Distributed Lag model (ARDL), and that to estimate the impact on long-run and short-run. This test (ARDL) is valid whether the variables are I(0) or I(1) (Mohsen et al., Scott, 2010: 583). The model is stated as (Agiomirgianakis et al., 2016: 10):
FDIY = ƒ (GY, TO)…………………………………..(1)
FDIY is the ratio of foreign direct investment inflows (FDI) in real gross domestic product (Y), GY is the real growth rate , is measured by the ratio ((Yt-Yt-1/ Yt-1))*100, where Yt is the real gross domestic product at present period (t) , Yt-1 is the real gross domestic product at previous period (t-1), TO is the ratio of exports (X) and imports (M) value in real gross domestic product.
GY =((Yt-Yt-1/ Yt-1))*100
Trade Openness (TO) = ((Exports + imports)/Y) (Malhotra & Kumari, 2017: 36). The generalized ARDL (p, q) model is specified as:

Where:
Yt = vector (meaning each variable can be used as the dependent variable).
Xt = the variables allowed to be stationary at an absolute level or after first difference or cointegrated.
B and δ = Coefficients.
γ = the constant or the intercept.
i = ranges from 1 to k, and it typifies the number of variables in the model.
εit= vector of the error terms which is serially uncorrelated (Kemboi et Martine, 2020: 138).
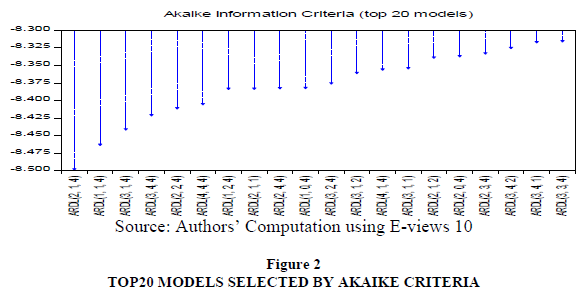
To select the prefered ARDL model it should determine the optimum lag length by using the Akaike Information Criterion (AIC), with the smallest value (Nkoro and Kelvin, 83: 2016). According to Akaike information criteria (see Figure 2) the prefered ARDL model which was selected is ARDL (2, 1, 4).
The econometric form of equation (1) is stated as:

Where:
B1, B2 and B3 are coefficients of the long-run parameters
Δ is the first difference operator
t −1 is the lag order selected by Akaike’s Information Criterion (AIC) (Justin and Sebastian, 2020: 36).
Data Source
Data on foreign direct investment inflows was sourced from the United Nations Conference on Trade and Development (UNCTAD) database with US dollars at current prices in millions. Data on other variables: real gross domestic product (Y), exports (X) and imports (M) were sourced from the World Bank (WB) database. Y, X and M were taken with US dollars at constant prices 2010 in billions. FDI was taken with US dollars at current prices in millions.
Table 2 shows that Algeria’s imports value experienced generally continuous growing, its value has passed from its lowest value 18,63 US billion dollars in 1994 to highest value (the peak) at 69.435 in 2015, which represents growth with 272,7%, while the exports value experienced weakness and fluctuation of its value, which ranged between 44.43 US billion dollars in 1994 and 74.218 US billion dollars in 2005, after this year exports value experienced generally continuous deterioration in its value until 2019, which recorded 49,881 US billion dollars, the value of this deterioration was evaluated at 24.337 US billion dollars.
| Table 2 Algeria’s Trade Openness Index During the Period (1994-2019) (UM: US billion $) | |||||
| Year | Exports (X) | Imports (M) | Real GDP (Y) | (X+M) | (X+M)/Y |
| 1994 | 44.43 | 18.63 | 89.762 | 63.06 | 0.70 |
| 1995 | 47.229 | 19.003 | 93.173 | 66.232 | 0.71 |
| 1996 | 50.771 | 16.475 | 96.993 | 67.246 | 0.69 |
| 1997 | 53.969 | 16.871 | 98.06 | 70.84 | 0.72 |
| 1998 | 54.887 | 18.102 | 103.062 | 72.989 | 0.71 |
| 1999 | 58.183 | 18.409 | 106.359 | 76.592 | 0.72 |
| 2000 | 61.885 | 19.803 | 110.401 | 81.688 | 0.74 |
| 2001 | 60.362 | 21.954 | 113.713 | 82.316 | 0.72 |
| 2002 | 62.803 | 26.886 | 120.081 | 89.689 | 0.75 |
| 2003 | 68.1 | 28.23 | 128.727 | 96.33 | 0.75 |
| 2004 | 70.189 | 31.695 | 134.262 | 101.884 | 0.76 |
| 2005 | 74.218 | 33.696 | 142.184 | 107.914 | 0.76 |
| 2006 | 72.258 | 33.193 | 144.601 | 105.451 | 0.73 |
| 2007 | 71.506 | 37.2 | 149.517 | 108.656 | 0.73 |
| 2008 | 69.461 | 42.929 | 153.106 | 112.39 | 0.73 |
| 2009 | 62.49 | 48.514 | 155.555 | 111.004 | 0.71 |
| 2010 | 61.955 | 50.638 | 161.155 | 112.593 | 0.70 |
| 2011 | 60.088 | 47.9 | 165.829 | 107.988 | 0.65 |
| 2012 | 57.816 | 54.572 | 171.467 | 112.388 | 0.66 |
| 2013 | 54.52 | 59.92 | 176.268 | 114.44 | 0.65 |
| 2014 | 54.629 | 64.954 | 182.966 | 119.583 | 0.65 |
| 2015 | 54.902 | 69.435 | 189.736 | 124.337 | 0.66 |
| 2016 | 58.746 | 67.491 | 195.808 | 126.237 | 0.64 |
| 2017 | 55.162 | 62.699 | 198.353 | 117.861 | 0.59 |
| 2018 | 53.121 | 60.442 | 200.733 | 113.563 | 0.57 |
| 2019 | 49.881 | 56.272 | 202.339 | 106.153 | 0.52 |
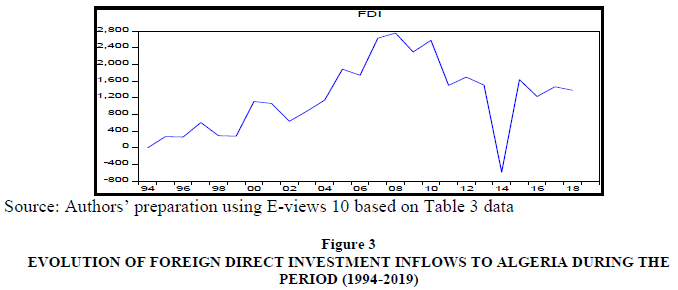
From Table 3 and Figure 3 we have remarked that the value of FDI inflows for Algeria has remained weak compared to the peak 2,754 US billion dollars which was recorded only in 2009. Through this analysis we concluded that the trade openness was in favor of imports at the cost of both exports and FDI inflows.
| Table 3 Evolution of Foreign Direct Investment Inflows to Algeria over the Period (1994-2019) (UM: US Million $) | |||||||
| Year | FDI | Year | FDI | Year | FDI | Year | FDI |
| 1994 | 0 | 2001 | 1113 | 2008 | 2632 | 2015 | -585 |
| 1995 | 0 | 2002 | 1065 | 2009 | 2754 | 2016 | 1636 |
| 1996 | 270 | 2003 | 638 | 2010 | 2301 | 2017 | 1232 |
| 1997 | 260 | 2004 | 882 | 2011 | 2581 | 2018 | 1466 |
| 1998 | 607 | 2005 | 1145 | 2012 | 1499 | 2019 | 1382 |
| 1999 | 292 | 2006 | 1888 | 2013 | 1697 | ||
| 2000 | 280 | 2007 | 1743 | 2014 | 1507 | ||
The results of Tables 4 to 9 indicate that all time series are stationary at the first difference.
Stationary Test of Time Series
| Table 4 Augmented Dickey Fuller Unit Root Test | ||||||
| Without Trend and Intercept | ||||||
| Level | First Difference | |||||
| Variables | t-statistcs | t-criticals | Status | t-statistcs | t-criticals | Status |
| FDIY | -1.082350 | -1.955020 | non- stationary | -7.179917 | -1.955681 | Stationary |
| GY | -0.863037 | -1.955681 | non- stationary | -8.937732 | -1.955681 | Stationary |
| TO | -1.468459 | -1.966270 | non- stationary | 3.777683 | -1.968430 | Stationary |
Bounds Test
| Table 5 ARDL Bounds Test | |||
| F-Bounds Test | |||
| F-Value | Signif. | I(0) | I(1) |
| 5.982025 | 10% | 2.63 | 3.35 |
| 5% | 3.1 | 3.87 | |
| 2.5% | 3.55 | 4.38 | |
| 1% | 4.13 | 5 | |
| Table 6 Long-Run Relationship ARDL Model | ||||
| Prob | t-Statistic | Std. Error | Coefficient | Variable |
| 0.1626 | -1.487762 | 0.001091 | -0.001623 | GY |
| 0.0002 | 5.138778 | 0.024722 | 0.127043 | TO |
| 0.0005 | -4.669163 | 0.016414 | -0.076640 | C |
Short-Run Relationship Test
| Table 7 Short-Run Relationship ARDL Model | ||||
| Variable | Coefficient | Std. Error | t-Statistic | Prob |
| D(FDIY(-1)) | -0.235374 | 0.143672 | -1.638278 | 0.1273 |
| D(GY) | -0.000494 | 0.000365 | -1.353037 | 0.2010 |
| D(TO) | -0.096501 | 0.031778 | -3.036713 | 0.0103 |
| D(TO(-1)) | -0.120241 | 0.043692 | -2.751996 | 0.0175 |
| D(TO(-2)) | -0.082644 | 0.042323 | -1.952667 | 0.0746 |
| D(TO(-3)) | -0.116819 | 0.040398 | -2.891684 | 0.0135 |
| CointEq(-1)* | -0.919418 | 0.168114 | -5.469015 | 0.0001 |
Serial Correlation Test
| Table 8 Serial Correlation LM Test | |
| Breusch-Godfrey Serial Correlation LM Test | |
| F-statistic 0.367823 |
Prob. F(2,20) 0.7012 |
| Obs*R-squared 1.507519 |
Prob. Chi-Square(2) 0.4706 |
Heteroskedasticity Test
| Table 9 Heteroskedasticity ARCH Test | |
| F-statistic 0.000603 |
Prob. F(1,19) 0.9807 |
| Obs*R-squared 0.000667 |
Prob. Chi-Square(1) 0.9794 |
Normality Test
Stability Diagnostics
Discussion
Stationary Test of Time Series
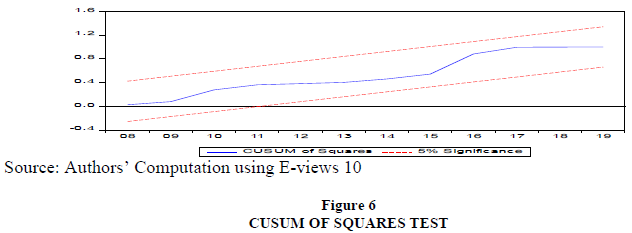
As a starting point, first we test the variables for a unit root. For this purpose, we use the Augmented Dickey Fuller (ADF) unit root test (Mukhtarov, 2019: 43). To test the stationary or non-stationary of the time series there is two hypotheses, null against the alternative, if calculated τ value was upper than critical τ value in absolute terms, alternative hypothesis of stationary is accepted and null hypothesis is rejected, while if calculated τ value was lower than critical τ value in absolute terms, null hypothesis of non-stationary is accepted and alternative hypothesis is rejected (Jehanzeb, 2006: 17) in Figures 4 to 6.
Bounds Test and Long-Run Relationship
If F-statistic exceeds the critical value of the upper bound, This implies that the null hypothesis of absence of a long-run relationship is rejected and the alternative hypothesis of presence of a long-run relationship is accepted (Omoregie et Ikpesu, 2019: 92). From the outputs in table 5 we remark that the value of F-statistic (5.982025) is greater than upper critical values at 10%, 5%, 2.5% and 1% levels. This implies the existence of a longrun relationship between dependent variable (FDIY) and explanatory variables (GY and TO). On the long-run, as shown in table 6 we have remarked these following points:
The long-run equation can be written as follow:
FDIY = -0.076640 - 0.001623 GY + 0.127043 TO
Short-Run Relationship
The relationship between GY and FDIY is negative and statistically insignificant. The trade openness (TO) has a positive significant impact on FDIY. A 1% increase for TO would increase FDIY with 0.127043%, which implies that a 1% increase for TO would lead FDI to improve with 0.00127043Y. We can explain this that the majority of foreign direct investment inward to Algeria was concentrated especially in hydrocarbon sector which represents almost all Algeria’s exports value.
On the short-run, as shown in Table 7 we have remarked these following points: The relationship between GY and FDIY is negative but statistically insignificant. The trade openness (TO) has a negative significant impact on FDIY at lag period 0, -1, and -3. A 1% increase for TO will lead FDIY to decline with 0.096501% , 0.120241% and 0.116819% at lag period 0, -1, and -3 respectively.
A 1% increase for TO will lead FDI to decline with 0.00096501 of Y , 0.00120241 of Y and 0.00116819 of Y at lag period 0, -1, and -3 respectively. The coefficient of the error correction term (-0.919418) is negative and statistically significant, which means that this model corrects its short-run disequilibrium by about 0.92% speed of adjustment in order to return to the long-run equilibrium. This highly significant error correction term is further proof that the long-run relationship is stable (Irina & Ana, 2014: 20).
The negative relationship between trade openness and foreign direct investment inflows to Algeria on short-run can be explained by the instability of investment environment in terms of the sudden changes in investment laws in Algeria.
Serial Correlation: If the probability value of Breusch-Godfrey Serial Correlation LM Test was greater than 5%, we accept the null hypothesis which means absence of Serial Correlation (Hui et al., 2019: 1677-1678). Through Table 8 we remark that the probability of chi-square value (0.4706) is upper than 5%, and so absence of serial correlation.
Heteroskedaticity ARCH test: If the probability value of the heteroskedaticity ARCH test was greater than 5%, we accept the null hypothesis which means absence of heteroskedaticity (Philip Ifeakachukwu Nwosa, 2018: 187). Through Table 9 we remark that the probability of chi-square value (0.9794) is upper than 0.05, so Absence of heteroskedaticity.
Normality test: If the probability value of Jarque-Bera is greater than 5%, the residuals follow the normality (Cambazoglu & Karaalp, 2014: 444). Through Figure 5 we observe that the probability value of Jarque-Bera (0.578327) is greater than 0.05, and so the residuals follow the normality.
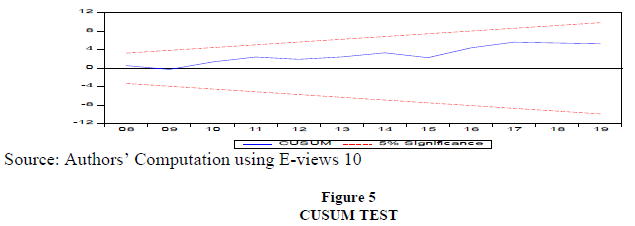
CUSUM and CUSUM of Square test: The results of CUSUM (Cumulative Sum) and CUSUM of Square tests (Mili, 2019: 170) prove that the model is stable during the period from 1994 to 2019, because the figure of CUSUM and CUSUM of Square remained within critical bounds at 5% significance. From the above explanatory tests stationary, CUSUM and CUSUM of Square, we conclude that this econometric model is appropriate to economic study.
Conclusion
We have tried through this study to shed and highlight the relationship in both short and long run between trade liberalization and foreign direct investment inflows to Algeria, using an autoregressive distributed lag model (ARDL). We have concluded the following results:
1. Existence a long- run relationship between trade openness and foreign direct investment inflows, where a 1% increase for trade openness would increase foreign direct investment inflows to improve with 0.127043%.
2. Existence a long- run insignificant negative relationship between real growth rate and foreign direct investment inflows, which a 1% increase real growth rate would lead foreign direct investment inflows to decline with 0.001623 %. We can explain this negative relationship by illegal competition between domestic firms and multi-national corporations (MNC), these MNC have a large amount of capital, skilled which allow them to exert a huge pressure on the domestic firms, and so decline their production, and that according to dependency theory of foreign direct investment.
3. Almost all value of foreign direct investments flow was tended to the hydrocarbon sector, instead of the productive sectors, and this is demonstrated by the negative relationship between real growth rate and foreign direct investment inflows.
4. On short-run there is a significant negative relationship between trade openness and foreign direct investment inflows, this negative relationship owing to instability of the investment environment in terms of the sudden changes in investment laws in Algeria.
5. The trade openness in Algeria was at the cost of export, and this is illustrated through a continuous progressive of imports’ value and the negative relationship between foreign direct investment and real growth rate.
6. The weakness of foreign direct investments’ value inflows to Algeria during the period of study.
7. Fluctuation and weakness of Algeria’s exports value, in return for a continuous increase of Algeria’s imports value.
8. Through these results, we can offer the following recommendations:
9. Algeria’s government should provide stability investment laws for many years to attract foreign investors to come to Algeria, which allow remaking its foreign exchange reserves.
10. Improving and modernizing the financial banking system, for example through encouraging e-commerce and e-payment.
11. Elimination of the illegal financial market.
12. Algeria’s government has to reactivate Algeria’s financial market in order to help Algeria’s banks to satisfy foreign investor desires.
13. Algeria’s government must reconsider the 49/51 rule investment.
14. The Algerian public authorities should accelerate to affiliate in the World Trade Organization (WTO), because the affiliation to this organization will help Algeria to attract many foreign investors, through reduction tariffs rates, also providing guarantees for them.
15. Facilitating endowment of industrial estates to foreign investors because of the time factor is very important to them.
16. Simplification and facilitation of customs and tax procedures.
17. One should activate economic diplomacy by promoting Algeria’s capabilities.
18. Removing bureaucratic obstacles by focusing on digitization.
References
- Agiomirgianakis et al. (2016). The Determinants of Foreign Direct Investment: A Panel Data Study for the OECD Countries, Discussion Paper Series, No. 03/06, Department of Economics, City University, London, 10, accessible at: https://www.researchgate.
- Ahmed, H. (2016). Factors Impeding Economic Growth in Sub-Saharan Africa Despite Liberalized Trade Policies: Perceptions of Academic Experts. Northcentral University.
- Alugbuo, J.C., & Uremadu, S.O. (2020). Trade liberalization and trade inflows: A study of Nigeria’s economy using ARDL model approach. GSC Advanced Research and Reviews, 4(1), 031-045. accessible at: https://www.researchgate.net/publication/343320176.
- Bahmani-Oskooee, M., & Hegerty, S.W. (2010). The J-and S-curves: A survey of the recent literature. Journal of Economic Studies, 37(6), 583,
- Ban, I.M., & MAfTeI, A.S. (2014). Determinants of Current Account Balance in Romania. Review of Economic Studies & Research Virgil Madgearu, 7(2).
- Cambazoglu, B., & Karaalp, H.S. (2014). Does foreign direct investment affect economic growth? The case of Turkey, International Journal of Social Economics, 41(6), 444.
- Cheema, J. (2006). Bilateral Trade Between Pakistan and Her Trading Partners: The Effect of Exchange Rate on Trade Balance (Doctoral dissertation, University of Wisconsin--Milwaukee), 17.
- Hassan, M. (2000). Trade balances, economic growth and linkages to multinational foreign direct investment. Nova Southeastern University, accessible at: https://medi a. proquest.com/media/pq/classic/doc/727774361.
- Jia, H., Liu, B., & Li, J. (2019). The Factors Influencing the Employment of Producer Services—From the Perspectives of Demand and Supply. American Journal of Industrial and Business Management, 9(08), 1666.
- Khan, R.E.A., & Adnan Hye, Q.M. (2014). Foreign direct investment and liberalization policies in Pakistan: An empirical analysis. Cogent Economics & Finance, 2(1), 944667.
- Kipkorir, K.M., & Oleche, O. (2020) Short and Long-Run Impact of Trade Liberalization on Agricultural Growth in Kenya, International Journal of Finance, Insurance and Risk Management, X(3), 138, accessible at: https://www. researchgate.net/profile/Michael-Kemboi/publication/344495694.
- Malhotra, N., & Kumari, D. (2017). Trade Liberalization and Export-led Growth in India. Journal of International Economics (0976-0792), 8(1), 36.
- Mili, A. (2019). The impact of oil prices on the trade balance of South Africa. Euro Economica, 38(1), 170.
- Mukhtarov, S., Alalawneh, M.M., Ibadov, E., & Huseynli, A. (2019). The impact of foreign direct investment on exports in Jordan: An empirical analysis. Journal of International Studies, 12(3).
- Nkoro, E., & Uko, A.K. (2016). Autoregressive Distributed Lag (ARDL) cointegration technique: application and interpretation. Journal of Statistical and Econometric Methods, 5(4), 63-91.
- Nwosa, P.I. (2018). Trade Policy and Export Diversification in Nigeria: An ARDL Approach. Euro Economica, 37(01), 180-190.
- Omoregie, O.K., & Ikpesu, F. (2019). Effect of Oil Price, And Exchange Rate on Current Account Balance In Nigeria. The Journal of Developing Areas, 53(4).
- Qamar et al. (2018). Trade Openness and FDI Inflows: A Comparative Study of Asian Countries, European Online Journal of Natural and Social Sciences, 7(2), accessible at: https://www.researchgate.net/profile/Imran-M/publication/333389066.
- Ray, E.T. (2006). The effects of trade liberalization policies on human development in selected least developed countries, a Dissertation for the degree of Doctor of Philosophy, University of North Texas, 10. accessible at: https://media.proquest.com/media/pq/classic/doc/1288653141.
- Tsaurai, K. (2015). Trade openness and FDI in Zimbabwe: what does data tell us?. Corporate Ownership & Control / 12(4), accessible at: http://uir.unisa. ac. za/bitstream/handle/10500/22977.
