Research Article: 2020 Vol: 24 Issue: 3
The Effect of Debts on Economic Development
Badreldin Mohamed Ahmed Abdulrahman, Jouf University
Abderhim Elshazali Yahia, Jouf University
Hamza Abdallah Abdalrhman, Jouf University
Tarig Osman Abdallah Helal, Jouf University
Abstract
This study aims to discuss the effect of debts on economic development. It is a descriptive review article that emphasizes the impact of debts or economical help on international affairs. The study depended on secondary data, namely debt report 2020 of World Bank Group. The obtained results showed that; the economical help seems to be a necessity of the time while due to its adverse effects in case of excessive use, there must be the strategies and pre-planning for utilizing and returning the debt. It concluded that; there are both sides negative and positive of the debt on every level, while in order to keep it only on the optimizing state, it is important to understand the consequences and make the moves according to the need.
Keywords
Debt, Economic Help, Financial Debt, Economic Growth, Effects of Debt.
Introduction
Debts have helped many regions to rise and enhance their own potential in the developed world however there are also other universal factors that make the situation sensitive from the international and national perspective (Haggard & Kaufman, 2018). The developed world is often recognized by the economic state of the countries. There are perhaps, some major regions that have been playing a major role in the developing world economic development (Lof, & Malinen, 2014).
Developed countries tend to help the countries economically. The debt helps to improve welfare while if it is used in excess and irresponsibly, it can be one of the most disastrous acts for any nation (Furtado, 2018). From microeconomic prospective the debt or borrowing in an excess amount can lead to the financial crisis or the bankruptcy however on the macroeconomic level like for the whole country; the debt on a significant level put an image of incompetence of the government in order to provide the services and facilities to its country locales (Ali & Malik, 2017).
For the matter of fact these economical help plays a major role in putting the international image and hence it becomes one of the major agendas for international affairs globally (Poghosyan, 2014).
This study is focusing on the debt effects on the countries nationally economic development as well as internationally and how these particular factors put an impact on the international image. The rest of the paper falls into four sections; section two reviews the literature, section three discusses the methodology. The results, discussions and conclusion are in section four and five respectively.
Literature Review
Economic Development refers to the process of improving the quality of all human lives and capabilities by raising people’s levels of living, self-esteem, and freedom. Todaro (2011) defined economic development as the study of how economies are transformed from stagnation to growth and from low income to high income status, and overcome problems of absolute poverty.
From the past statistics of the debts, in the last 35 years the ratio of the debt to GDP has grown over 147%. However according to the graph, the ratio increases around 5 % every year. While in the light of current demographics and policies, it does not seem to be an easy job to stop these practices any time soon (Cohn, 2016). Thus, debts ratios to GDP in past decades showed it grown. So, the public debt became is very important for agenda of many countries as reported by (Kragelund, 2015), (Cohn, 2016) and (Hutchinson, 2016).
The borrowing money allows businesses to invest and make profit, to help them to be able to grow while without investing it will not be possible to take optimizing decisions for the company (Furtado, 2018). Likewise, when the companies and businesses are able to borrow, the fiscal authorities can play their essential role in order to stabilize the macroeconomy (Ali & Malik, 2017). However, it is often witnessed that debt is the major root of creating significant vulnerabilities. When the ratio of debt reaches a certain level, it rather than solving the financial crisis increases it to the severe stage.
Most of modern nations are currently near a defining moment like the one encountered by Japan in the mid-1990s. Subsequent to having declined and remained moderately steady, absolute reliance proportions will increment quickly in these nations throughout the following hardly any decades (Barston, 2014).
In the Eurozone, the open obligation proportion will likewise rise, but less quickly than in the UK or US, mirroring the way that numerous nations face just an unobtrusive ascent later on expenses of maturing (Teles & Mussolini, 2014).
The persistent gathering of non-money related obligation has matched with some significant institutional and advertising advancement (Claessens et al., 2014). In the first place, from the late 1970s onwards, confinements on money related market action and loaning had been dynamically and methodically expelled, expanding chances to acquire. Joined with upgrades in budgetary hypothesis and data innovation, this progression has prompted a heightening of money related advancement (Coccia, 2017). The capacity to value complex money related items is for sure an essential for manufacturing and selling those (Reeves et al., 2014). Second, beginning in the mid-1980s and proceeding until the beginning of the ongoing emergency (Dilip, 2017).
According to Todaro and Smith (2011) foreign aid defined as the international transfer of public funds in the form loans or grants either directly from one government to another (bilateral assistance) or indirectly through the vehicle of a multilateral assistance such as the World Bank. Therefore, that economists have defined foreign aid as any flow of capital to developing country that meet two criteria: (1) its objective should be non-commercial from the point of view of the donor, and (2) it should be characterized by concessional terms; that is, the interest rate and repayment period for borrow capital should be softer (less stringent) than commercial terms.
A large majority studies on the debt-growth relationship find a threshold somewhere between 75 and 100 percent of GDP. More importantly, every study except two finds a negative relationship between high levels of government debt and economic growth. This is true even for studies that find no common threshold. The empirical evidence overwhelmingly supports the view that a large amount of government debt has a negative impact on economic growth potential and in many cases that impact gets more pronounced as debt increases. The current fiscal trajectory of the United States means that in the coming 30-year period, the effects of a large and growing public debt ratio on economic growth could amount to a loss of $4 trillion or $5 trillion in real GDP, or as much as $13,000 per capita, by 2049 (De Rugy & Salmaon, 2020).
The following Table 1 provides the statistics of the official development assistance (ODA) by region for year 2008.
| Table 1: Official Development Assistance (Oda) By Region, 2008 | |||
| Region | ODA per-capita U$ | GNI per-capita U$ | ODA as a share 0f GNI% |
|---|---|---|---|
| Middle East& North Africa | 73 | 3237 | 1.9 |
| Sub- Saharan Africa | 49 | 1077 | 4.3 |
| Latin American& Caribbean | 16 | 6768 | 0.2 |
| East Asia & Pacific | 5 | 2644 | 0.2 |
| South Asia | 8 | 963 | 0.8 |
| European& Central Asia | 19 | 7350 | 0.2 |
Methodology and Data Collection
This study is focusing on the debt effects on the countries nationally economic development as well as internationally and how these particular factors put an impact on the international image.it depends on analyzing secondary data in many reports. This descriptive review article used the debt report 2020 of World Bank Group. Hence the study data were collected from the World Bank’s World Development Indicators database to find the effect of debts on economic growth.
Results and Discussion
The external debt was an important stimulator of economic growth and a way to balance the budget. According to some past investigations, open obligation proportions are presently in an unstable way in various modern nations. To avert further disintegration, these nations should execute extraordinary strategy changes that lessen current shortages, just as future unexpected and understood liabilities. However, adjustment probably won't be sufficient, particularly on the off chance that it is at a level sufficiently high to harm development (Barston, 2014).
The following table explains the debt ratio (%) and gross national income (GNI) for the year 2010 compared with year 2018 based on debts statics from World Bank.
It clears from above table that the debt ratio % for all six regional groups (East Asia and Pacific, Europe and Central Asia, Latin America and Caribbean, Middle East and North Africa, South Asia, and Sub-Saharan Africa), and two income groups (low-income and middle-income countries). Under unaltered monetary strategy, obligation to-GDP proportions will detonate in everything except a couple of nations. Obligation rapidly ascends to over 100% of GDP a level obviously predictable with negative ramifications for development. Also, in various nations Japan, the United Kingdom, and the United States the projections raise a lot further (Table 2).
| Table 2: Debt Ratios % For Year 2010 | |||||||
| Region | External debt stocks to exports (%) | External debt stocks to GNI (%) | Debt service to exports (%) | Short-term to external debt stocks (%) | Multilateral to external debt stocks (%) | Reserves to external debt stocks (%) | Gross national income (GNI) |
|---|---|---|---|---|---|---|---|
| East Asia & Pacific (excluding high income) | 51.0 | 15.6 | 4.7 | 52.1 | 7.3 | 271.3 | 7,570,190.6 |
| European& Central Asia (excluding high income) | 127.8 | 41.9 | 21.9 | 18.2 | 6.0 | 54.0 | 3,017,081.3 |
| Latin American& Caribbean (excluding high income) | 116.6 | 22.6 | 15.2 | 16.8 | 11.9 | 54.6 | 4,708,202.3 |
| Low& Middle Income | 82.1 | 22.3 | 10.0 | 26.7 | 11.0 | 118.8 | 19,775,604.2 |
| Low Income | 96.4 | 24.8 | 4.6 | 7.9 | 48.9 | 69.5 | 331,285.30 |
| Middle Income | 81.9 | 22.3 | 10.1 | 27 | 10.2 | 119.8 | 19,442,124.30 |
| Middle East& North Africa (excluding high income) | 58.5 | 16.7 | 7.4 | 19.6 | 19 | 155.4 | 1,150,900.60 |
| South Asia | 96 | 19.9 | 7.4 | 16.3 | 24.5 | 76.9 | 2,058,333.70 |
| Sub- Saharan Africa (excluding high income) | 75.2 | 23.7 | 4.7 | 16.2 | 19.6 | 52 | 1,270,326.70 |
Source: IDS Report 2020.
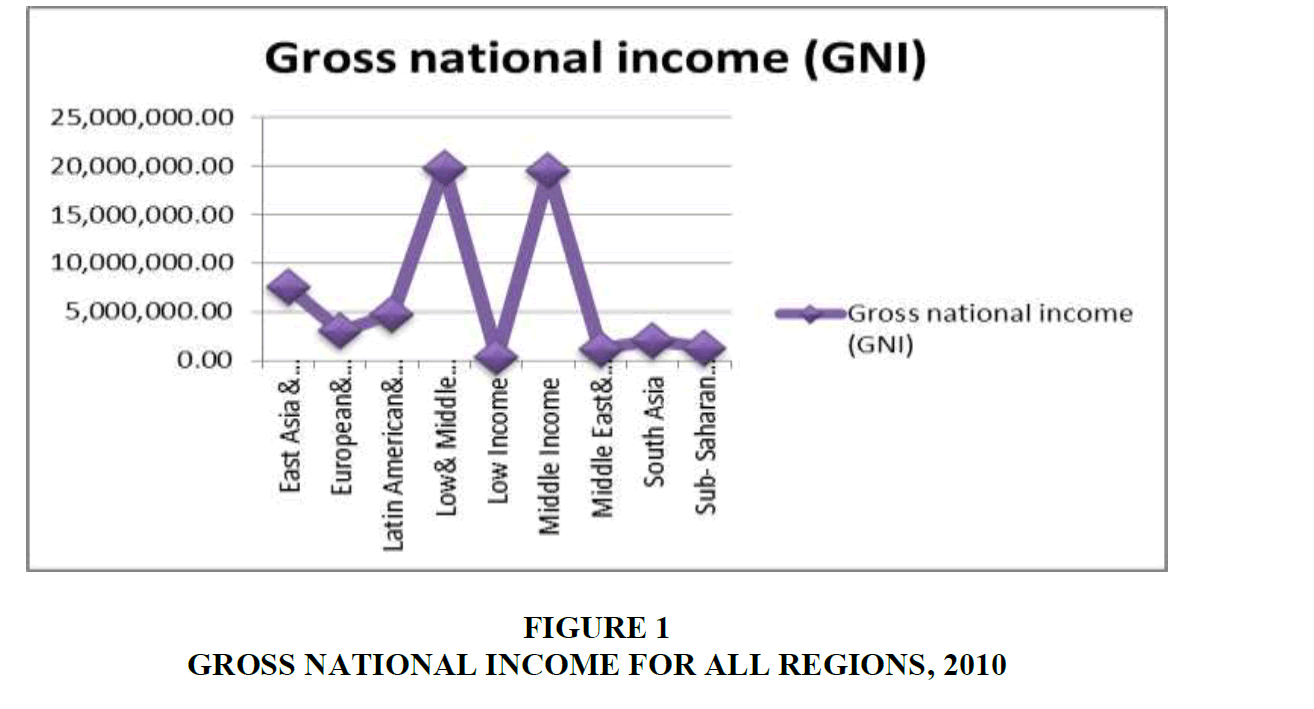
The Figure 1 shows gross national income (GNI) for all six regions and two income groups (low-income and middle-income countries).
From Figure 1, the lowest gross national income (GNI) is in Sub-Saharan Africa, while the largest one is in East Asia & Pacific for year 2010 (Table 3).
| Table 3: Debt Ratios % For Year 2018 | |||||||
| Region | External debt stocks to exports (%) | External debt stocks to GNI (%) | Debt service to exports (%) | Short-term to external debt stocks (%) | Multilateral to external debt stocks (%) | Reserves to external debt stocks (%) | Gross national income (GNI) |
|---|---|---|---|---|---|---|---|
| East Asia & Pacific (excluding high income) | 72 | 17.6 | 9.1 | 49.1 | 3.9 | 127.6 | 15,832,216.80 |
| European& Central Asia (excluding high income) | 121.5 | 46.1 | 23.7 | 16 | 6.5 | 40.5 | 3,305,079.60 |
| Latin American& Caribbean (excluding high income) | 159.6 | 37.6 | 22.4 | 15.3 | 9 | 41.5 | 4,972,319.80 |
| Low& Middle Income | 100.8 | 25.6 | 14 | 27.5 | 8.5 | 73.4 | 30,564,926.50 |
| Low Income | .. | 27.8 | .. | 6 | 42.8 | .. | 540,908.00 |
| Middle Income | 100.4 | 25.5 | 14.2 | 27.9 | 7.8 | 74.3 | 30,025,602.80 |
| Middle East& North Africa (excluding high income) | 93.7 | .. | 10.3 | 15.7 | 18 | .. | .. |
| South Asia | 109.8 | 21.1 | 12.1 | 17.9 | 16.6 | 59.2 | 3,456,436.30 |
| Sub- Saharan Africa (excluding high income) | 134.5 | 36.2 | 14.1 | 11.7 | 18.9 | 28 | 1,611,071.80 |
Source: IDS Report 2020
According to WBG 2020, Net financial flows, debt and equity combined; to low- and middle-income countries totaled $1 trillion in 2018, 19 percent lower than the comparable inflows in the prior year. Driving the downturn was a 31 percent fall in net debt inflows to $516 billion and a 49 percent reduction in portfolio equity inflows. Inflows of foreign direct investment (FDI) $469 billion were little changed from 2017. China was the principal recipient of net financial flows to low- and middle-income countries in 2018, $472 billion, equivalent to 46 percent. At the regional level countries in Latin American and the Caribbean (LAC) accounted for the largest share $272 billion (27 percent), followed by countries in East Asia and Pacific (EAP), other than China, $115 billion (11 percent). Debt inflows surpassed equity inflows in all regions in 2018 except South Asia (SAS) where equity inflows accounted for 60 percent of total inflows and Europe and Central Asia (ECA) where debt flows were negative (- $11 billion).
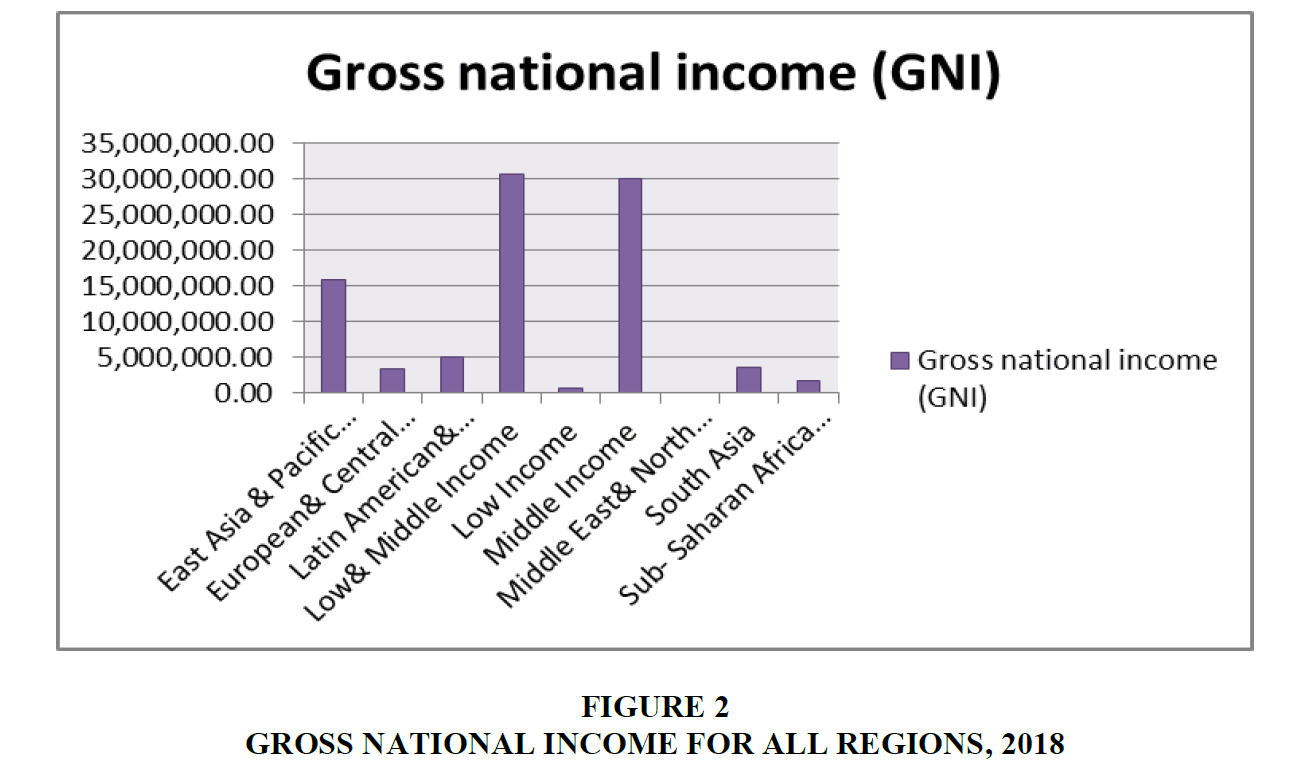
The Figure 2 shows gross national income (GNI) for all six regions and two income groups for 2018.
The above Figure 2 illustrates that the lowest gross national income (GNI) is in Sub- Saharan Africa, while the largest one is in East Asia & Pacific for year 2018.
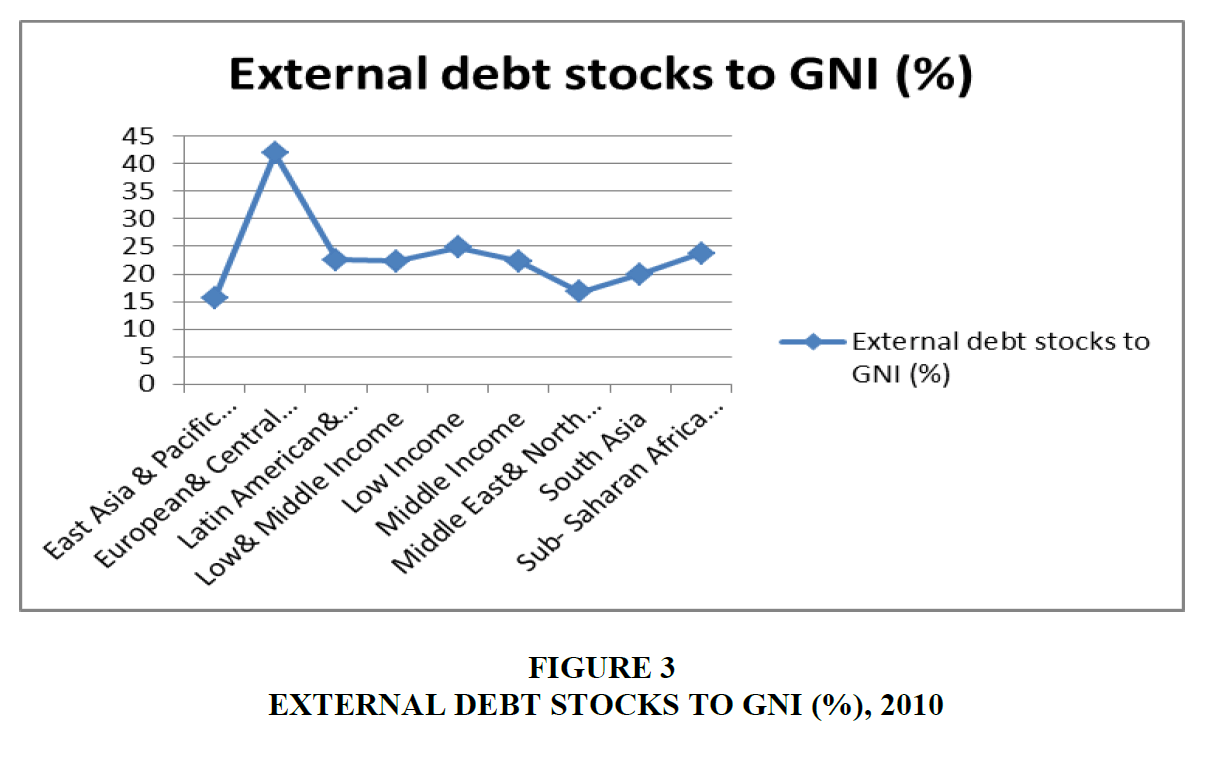
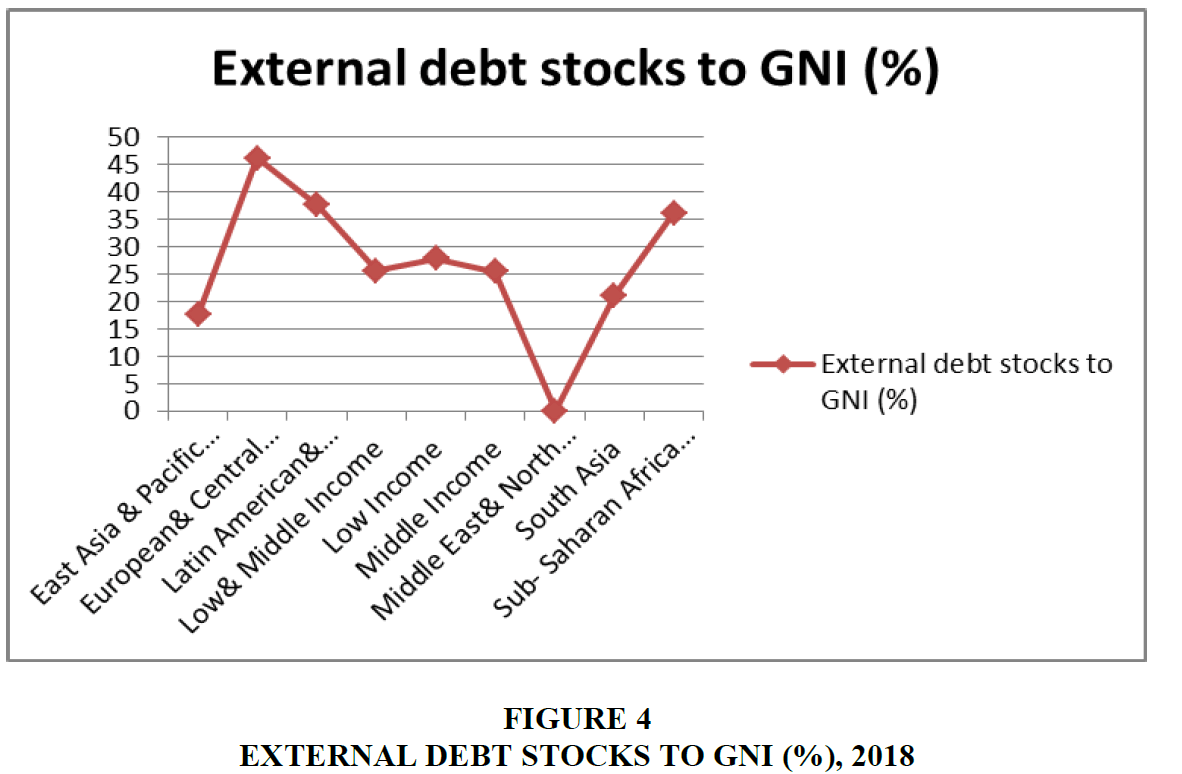
Figures 3 and 4 show the external debt stock to GNI% for all regions and income groups for year 2010 and 2018 respectively.
Figure 3 illustrates that the external debt stocks to GNI% for year 2010 are (15.6), (19.9), (22.3), (22.6), (23.7) and (41.9) for the region East Asia and pacific, South Asia, Middle East and North Africa, Latin American & Caribbean, Sub-Saharan Africa, and European& Central Asia respectively.
Figure 4 shows that the external debt stocks to GNI% for year 2018 are (17.6), (21.1), (36.2), (37.6), and (46.1) for the region East Asia and pacific, South Asia, Sub-Saharan Africa, Latin American & Caribbean and European& Central Asia respectively.
From above, the results came to the conclusion that on the initial stages debts can be helpful for the growth of the businesses and countries however if they are not taken with plan and strategic approach, debt can develop even more crisis in the results. For the government level debt, the limit is almost 85% of the GDP however on the corporate level debt, the threshold can be considered around 90%. The household debt can also go around 85% of the GDP, whereas the particular area as an impact fact is not estimated very precisely. This result is similar to what concluded by Furtado (2018). So, the government and the corporations can work on the optimizing path regarding their investments, while on the governmental level, it is always advices to work on reducing the level of the debt taking and improving the strategies for returning the borrowed money right on the time. And this is similar to results of Kragelund, (2015).
Debts do not only help the nation to grow in a rightful direction but also put an international image of the responsible nature. That also enhances the interests of the other countries to work with yours in order to make better businesses, trades and other international affairs for the long term.
Conclusion
The study concludes that the rate of debt taking is noticeably increasingly following the fact that it is that finance is an essential need for development. For keeping the balance, it is important to know the threshold of the debt on the initial steps otherwise it can turn into a most disastrous factor for the nation. The study concludes that on the initial stage’s debts can be helpful for the growth of the businesses and countries however if they are not taken with plan and strategic approach, debt can develop even more crisis. It eventually put an impact on poor relationships with the well-developed regions which led to bad business opportunities. The best way to avoid the diverse effects is to strategize before using the debt amount according to the threshold.
References
- Ali, M., & Malik, I.R. (2017). Impact of foreign direct investment on economic growth of Pakistan. Retrieved from https://ssrn.com/abstract=3104717
- Barston, R.P. (2014). Modern diplomacy. Routledge.
- Claessens, S., Kose, M.M.A., Laeven, M.L., & Valencia, F. (2014). Financial crises: Causes, consequences, and policy responses. International Monetary Fund.
- Cohn, T.H. (2016). Global political economy: Theory and practice. Routledge.
- De Rogy, V., & Salmon, J. (2020). Debts and growth: A decade of Studies. Policy Brief. Mercatus Center and George Mason University (1-12).
- Doyle, M.W., & Stiglitz, J.E. (2014). Eliminating extreme inequality: A sustainable development goal, 2015?2030. Ethics & International Affairs, 28(1), 5-13.
- Furtado, C. (2018). Economic development of Latin America. In Promise of Development (124-148). Routledge.
- Haggard, S., & Kaufman, R.R. (2018). The politics of economic adjustment: International constraints, distributive conflicts and the state. Princeton University Press.
- Hutchinson, M.G. (2016). Early economic thought in Spain 1177-1740. Liberty Fund.
- Kragelund, P. (2015). Towards convergence and cooperation in the global development finance regime: Closing Africa's policy space? Cambridge Review of International Affairs, 28(2), 246-262.
- Lof, M., & Malinen, T. (2014). Does sovereign debt weaken economic growth? A panel VAR analysis. Economics Letters, 122(3), 403-407.
- Poghosyan, T. (2014). Long-run and short-run determinants of sovereign bond yields in advanced economies. Economic Systems, 38(1), 100-114.
- Reeves, A., McKee, M., Basu, S., & Stuckler, D. (2014). The political economy of austerity and healthcare: Cross-national analysis of expenditure changes in 27 European nations 1995?2011. Health policy, 115(1), 1-8.
- Zangari, E., (2014). Addressing the debt bias: A comparison between the Belgian and the Italian ACE systems (No. 44). Directorate General Taxation and Customs Union, European Commission.
- Coccia, M. (2017). Asymmetric paths of public debts and of general government deficits across countries within and outside the European monetary unification and economic policy of debt dissolution. The Journal of Economic Asymmetries, 15, 17-31.
- Dilip, R. (2017). The impact of remittances on economic growth and poverty reduction. Policy Brief.
- Teles, V.K., & Mussolini, C.C. (2014). Public debt and the limits of fiscal policy to increase economic growth. European Economic Review, 66, 1-15.
- Todaro, M.P., & Stephen, C.S. (2011). Economic Development. Pearson Education Limited.


