Research Article: 2022 Vol: 28 Issue: 4S
The Determinants of Firm Value: A Path Analysis of Thai Listed Non Financial Companies
Kamphol Panyagometh, National Institute of Development Administration (NIDA)
Citation Information: Panyagometh, K. (2022). The determinants of firm value: a path analysis of Thai listed non-financial companies. Academy of Entrepreneurship Journal, 28(S4), 1- 16.
Keywords
Firm Value, Non-Financial Companies, Stock Exchange, Thailand
Abstract
This study aims to examine and analyze effects of financial leverage, profitability, firm size, and investment opportunity on dividend policy, and effect of all those variables on firm value using path analysis. The observations were all non-financial companies that went public and listed on the Stock Exchange of Thailand during 2010Q1 to 2021Q1. The research also considers idiosyncratic nature of firms in different sectors in which analysis in non-financial companies is categorized into sectors: agro & food industry, consumer products, industrials, property & construction, resources, services, and technology to examine determinants of dividend policy and firm value. Research results suggest that financial leverage has a negative influence on dividend policy of firms in certain industries but poses no effect on firm value of companies listed on the Stock Exchange of Thailand. Profitability, on the other hand, shows positive significance on both dividend policy and firm value of firms in Thai stock market. Meanwhile, firm size, investment opportunity, and dividend policy have a positive impact on non-financial companies in the Stock Exchange of Thailand only in certain sectors.
Introduction
Dividend policy is one of the most studied research topics in the financial literatures as it relates to corporate decision whether to distribute income to its stockholders in terms of dividends or to reinvest in the company for future investment. Dividends are of concern to investors as they relate to investment returns. Generally, investors invest in the company’s stock to make a profit in terms of both capital gains and dividends. Firm’s decision toward dividend policy is an important task for management as it can enhance firm value with great touch on the company’s stock price which can also affect asset prices, capital structure, merger and acquisitions, and capital budgeting. Hence, commitment to pay dividend should be positive signal that enhance firm value as it reflects firm performance and prospective returns for investors.
Theoretically, there are several factors of firm characteristics suggested by literatures that can influence dividend policy and firm value, both directly and indirectly. In this study, the effect of financial leverage, profitability, firm size, and investment opportunity on dividend policy as well as effect of dividend policy on firm value is studied for the case of non-financial listed companies in the Stock Exchange of Thailand.
Literature Review
Relationship of Financial Leverage, Dividend Policy and Firm Value
Financial theory relates the relationship between corporate leverage and dividend payout policy is the agency theory which is conflicts of interests arising between common stockholders and managers. According to Chrutchley & Hansen (1989), one way to reduce equity agency costs is to seek higher proportion of debt-financing. As a result, the higher dividend payout, the higher chances that the company will choose external funding. Such negative linkages between company’s financial debt and dividend policy were also reaffirmed by the simultaneous research work by Jensen, et al., (1992). Recent study by Tamimi & Takhtaei (2014) also indicated adverse relationship between the ratio of corporate financial leverage and amount of dividend among Iranian companies.
H1a: Financial leverage negatively affects dividend policy of non-financial listed companies at Stock Exchange of Thailand.
Debt creation can be used in motivating organization efficiency and reducing agency costs. Such effects were called “control hypothesis” in the paper conducted by Jensen (1986). That is, leverage reduces the agency costs of free cash flow available for spending at the discretion of managers. Hence, lower agency problem arising from increased leverage can translate to higher firm value as it lowered barrier to corporate efficiency. Moreover, financial leverage can improve corporate value owing to its tax shield and tax-deductible characteristics (Fama & French, 1998). Thus, high debt levels were associated with the greater corporate value with respect to tax shield, signaling hypothesis, and free cashflow hypothesis (Davies et al., 2005). In addition, the positive influence of financial leverage to firm value tended to be stronger in firms with higher quality (Cheng & Tzeng, 2011).
H2a: Financial leverage has a positive effect on firm value of non-financial listed companies at Stock Exchange of Thailand.
Relationship of Profitability, Dividend Policy and Firm Value
Profitability is considered an important factor in determining dividend payment of a company. Generally, highly profitable firms were more likely to declare and pay higher dividends (Abor & Bokpin, 2010; Labhane & Das, 2015)
H1b: Profitability has a positive effect on dividend policy of non-financial listed companies at Stock Exchange of Thailand.
Profitability is significant on firm value as it is one of the key financial statements that reflects corporate management. In addition, it provides a means of communicating governance and company performance to stakeholders. Hence, high profitability reflects corporate’s ability to generate higher value to its stockholders. (Iturriaga & Sanz, 2001; Tui et al., 2017).
H2b: Profitability has a positive effect on firm value of non-financial listed companies at Stock Exchange of Thailand.
Relationship of Firm Size, Dividend Policy and Firm Value
Firm size is expected to have both positive effect on dividend policy and firm value. As larger firms tend to be more mature and have easier access to capital markets, they are more likely to be less dependent on internal funds (Lloyd, 1985). Firm size can also be seen as total assets owned by the company that can be later utilized for the corporate activities. Larger company with more ease to the capital to operate is more likely to generate higher earnings and create greater firm value to its stakeholders (Tui et al., 2017). In addition, the size of large company can be a proxy of corporate growth. That is, larger firms capture greater positive investors’ response in the capital market and reflect increasing firm value (Lumapow & Tumiwa, 2017).
H1c: Firm size has a positive effect on dividend policy of non-financial listed companies at Stock Exchange of Thailand.
H2c: Firm size has a positive effect on firm value of non-financial listed companies at Stock Exchange of Thailand.
Relationship of Investment Opportunity, Dividend Policy and Firm Value
Langsen (1988) explained the linkages between investment opportunity and dividend payout with the residual theory of dividends. That is, the company with prosper investment opportunity both in current and in the future should plow back most of their corporate earnings into their business operations and seek financing in the capital markets at the “optimal capital structure” levels. Hence, the dividend payouts were only at a relatively small fraction of their earnings. Moreover, companies with great investment opportunity are likely to set aside more money to finance their future investment, which leads to less dividend payouts (Labhane & Mahakud, 2016). Recent study by Ifadah & Witiastuti (2021), also confirmed significant negative effect of the investment opportunity on the dividend policy of manufacturing companies listed in the Indonesian Stock Exchange (IDX).
H1d: Investment opportunity negatively affects dividend policy of non-financial listed companies at Stock Exchange of Thailand.
Investment opportunity is regarded as investment decision indicator in the form of asset combination and investment choices that will generate positive Net Positive Value (NPV) and as a result affecting the company’s value. Firms with high investment opportunity shows higher growth potential that a company can produce higher profits in the future. (Iturriaga & Sanz, 2001; Davies et al., 2005; N.K.A., & G.B., 2018)
H2d: Investment opportunity has a positive effect on firm value of non-financial listed companies at Stock Exchange of Thailand.
Relationship of Dividend Policy and Firm Value
Dividend policy is one of the most studied subjects in finance where many scholars have engaged in extensive attempts to determine how corporates should manage their dividend policy. Generally, companies that commit to dividend payment believe that dividend policy can significantly affect their firm value. One argument is that dividend policy is communication information about a firm’s future prospects to investors, which is often referred as signaling explanation. (Baker et al., 1985; Baker & Powell, 1999; Omran & Pointon, 2004; Dasilas & Lyroudi, 2009; Priya & Mohanasundari, 2016; Putri & Rachmawati, 2017).
H3: Dividend policy has a positive effect on firm value of non-financial listed companies at Stock Exchange of Thailand.
Research Method
Population and Samples
The research is conducted with quantitative approach with the data from non-financial public companies listed in the Stock Exchange of Thailand (SET). The secondary data used is obtained through quarterly financial statement issued by company from 2010Q1 – 2021Q1 periods. By using purposive sampling method with data availability criteria, there are 471 manufacturing companies selected as samples.
| Table 1 Number of firm by industry |
|
|---|---|
| Industry | Number of Firms |
| Agro & Food Industry | 55 |
| Consumer Products | 38 |
| Industrials | 85 |
| Property & Construction | 94 |
| Resources | 53 |
| Services | 109 |
| Technology | 37 |
Data
Data used in this study consists of endogenous and exogenous variables. Endogenous variables are dividend policy and firm value. Meanwhile, four exogenous variables are financial leverage, profitability, firm size and investment opportunity. The operational variable definitions used in this study are as follow:
| Table 2 Operational variable definitions |
||
|---|---|---|
| Variables | Indicators | Measurement |
| Endogenous Variables | ||
| Firm Value Is value of business entity to generate profits in the future measured at current market value | TobinsQ | 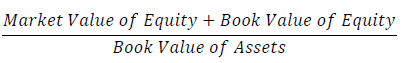 |
| Dividend Policy Is a corporate decision-making related to net income allocation from company’s operating activities to be distributed in form of dividends to shareholders or to be held as retained earnings | Dividend Pay Out Ratio (DPR) | 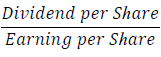 |
| Exogenous Variables | ||
| Financial Leverage Is firm’s ability to use fixed financial obligations in order to maximize profit change on per share income of common stock. | Leverage (DA) | 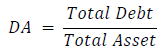 |
| Profitability Is a management effectiveness of firm in creating financial returns | Return on Asset (ROA) | 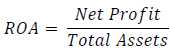 |
| Firm Size Is a measure of the amount of total wealth owned by the company to show a firm development within business | SIZE |  |
| Investment Opportunity Is an investment decision in form of a combination of asset in place and future investment options in a profitable project |
Investment |  |
Source: Stock Exchange of Thailand
Path Analysis
Based on research objectives, conceptual framework and research hypothesis, it appears that the relationship between whole variables of this research suggest a causal and recursive relationship. Therefore, this research used path analysis to know and analyze the influence of exogenous variables on endogenous variables. Hair, Black, Babin, and Anderson (2009) states that there are four steps that must be taken to use this path analysis, namely: 1) developing a model, which must be done based on theory; 2) developing a path diagram to show causality; 3) the conversion of line diagrams into a series structural equations and measurement model specifications; and 4) the selection of the input matrix and the estimation technique of the built model. In this study, it can be arranged a structural model with two step function equations that can be formulated as follows.
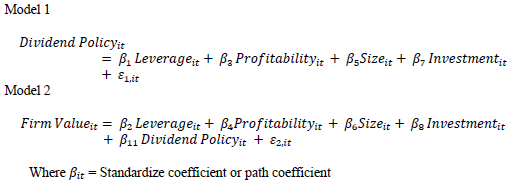
Where = Standardize coefficient or path coefficient

Figure 1 Research model
Results and Discussion
Table 3 shows significance of results obtained for each variable relationships or hypotheses across different sectors in the Stock Exchange of Thailand. The coefficient and predicted sign determine relationship between explanatory and dependent variable while p-value and description – accept or reject – indicate statistical significance at 5% significant level in each hypothesis tested. The notable results will be selected and further discussed later.
| Table 3 Hypothesis testing results |
|||||||
|---|---|---|---|---|---|---|---|
| Hypothesis | Coefficient | S.E. | P Value | Predicted Sign | Description | ||
| Non-Financial Companies | |||||||
| 1 Financial Leverage | |||||||
| DA | → | DPR | -0.017 | 0.010 | 0.077 | Negative | Accept |
| DA | → | TobinsQ | -0.091 | 0.009 | 0.000 | Positive | Reject |
| 2. Profitablity | |||||||
| ROA | → | DPR | 0.089 | 0.009 | 0.000 | Positive | Accept |
| ROA | → | TobinsQ | 0.405 | 0.007 | 0.000 | Positive | Accept |
| 3. Firm Size | |||||||
| Firm Size | → | DPR | 0.034 | 0.009 | 0.000 | Positive | Accept |
| Firm Size | → | TobinsQ | -0.086 | 0.008 | 0.000 | Positive | Reject |
| 4. Investment Opportunity | |||||||
| Investment | → | DPR | -0.016 | 0.009 | 0.061 | Negative | Accept |
| Investment | → | TobinsQ | 0.025 | 0.008 | 0.001 | Positive | Accept |
| 5. Dividend Policy | |||||||
| DPR | → | TobinsQ | 0.020 | 0.008 | 0.009 | Positive | Accept |
| Agro & Food Industry | |||||||
| 1 Financial Leverage | |||||||
| DA | → | DPR | -0.027 | 0.028 | 0.322 | Negative | Reject |
| DA | → | TobinsQ | -0.281 | 0.023 | 0.000 | Positive | Reject |
| 2. Profitablity | |||||||
| ROA | → | DPR | 0.074 | 0.025 | 0.004 | Positive | Accept |
| ROA | → | TobinsQ | 0.336 | 0.021 | 0.000 | Positive | Accept |
| 3. Firm Size | |||||||
| Firm Size | → | DPR | 0.039 | 0.028 | 0.156 | Positive | Reject |
| Firm Size | → | TobinsQ | -0.015 | 0.025 | 0.552 | Positive | Reject |
| 4. Investment Opportunity | |||||||
| Investment | → | DPR | -0.063 | 0.025 | 0.011 | Negative | Accept |
| Investment | → | TobinsQ | 0.057 | 0.022 | 0.010 | Positive | Accept |
| 5. Dividend Policy | |||||||
| DPR | → | TobinsQ | 0.028 | 0.022 | 0.214 | Positive | Reject |
| Hypothesis | Coefficient | S.E. | P Value | Predicted Sign | Description | ||
| Consumer Products | |||||||
| 1 Financial Leverage | |||||||
| DA | → | DPR | -0.030 | 0.034 | 0.374 | Negative | Reject |
| DA | → | TobinsQ | -0.103 | 0.030 | 0.001 | Positive | Reject |
| 2. Profitablity | |||||||
| ROA | → | DPR | 0.128 | 0.034 | 0.000 | Positive | Accept |
| ROA | → | TobinsQ | 0.422 | 0.027 | 0.000 | Positive | Accept |
| 3. Firm Size | |||||||
| Firm Size | → | DPR | 0.007 | 0.034 | 0.831 | Positive | Reject |
| Firm Size | → | TobinsQ | -0.142 | 0.030 | 0.000 | Positive | Reject |
| 4. Investment Opportunity | |||||||
| Investment | → | DPR | -0.021 | 0.034 | 0.538 | Negative | Reject |
| Investment | → | TobinsQ | -0.055 | 0.030 | 0.072 | Positive | Reject |
| 5. Dividend Policy | |||||||
| DPR | → | TobinsQ | 0.004 | 0.030 | 0.890 | Positive | Reject |
| Industrials | |||||||
| 1 Financial Leverage | |||||||
| DA | → | DPR | -0.032 | 0.025 | 0.203 | Negative | Reject |
| DA | → | TobinsQ | -0.078 | 0.022 | 0.000 | Positive | Reject |
| 2. Profitablity | |||||||
| ROA | → | DPR | 0.139 | 0.025 | 0.000 | Positive | Accept |
| ROA | → | TobinsQ | 0.415 | 0.020 | 0.000 | Positive | Accept |
| 3. Firm Size | |||||||
| Firm Size | → | DPR | 0.001 | 0.022 | 0.979 | Positive | Reject |
| Firm Size | → | TobinsQ | -0.186 | 0.018 | 0.000 | Positive | Reject |
| 4. Investment Opportunity | |||||||
| Investment | → | DPR | 0.005 | 0.022 | 0.805 | Negative | Reject |
| Investment | → | TobinsQ | 0.033 | 0.019 | 0.077 | Positive | Accept |
| 5. Dividend Policy | |||||||
| DPR | → | TobinsQ | 0.063 | 0.019 | 0.001 | Positive | Accept |
| Hypothesis | Coefficient | S.E. | P Value | Predicted Sign | Description | ||
| Property & Construction | |||||||
| 1 Financial Leverage | |||||||
| DA | DPR | -0.039 | 0.020 | 0.048 | Negative | Accept | |
| DA | → | TobinsQ | -0.250 | 0.016 | 0.000 | Positive | Reject |
| 2. Profitablity | |||||||
| ROA | → | DPR | 0.098 | 0.019 | 0.000 | Positive | Accept |
| ROA | → | TobinsQ | 0.411 | 0.014 | 0.000 | Positive | Accept |
| 3. Firm Size | |||||||
| Firm Size | → | DPR | 0.075 | 0.019 | 0.000 | Positive | Accept |
| Firm Size | → | TobinsQ | -0.183 | 0.016 | 0.000 | Positive | Reject |
| 4. Investment Opportunity | |||||||
| Investment | → | DPR | 0.013 | 0.018 | 0.489 | Negative | Reject |
| Investment | → | TobinsQ | 0.026 | 0.015 | 0.079 | Positive | Accept |
| 5. Dividend Policy | |||||||
| DPR | → | TobinsQ | 0.045 | 0.015 | 0.003 | Positive | Accept |
| Resources | |||||||
| 1 Financial Leverage | |||||||
| DA | → | DPR | -0.028 | 0.026 | 0.286 | Negative | Reject |
| DA | → | TobinsQ | -0.151 | 0.024 | 0.000 | Positive | Reject |
| 2. Profitablity | |||||||
| ROA | → | DPR | 0.060 | 0.026 | 0.021 | Positive | Accept |
| ROA | → | TobinsQ | 0.175 | 0.024 | 0.000 | Positive | Accept |
| 3. Firm Size | |||||||
| Firm Size | → | DPR | 0.014 | 0.027 | 0.603 | Positive | Reject |
| Firm Size | → | TobinsQ | -0.208 | 0.024 | 0.000 | Positive | Reject |
| 4. Investment Opportunity | |||||||
| Investment | → | DPR | -0.023 | 0.025 | 0.365 | Negative | Reject |
| Investment | → | TobinsQ | 0.124 | 0.024 | 0.000 | Positive | Accept |
| 5. Dividend Policy | |||||||
| DPR | → | TobinsQ | 0.004 | 0.024 | 0.853 | Positive | Reject |
| Hypothesis | Coefficient | S.E. | P Value | Predicted Sign | Description | ||
| Services | |||||||
| 1 Financial Leverage | |||||||
| DA | → | DPR | -0.044 | 0.021 | 0.036 | Negative | Accept |
| DA | → | TobinsQ | -0.003 | 0.018 | 0.881 | Positive | Reject |
| 2. Profitablity | |||||||
| ROA | → | DPR | 0.107 | 0.020 | 0.000 | Positive | Accept |
| ROA | → | TobinsQ | 0.552 | 0.014 | 0.000 | Positive | Accept |
| 3. Firm Size | |||||||
| Firm Size | → | DPR | 0.041 | 0.020 | 0.041 | Positive | Accept |
| Firm Size | → | TobinsQ | -0.032 | 0.017 | 0.057 | Positive | Reject |
| 4. Investment Opportunity | |||||||
| Investment | → | DPR | -0.011 | 0.018 | 0.559 | Negative | Reject |
| Investment | → | TobinsQ | -0.014 | 0.015 | 0.356 | Positive | Reject |
| 5. Dividend Policy | |||||||
| DPR | → | TobinsQ | 0.008 | 0.015 | 0.618 | Positive | Reject |
| Technology | |||||||
| 1 Financial Leverage | |||||||
| DA | → | DPR | 0.014 | 0.035 | 0.686 | Negative | Reject |
| DA | → | TobinsQ | 0.035 | 0.031 | 0.245 | Positive | Reject |
| 2. Profitablity | |||||||
| ROA | → | DPR | 0.053 | 0.035 | 0.137 | Positive | Reject |
| ROA | → | TobinsQ | 0.484 | 0.028 | 0.000 | Positive | Accept |
| 3. Firm Size | |||||||
| Firm Size | → | DPR | 0.077 | 0.030 | 0.010 | Positive | Accept |
| Firm Size | → | TobinsQ | 0.072 | 0.026 | 0.006 | Positive | Accept |
| 4. Investment Opportunity | |||||||
| Investment | → | DPR | -0.011 | 0.028 | 0.690 | Negative | Reject |
| Investment | → | TobinsQ | -0.032 | 0.024 | 0.185 | Positive | Reject |
| 5. Dividend Policy | |||||||
| DPR | → | TobinsQ | -0.009 | 0.024 | 0.697 | Positive | Reject |
| Optional | |||||||
| other (Consumer Products + Resource + Services + Technology) | |||||||
| 1 Financial Leverage | |||||||
| DA | → | DPR | -0.004 | 0.013 | 0.780 | Negative | Reject |
| DA | → | TobinsQ | -0.029 | 0.012 | 0.016 | Positive | Reject |
| 2. Profitablity | |||||||
| ROA | → | DPR | 0.084 | 0.013 | 0.000 | Positive | Accept |
| ROA | → | TobinsQ | 0.440 | 0.010 | 0.000 | Positive | Accept |
| 3. Firm Size | |||||||
| Firm Size | → | DPR | 0.026 | 0.013 | 0.046 | Positive | Reject |
| Firm Size | → | TobinsQ | -0.087 | 0.012 | 0.000 | Positive | Reject |
| 4. Investment Opportunity | |||||||
| Investment | → | DPR | -0.017 | 0.012 | 0.168 | Negative | Reject |
| Investment | → | TobinsQ | 0.008 | 0.011 | 0.445 | Positive | Reject |
| 5. Dividend Policy | |||||||
| DPR | → | TobinsQ | 0.007 | 0.011 | 0.519 | Positive | Reject |
H1a: Financial leverage negatively affect dividend policy
According to Table 3, financial leverage shows significant negative effect in non-financial, property & construction, and services sectors with coefficient -0.017, -0.039, and 0.044, respectively. In contrast, other sectors; namely, agro & food industry, consumer products, industrials, resources, and technology have no effect on dividend policy and thus reject such hypothesis. The results show that companies in the Stock Exchange of Thailand are consistent with the agency theory in a selected sectors in which firms attempt to reduce agency problem by increasing financial leverage.
H2a: Financial leverage has a positive effect on firm value
Table 3 shows that non-financial public companies listed in the Stock Exchange of Thailand has no effect of financial leverage on firm value, hence, hypothesis 2a was rejected in all sectors. It is quite noteworthy that debt creation has significance on firm value reflected from the P value in all sectors studied despite the opposite predicted sign. This means that, for companies listed in the Stock Exchange of Thailand, financial leverage has significant negative effect on firm value, which is contrast to the suggested hypothesis.
H1b: Profitability has a positive effect on dividend policy
Other than technology sector, companies in the Stock Exchange of Thailand show a positive relationship between profitability and dividends and thus accept hypothesis 1b. The results were consistent with the suggested hypothesis and previous literatures that profitability is a significant determinant of dividends. That is, profitability is a measurement that signals company’s ability to utilize its own assets and generate returns, and thus affecting dividend payout.
H2b: Profitability has a positive effect on firm value
Table 3 shows that companies in all non-financial sectors has significant positive effect of profitability on firm value. Thereby, hypothesis 2b was accepted in all cases. Profitability has a signaling effect on firm value in which high profitable companies are seen to be positive signal to investors and thus having positive effect on its firm value.
H1c: Firm size has a positive effect on dividend policy
Listed firms in non-financial, property & construction, services and technology sectors shows that firm size has a positive effect on dividends. Hence, hypothesis 1c was accepted in such sectors. On the contrary, agro & food industry, consumer products, industrials, and resources prove no effect of firm size on dividend policy and thus reject such hypothesis.
H2c: Firm size has a positive effect on firm value
Technology sector is the only sector that shows positive effects of firm size on firm value and thus accept hypothesis 2c. On the contrary, other sectors including non-financial companies, agro & food industry, consumer products, industrials, property & construction, resources, and services prove that their sizes do not affect firm values.
H1d: Investment opportunity negatively affects dividend policy
Table 3 shows that investment opportunity has significant effect on dividend policy in firms in non-financial companies and agro & food industry. Thus, hypothesis 1d is accepted in these two sectors. The underlying theory of relationship between investment opportunity and dividends is pecking order theory where high investment opportunities cause firms to withhold income or decrease proportion of dividend distributed to stockholders (Rizqia, Aisjah & Sumiati, 2013).
H2d: Investment opportunity has a positive effect on firm value
Table 3 shows that investment opportunity positively affects firm value of firms in non-financial, agro & food industry, industrials, property & construction, and resources sectors. Therefore, hypothesis 2d was accepted. Investment opportunity is one indication of growth potential that a company can generate returns in the future. Hence, it is directly related to the firm objective to maximize firm value. In addition, signaling theory also suggests the positive relationship between investment opportunity and firm value.
H3: Dividend policy has a positive effect on firm value
Firms listed in non-financial, industrials, and property & construction sectors show that dividend policy has a significant positive effect on firm value and thus accept hypothesis 3. Information asymmetry is underlying theory of relationship between dividends and firm value (Rizqia, Aisjah & Sumiati, 2013). That is, there exists information mismatch between investors and management; hence, any policy made can reflect information concerning condition and company performance. In addition, signaling theory caused by the asymmetric information between investor and management also suggest positive relationship between dividend policy and firm value.
Using path analysis, Table 4 summarizes indirect effect of four exogenous variable: namely, financial leverage, profitability, firm size, and investment opportunity, on dividend policy and on firm value. The coefficient and predicted sign determine relationship between exogenous variable and dependent variable: dividend policy and firm value, while p-value and description – accept or reject – indicate statistical significance at 5% significant level in each hypothesis tested. The notable results will be selected and further discussed later.
Table 4: Indirect Effect Hypothesis Testing Results
| Table 4 Indirect effect hypothesis testing results |
|||||||||
|---|---|---|---|---|---|---|---|---|---|
| Hypothesis | Coefficient | S.E. | P Value | Predicted Sign | Description | ||||
| Non-financial companies | |||||||||
| 1 Financial Leverage | |||||||||
| DA | → | DPR | → | TobinsQ | -1.669 | 1.143 | 0.144 | Positive | Reject |
| 2. Profitablity | |||||||||
| ROA | → | DPR | → | TobinsQ | 0.189 | 0.075 | 0.012 | Positive | Accept |
| 3. Firm Size | |||||||||
| Firm Size | → | DPR | → | TobinsQ | 0.506 | 0.239 | 0.034 | Positive | Accept |
| 4. Investment Opportunity | |||||||||
| Investment | → | DPR | → | TobinsQ | -5.291 | 3.487 | 0.129 | Positive | Reject |
| Agro & Food industry | |||||||||
| 1 Financial Leverage | |||||||||
| DA | → | DPR | → | TobinsQ | -4.639 | 5.989 | 0.439 | Positive | Reject |
| 2. Profitablity | |||||||||
| ROA | → | DPR | → | TobinsQ | 0.202 | 0.177 | 0.253 | Positive | Reject |
| 3. Firm Size | |||||||||
| Firm Size | → | DPR | → | TobinsQ | 0.969 | 1.038 | 0.350 | Positive | Reject |
| 4. Investment Opportunity | |||||||||
| Investment | → | DPR | → | TobinsQ | -35.617 | 31.912 | 0.264 | Positive | Reject |
| Consumer products | |||||||||
| 1 Financial Leverage | |||||||||
| DA | → | DPR | → | TobinsQ | -0.495 | 3.637 | 0.892 | Positive | Reject |
| 2. Profitablity | |||||||||
| ROA | → | DPR | → | TobinsQ | 0.052 | 0.381 | 0.890 | Positive | Reject |
| 3. Firm Size | |||||||||
| Firm Size | → | DPR | → | TobinsQ | 0.024 | 0.206 | 0.908 | Positive | Reject |
| 4. Investment Opportunity | |||||||||
| Investment | → | DPR | → | TobinsQ | -1.489 | 11.074 | 0.893 | Positive | Reject |
| Hypothesis | Coefficient | S.E. | P Value | Predicted Sign | Description | ||||
| Industrials | |||||||||
| 1 Financial Leverage | |||||||||
| DA | → | DPR | → | TobinsQ | -4.981 | 4.189 | 0.234 | Positive | Reject |
| 2. Profitablity | |||||||||
| ROA | → | DPR | → | TobinsQ | 0.580 | 0.204 | 0.004 | Positive | Accept |
| 3. Firm Size | |||||||||
| Firm Size | → | DPR | → | TobinsQ | 0.018 | 0.688 | 0.979 | Positive | Reject |
| 4. Investment Opportunity | |||||||||
| Investment | → | DPR | → | TobinsQ | 4.428 | 17.998 | 0.806 | Positive | Reject |
| Property & Construction | |||||||||
| 1 Financial Leverage | |||||||||
| DA | → | DPR | → | TobinsQ | -7.679 | 4.644 | 0.098 | Positive | Reject |
| 2. Profitablity | |||||||||
| ROA | → | DPR | → | TobinsQ | 0.396 | 0.153 | 0.010 | Positive | Accept |
| 3. Firm Size | |||||||||
| Firm Size | → | DPR | → | TobinsQ | 1.979 | 0.832 | 0.017 | Positive | Accept |
| 4. Investment Opportunity | |||||||||
| Investment | → | DPR | → | TobinsQ | 8.282 | 12.291 | 0.500 | Positive | Reject |
| Resources | |||||||||
| 1 Financial Leverage | |||||||||
| DA | → | DPR | → | TobinsQ | -0.499 | 2.741 | 0.856 | Positive | Reject |
| 2. Profitablity | |||||||||
| ROA | → | DPR | → | TobinsQ | 0.017 | 0.093 | 0.854 | Positive | Reject |
| 3. Firm Size | |||||||||
| Firm Size | → | DPR | → | TobinsQ | 0.025 | 0.145 | 0.862 | Positive | Reject |
| 4. Investment Opportunity | |||||||||
| Investment | → | DPR | → | TobinsQ | -0.844 | 4.664 | 0.856 | Positive | Reject |
| Services | |||||||||
| 1 Financial Leverage | |||||||||
| DA | → | DPR | → | TobinsQ | -2.572 | 5.309 | 0.628 | Positive | Reject |
| 2. Profitablity | |||||||||
| ROA | → | DPR | → | TobinsQ | 0.115 | 0.231 | 0.620 | Positive | Reject |
| 3. Firm Size | |||||||||
| Firm Size | → | DPR | → | TobinsQ | 0.322 | 0.666 | 0.628 | Positive | Reject |
| 4. Investment Opportunity | |||||||||
| Investment | → | DPR | → | TobinsQ | -1.397 | 3.684 | 0.705 | Positive | Reject |
| Technology | |||||||||
| 1 Financial Leverage | |||||||||
| DA | → | DPR | → | TobinsQ | -0.430 | 1.535 | 0.779 | Positive | Reject |
| 2. Profitablity | |||||||||
| ROA | → | DPR | → | TobinsQ | -0.040 | 0.106 | 0.707 | Positive | Reject |
| 3. Firm Size | |||||||||
| Firm Size | → | DPR | → | TobinsQ | -0.519 | 1.351 | 0.701 | Positive | Reject |
| 4. Investment Opportunity | |||||||||
| Investment | → | DPR | → | TobinsQ | 1.910 | 6.860 | 0.781 | Positive | Reject |
| Optional other (Consumer products + resource + services + technology) |
|||||||||
| Technology | |||||||||
| 1 Financial Leverage | |||||||||
| DA | → | DPR | → | TobinsQ | -0.143 | 0.558 | 0.798 | Positive | Reject |
| 2. Profitablity | |||||||||
| ROA | → | DPR | → | TobinsQ | 0.066 | 0.103 | 0.521 | Positive | Reject |
| 3. Firm Size | |||||||||
| Firm Size | → | DPR | → | TobinsQ | 0.145 | 0.236 | 0.540 | Positive | Reject |
| 4. Investment Opportunity | |||||||||
| Investment | → | DPR | → | TobinsQ | -1.879 | 3.217 | 0.559 | Positive | Reject |
- Indirect effect of financial leverage on dividend policy and on firm value
Table 4 shows that there is no indirect effect of financial leverage on dividend policy and on firm value.
- Indirect effect of profitability on dividend policy and on firm value
Table 4 show that there exists indirect effect of profitability on dividend policy and on firm value of firms in non-financial, industrials, and property & construction sectors.
- Indirect effect of firm size on dividend policy and on firm value
Firms in non-financial and property & construction are only two sector that have indirect effects of firm size on dividend policy and on firm value.
- Indirect effect of investment opportunity on dividend policy and on firm value
Table 4 shows that there is no indirect effect of investment opportunity on dividend policy and on firm value.
Conclusion
The research studies determinant factors in firm’s decision-making process of dividend policy and attempt of firm value maximizing in non-financial companies listed in the Stock Exchange of Thailand. The explanatory factors included in this study are financial leverage, profitability, firm size, and investment opportunity. In addition, the research also takes into considerations idiosyncratic nature of firms in different sector in which analysis in non-financial listed companies are categorized into sectors including agro & food industry, consumer products, industrials, property & construction, resources, services, and technology.
Results from the study show that financial leverage has a negative effect on dividend policy in certain industries: namely, non-financial, property & construction, and services. On the contrary, there exists no positive effect of financial leverage on firm value of companies in the Stock Exchange of Thailand. For profitability, almost all sectors show a positive relationship between profitability and dividends. Meanwhile, positive influence of profitability on firm value is proven in all industries. Firm size and investment opportunity, on the other hand, has influence on dividend policy and firm value of firms in Thai stock market only in certain sectors. Dividend policy has a positive effect on firm value based on the asymmetric and signaling theory is also proven in the companies listed in certain sectors in the Stock Exchange of Thailand as well. This study using path analysis also provides indirect effect result of explanatory variables on dividend policy and on firm value. The results suggest that there exists no indirect effect of both financial leverage and investment opportunity on dividend policy and on firm value. Meanwhile, the indirect effects of profitability and firm size on dividend policy and firm value are proven in certain sectors.
References
Abor, J., & Bokpin, G.A. (2010). Investment opportunities, corporate finance, and dividend payout policy: evidence from emerging markets. Studies in Economics and Finance, 27(3), 180–194.
Crossref, GoogleScholar, Indexed at
Aivazian, V., Booth, L., & Cleary, S. (2003). Do emerging market firms follow different dividend policies from U.S. firms?The Journal of Financial Research, XXVI(3).
Crossref, GoogleScholar, Indexed at
Baker, H.K., Farrelly, G.E., & Edelman, R.B. (1985). A survey of management views on dividend policy. Financial Management, 14(3), 78–84.
Crossref, GoogleScholar, Indexed at
Baker, H.K., & Powell, G.E. (1999). How corporate managers view dividend policy. Quarterly Journal of Business and Economics, 38(2), 17–35.
Cheng, M.-C., & Tzeng, Z.-C. (2011). The effect of leverage on firm value and how the firm financial quality influence on this effect. World Journal of Management, 3(2), 30–53.
Crutchley, C.E., & Hansen, R.S. (1989). A test of the agency theory of managerial ownership, corporate leverage, and corporate dividends. Financial Management, 18(4), 36–46.
Davies, J.R., Hillier, D., & McColgan, P. (2005). Ownership structure, managerial behavior and corporate value. Journal of Corporate Finance, 645–660.
Crossref, GoogleScholar, Indexed at
Davilas, A. (2009). The impact of dividend initiations on Greek listed firms’ wealth and volatility across information environments. Managerial Finance, 531–543.
Crossref, Indexed at, GoogleScholar
Dewi, H., Iskandar, D., & Lumbantobing, R. (2020). The mediating effect of enterprise risk management on the determinant factors of firm value. Advance in Economics, Business and Management Research, 174, 513–519.
Crossref, GoogleScholar, Indexed at
Fama, E.F., & French, K.R. (1998). Taxed, financing decisions, and firm value. The Journal of Finance, 53(3), 819–843.
Crossref, GoogleScholar, Indexed at
Handriani, E., & Robiyanto, R. (2018). Corporate finance and firm value in the Indonesian manufacturing companies. International Research Journal of Business Studies, 11(2), 113–127.
Crossref, GoogleScholar, Indexed at
Haryono, U., & Iskandar, R. (2015). Corporate social performance and firm value. International Journal of Business and Management Invention, 4(11), 69–75.
Ifadah, A.Z., & Witiastuti, R.S. (2021). Investment opportunity set and dividend policy: An evidence in Indonesia manufacturing sector. Management Analysis Journal, 10(2).
Iturriaga, F.L., & Sanz, J.A.R. (2001). Ownership structure, corporate value and firm investment: a simultaneous equations analysis of Spanish companies. Journal of Management and Governance, 5, 179–204.
Jensen, G.R., Solberg, D.P., & Zorn, T.S. (1992). Simultaneous determination of insider ownership, debt, and dividend policies. The Journal of Financial and Quantitative Analysis, 27(2), 247–262.
Crossref, GoogleScholar, Indexed at
Jensen, M.C. (1986). Agency costs of free cash flow, corporate finance, and takeovers. The American Economic Review, 76(2), 323–329.
Crossref, GoogleScholar, Indexed at
Labhane, N.B., & Das, R.C. (2015). Determinants of dividend payout ratio: Evidence from Indian companies. Business and Economic Research, 5(2).
Crossref, GoogleScholar, Indexed at
Labhane, N.B., & Mahakud, J. (2016). Determinants of dividend policy of Indian companies: A panel data analysis. Paradigm, 20(1), 1–20.
Langsen, A.L. (1988). Dividend payout policy related to Tobin’s Q-Ratio. Financial Management, 17(4), 11–13.
Crossref, GoogleScholar, Indexed at
Lloyd, W.P., Jahera, Jr, J.S., & Page, D.E. (1985). Agency costs and dividend payout ratios. Quarterly Journal of Business and Economics, 24(3), 19–29.
Crossref, GoogleScholar, Indexed at
Lumapow, L.S., & Tumiwa, R.A.F. (2017). The effect of dividend policy, firm size, and productivity to the firm value. Research Journal of Finance and Accounting, 8(22).
Crossref, GoogleScholar, Indexed at
M, H. (2019). Capital structure and firm size on firm value moderated by profitability. International Journal of Economics and Business Administration, 7(1), 174–191.
Crossref, GoogleScholar, Indexed at
N.K.A., S., & G.B., W.I. (2018). Capital structure, investment opportunity set, dividend policy and profitability as a firm value determinants. RJOAS, 9(81), 259–267.
Crossref, GoogleScholar, Indexed at
Omran, M., & Pointon, J. (2004). Dividend policy, trading characteristics and share prices: Empirical evidence from Egyptian firms. International Journal of Theoretical and Applied Finance, 7(2), 121–133.
Crossref, GoogleScholar, Indexed at
Priya, D.P.V., & Mohanasundari, D.M. (2016). Dividend policy and its impact on firm value: A review of theories and empirical evidence. Journal of Management Science and Technology, 3(3), 59–69.
Putri, V.R., & Rachmawati, A. (2017). The effect of profitability, dividend policy, debt policy, and firm age on firm value in the non-bank financial industry. Jurnal Ilnur Manajemen & Ekonomika, 10(1), 14–21.
Crossref, GoogleScholar, Indexed at
Rizqia, D.A., Aisjah, S., & Sumiati (2013). Effects of managerial ownership, financial leverage, profitability, firm size, and investment opportunity and dividend policy and firm value. Research Journal of Finance and Accounting. Published.
Setiadharma, S., & Machali, M.M. (2017). The effects of asset structure and firm size on firm value with capital structure as intervening variable. Journal of Business & Financial Affairs, 6(4).
Crossref, GoogleScholar, Indexed at
Tamimi, M., Takhtaei, N., & Malchi, F. (2014). Relationship between firm age and financial leverage with dividend policy. Asian Journal of Finance & Accounting, 6(2).
Crossref, GoogleScholar, Indexed at,
Taranto, M.A. (2002). Capital structure and market reactions to dividend initiation. Journal of Financial Economics, 5, 187–192.
Tui, S., Nurnajamuddin, M., Sufri, M., & Nirwana, A. (2017). Determinants of profitability and firm value: Evidence from Indonesian banks. IRA-International Journal of Management & Social Sciences, 07(01), 84–95.
Crossref, GoogleScholar, Indexed at
Received: 05-Jan-2022, Manuscript No. AEJ-22-10769; Editor assigned: 08-Jan-2022, PreQC No. AEJ-22-10769 (PQ); Reviewed: 21-Nov-2021, QC No. AEJ-22-10769; Revised: 28-Jan-2022, Manuscript No. AEJ-22-10769 (R); Published: 05-Feb-2022