Research Article: 2018 Vol: 17 Issue: 4
The Comparison of Development Model of Customer Lifetime Value (CLV) for Private and Public Hospitals in Makassar, Indonesia
Indrianty Sudirman, Hasanuddin University
Indahwaty Sidin, Hasanuddin University
Keywords
Customer Lifetime Value, Organization Sustainability, Public and Private Hospitals.
Introduction
Hospital industry in Indonesia has been progressing along with the issuance of various regulations and laws aimed at encouraging investment and creating better conditions for business and services of the hospital. The increase in investing hospital business and community demand on better healthcare has accelerated hospital development in Indonesia.
Dynamic environment change at both local and global levels has led to shifting paradigm in managing hospitals either public or private hospital. Hospital management is required to understand the needs and desires of consumers at which patients are positioned as a strategy in retaining hospital’s customers. Competition among hospitals in attracting consumers is no longer limited to functional attributes of products services rendered, but rather it is related to a brand or an image of customer health service. Brand equity can create value for the company and customers. Value is the key of the relationship between the consumer and company. Value Equity is defined as the objective assessment based on the perceptions of what is received by consumers. The value formed on consumers will affect the level of customer retention associated with the profitability of the customer lifetime value (Aaker, 1991).
Customer Lifetime Value (CLV) was defined about forty years ago as the value obtained at the time from future profits during the trade with the customer (Kotler, 1993). CLV has an important role in performance measurement or customer assessment, the determination of target, customer retention management and segmentation (Rust et al., 2004; Haenlein et al., 2006; Benoit and Van Den Poel, 2009). However, the development of customer lifetime value used to understand the value of retaining customers has not been widely explored. On the other hand, the retaining value of consumers as an asset of the service provider is varied for each industry. This study aims to determine the comparison of the development model of Customer Lifetime Value (CLV) in public and private hospitals in Makassar, South Sulawesi, Indonesia.
Literature Review
Customer Lifetime Value
The concept of Customer Lifetime Value (CLV) was first introduced by Blattberg and Deighton (1996) in the Harvard Business Review and since that time the concept was becoming popular. Customer lifetime value has different definitions. Gupta and Lehmann (2003) in their research defined CLV as the present value of all future profits generated from a customer. Pfeifer et al. (2004) defined customer lifetime value as the difference of income and costs incurred at the time of the occurrence of the relationship process with the customer during a certain period of time. CLV is the net profit or loss of the company for all transactions that take place between the customer and company (Jain and Singh, 2002). In some studies, CLV has a different term such as Life Time Value (LTV) (Kim et al., 2006), the customer equity and customer profitability (Jain and Singh, 2002).
Gupta et al. (2006) in Gookeh and Tarokh (2013) stated that there are several reasons the development of CLV research methods in a variety sectors, such as marketing accountability, the inefficiency of matrix finance and the improvement of information technology that allows companies to collect a customer's information.
Brand Equity
Brand Equity is a concept that emerged in the 1980s. The American Marketing Association defines a brand as “a name, term, sign, symbol, or design, or a combination all of them, which aims to identify the goods or services of one or group of sellers and differentiate from competitors”. Brand equity is the added value on products and services. Brand equity is also defined as a set of assets (assets) and obligations (liabilities) of the brand associated with a brand, name and symbol that can add or reduce the value provided by a product or service to a company or customers of the company. Aaker (1996) classifies Brand equity into brand loyalty, brand awareness, perceived quality and brand associations.
Value Equity
Value equity is the objective assessment of the customers on the usefulness of the bids based on the thoughts about the benefits then compared with the costs. Elements of value equity are quality, price and comfort. Zeithaml and Mary (2000) define value into four kinds as follow:
1. Value is low price or cheap. Consumers perceive that a product or service will be worth if you set a low or cheap price.
2. Value is everything the customer wants in products or services. The price set is not the main thing for consumers to get what they want from the product or the services received, so that the value perceived as the highest quality of products or services.
3. Value is the quality received by consumers of the price paid. Most consumers see the value of it as an exchange that is balanced between the money paid to the quality of the product or service is obtained.
4. Value is what is obtained from what is given. Finally consumers assume that all profits obtained such as money, time and effort can explain the meaning of value.
Retention Equity
Kotler & Armstrong (2008) classifies the customer life cycle consists of three main processes of customer management: customer acquisition, customer retention and customer development. Customer retention is the maintenance of a continuous business relationship with customers in long term condition. Some of the key questions that must be answered when a company implements a strategy of customer retention, such as who is the target that will be maintained, what is the strategy of customer retention that will be applied, how to measure the performance of customer retention. Customer retention is the effort to keep the customers to stay for buying the same product or service in a long time.
Conceptual Framework
Brand equity, value equity and retention equity are considered as factors that affect or can improve hospital customer lifetime value (Figure 1). Each variable will be analysed by comparing the following models at the public hospital which is represented by Hasanuddin University Hospital and private hospital is represented by Ibnu Sina Hospital.
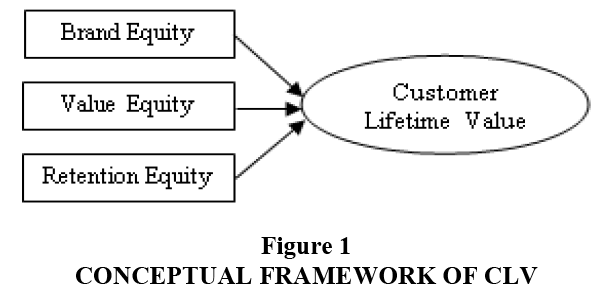
Figure 1: Conceptual Framework of CLV
Methods
This research is a quantitative research designed with analytic survey to determine the development model of CLV in public and private hospital. This research was conducted in two hospitals in the City of Makassar representing of the public and private hospitals respectively. The total number of sample in this study was 60 respondents consisting of 30 respondents for each hospital. Data was collected through interview with respondents using questionnaire instruments (Table 1).
| Table 1 Characteristics of Respondents |
||||
| Characteristics | Public Hospital | Private Hospital | ||
| n | % | n | % | |
| Age | ||||
| Teenager | 13 | 43.3 | 8 | 26.7 |
| Adult | 9 | 30.0 | 13 | 43.3 |
| Elderly | 6 | 20.0 | 7 | 23.3 |
| The Oldest | 2 | 6.7 | 2 | 6.7 |
| Gender | ||||
| Male | 7 | 23.3 | 8 | 26.7 |
| Female | 23 | 76.7 | 22 | 73.3 |
| Education | ||||
| Elementary | 2 | 6.7 | 4 | 13.3 |
| Junior high school | 0 | 0 | 2 | 6.7 |
| Senior high school | 11 | 36.7 | 7 | 23.3 |
| Diploma | 4 | 13.3 | 4 | 13.3 |
| Bachelor degree | 10 | 33.3 | 10 | 33.3 |
| Magister degree | 3 | 10 | 3 | 10.0 |
| Occupation | ||||
| Students | 11 | 36.7 | 6 | 20.0 |
| Businessman | 6 | 20.0 | 4 | 13.3 |
| Housewife | 8 | 26.7 | 10 | 33.3 |
| Civil servant | 2 | 6.7 | 4 | 13.3 |
| Farmer/fisherman | 0 | 0 | 2 | 6.7 |
| Employee | 3 | 10.0 | 4 | 13.3 |
| Status of patient | ||||
| New | 11 | 36.7 | 19 | 63.3 |
| Old | 19 | 63.3 | 11 | 36.7 |
| Number of visits | ||||
| Once | 11 | 36.7 | 19 | 63.3 |
| Twice | 8 | 26.7 | 4 | 13.3 |
| Three times | 4 | 13.3 | 5 | 16.7 |
| Four times | 4 | 13.3 | 0 | 0 |
| >four times | 3 | 10.0 | 2 | 6.7 |
| Costs incurred in one treatment | ||||
| <500.00 | 22 | 73.3 | 9 | 30.0 |
| 501.000–1.000.000 | 4 | 13.3 | 3 | 10.0 |
| 1.001.000–2.500.000 | 0 | 0 | 5 | 16.7 |
| 2.501.000-5.000.000 | 3 | 10.0 | 9 | 30.0 |
| >5.000.000 | 1 | 3.3 | 4 | 13.3 |
Results and Discussion
Respondent characteristics was categorized by age, gender, education, occupation, status of patient, number of visits and the amount of the costs incurred for the health care as illustrated in Table 1. In this study, age was categorized based on the criteria according to the Ministry of Health of the Republic of Indonesia, teenager from 17 to 25 years, adult 26-45 years old, elderly 46-65 years and the oldest age>65 years. In the public hospital, most of respondents were teenager (43.3%) while for private hospitals dominated by adults (43.3%). Productive age is more likely to dealing with the problem of traffic accidents, occupational accidents and diseases due to lifestyle. Factors pain caused the level of utilization of health services. Gender characteristic is divided into male and female. This research was dominated by women in both hospitals (76.7% and 73.3%). In general, women utilize health services more than men due to their worries. In the characteristic of education level, most respondents in public hospital were in senior high school (36.7%) and most of respondents were bachelor degree (33.3%) in private hospital; these majority respondents were considered to be capable of providing an assessment at both hospitals. Most of respondents in public hospital were students (36.7%) because the position of the hospital is located in the territory of the Hasanuddin University while most of respondents in private hospital are housewife (33.3%) since they are mostly unemployed and have free time to utilize healthcare facilities. Old patients who utilize services at the public hospital (63.3%) can be interpreted as a loyal patient utilizing health services with the amount of costs that are generally excluded by respondents in all health care treatment in hospital, public and private hospital less than 500.000. Health services are generally utilized by the respondents is the medical check-up, support services such as laboratory and radiology, polyclinics, nursing services or hospitalization, surgery, medication and BHP also in emergency room.
Model of comparison test of the CLV concept in Hasanuddin University Hospital and Ibnu Sina Hospital are illustrated in Table 2 as follow.
| Table 2 Summary Model of Hasanuddin University Hospital and Ibnu Sina Hospital |
|||||||||
| Hasanuddin University Hospital | Ibnu Sina Hospital | ||||||||
| Model | R | R Square | Adjusted R Square | Std. Error of the Estimate | Model | R | R Square | Adjusted R Square | Std. Error of the Estimate |
| 1 | 0.482 | 0.232 | 0.144 | 1.05034 | 1 | 0.256 | 0.066 | -0.042 | 1.50996 |
Table 2 shows the value of R Square 0.232, which means that brand equity, value equity and retention equity have contribution value 23.2% of Customer Lifetime Value in Hasanuddin University Hospital. While in Ibnu Sina Hospital known that value of R2 0.066 which means that brand equity, value equity and retention equity have contributions value 6.6 %.
However, all variables in Hasanuddin University Hospital do not simultaneously affect the customer lifetime value. Hasanuddin University Hospital shown in Table 3 with a significance value 0.072>0.05. Same case in Ibnu Sina Hospital in Table 4 shows that the significance value of the variable 0.613>0.05 which means that these three variables simultaneously do not affect the customer lifetime value of the hospital.
| Table 3 Statistics Analysis of the Variable in Hasanuddin University Hospital |
|||||
| Model | Sum of Squares | Df. | Mean Square | F | Sig. |
| Regression | 8.683 | 3 | 2.894 | 2.624 | 0.072 |
| Residual | 28.683 | 26 | 1.103 | ||
| Total | 37.367 | 29 | |||
| Table 4 Statistics Analysis of the Variable in Ibnu Sina Hospital |
|||||
| Model | Sum of Squares | Df | Mean Square | F | Sig. |
| Regression | 4.188 | 3 | 1.396 | 0.612 | 0.613 |
| Residual | 59.279 | 26 | 2.280 | ||
| Total | 63.467 | 29 | |||
Table 5 shows that brand equity has a significant value (0.012<0.05). Brand equity has a significant influence on the income of the hospital. With the influence of 0.414 shows a negative direction. It means that if the brand is up one point then the cost will drop by 0.414. The cost model for Hasanuddin University illustrated as follows:
| Table 5 The Result of Statistic Analysis of Hasanuddin University Hospital |
|||||
| Model | Unstandardized Coefficients | Standardized Coefficients | T | Sig. | |
| B | Std.Error | Beta | |||
| (Constant) | 0.161 | 1.187 | 0.088 | 0.931 | |
| Brand Equity | -0.414 | 0.505 | -0.164 | -0.820 | 0.012 |
| Value Equity | 0.147 | 0.337 | 0.083 | 0.436 | 0.667 |
| Retention Equaity | 0.786 | 0.289 | 0.504 | 2.716 | 0.420 |
Cost Model=0.161-0.414 (Brand)+0.147 (Value)+0.786 (Retention)+e
The results shown in Table 5 is supported by the results of the correlation test produced in Table 6 below that shows the value of the average a strong brand with low rates.
| Table 6 Statistical Analysis of Brand Equity Average Value in Hasanuddin University Hospital |
||||||
| Brand Equity Category | N | Mean | Maximum | Minimum | Deviation Standard | Sig |
| Strong | 12 | 1.182 | 2.00 | 1.00 | 0.452 | 0.030 |
| Weak | 18 | 1.778 | 5.00 | 1.00 | 1.396 | |
| Total | 30 | 1.567 | 5.00 | 1.00 | 1.135 | |
The results of this study identify that the assessment of brand equity contribute to the amount of the purchase action of the customer as the basis in determining customer lifetime value. Stahl et al. (2012) stated that brand equity and customer lifetime value are the two aspects in marketing construction, brand equity and customer lifetime value have been proven to be related each other. The study of Lonial and Raju (2015) showed that by identifying and focusing on critical attributes as part of customer relationship management program, organization can get benefit, customer satisfaction and loyalty.
Brand equity has the benefit of aspects from the customer and hospital. From the costumer perspective, brands can accelerate the purchasing process and reduce the risk of purchase, because a strong brand can create quality (Aaker, 1991). Customers also get the emotional value from the brands awakened through customer experience as stated by Kumar et al. (2014) that brand can be seen as promise and delivery of an experience from customer. From the point of view of the company, the equity of a strong brand can increase revenue, generate customer loyalty and reducing the cost of promotion (Keller, 1993). It is consistent with Mohan and Sequeira (2016) who also stated that if brand equity is managed effectively, it would improve business operational performance.
Brand equity can lead to preference and purchase intention of consumers. Since customer trust and relationship commitment determined by brand image and perceived quality, hospital management may use brand equity as the key success factor of business purposes (Lee et al., 2015). Keller (1993) in Oyner and Sukhorukova (2013) stated that besides brand equity can reduce the costs related to customer acquisition, improve customer retention and increase the profitability related to the purchase. Building brand equity is important for the future economic results (Moliner and Tena, 2016).
Furthermore Al-Bhalusi and Khan (2017) stated that even though cost of treatment is more expensive, but customer prefer private hospital for some reasons like assured of getting better treatment, believed that staff are qualified, availability of all medicine, the appearance of hospital and also the food provided is much better. That is why Chow et al. (2016) conclude that offering interactive experience can enhance brand association, ensuring a transparent operation process during treatment also contribute to enhance brand loyalty. Social media can be used as a tool to bring costumer and marketer together for successful enhancing interactive experience which leads to increasing brand equity (Pitta et al., 2016).
Table 7 shows that all variables have significance value >0.05. It means that all variables do not have a significant influence to the hospital’s income. The costs model of Ibnu Sina Hospital can be illustrated as follows:
| Table 7 The Result of Statistic Analysis of Ibnu Sina Hospital |
|||||
| Model | Unstandardized Coefficients | Standardized Coefficients | T | Sig. | |
| B | Std. Error | Beta | |||
| (Constant) | 5.597 | 2.470 | 2.266 | 0.032 | |
| Brand Equity | -0.069 | 0.448 | -0.034 | -0.153 | 0.880 |
| Value Equity | -0.208 | 0.607 | -0.068 | -0.343 | 0.735 |
| Retention Equity | -0.555 | 0.604 | -0.209 | -0.919 | 0.366 |
Costs Model=5.597-0.069 (Brand)-0.208 (Value)-0.555(Retention)+e
Conclusion
Some previous researches have been using different methods in developing models of customer lifetime value. However, there is still a lack of attention to the factors of brand equity, value equity and retention equity as a model in the development of customer lifetime value in health care institution both public and private hospitals. The results of this study shows that the variables of brand equity, value equity and retention equity of health services that created in the middle of the community have contributed in the development of customer lifetime value to the public hospital. However, brand equity has contributed a greater influence compared with the other variables in the Hasanuddin University Hospital against customer lifetime value. By contrast, in private hospitals, the third variables do not have a great influence on customer lifetime value in Ibnu Sina Hospital. The power of brand equity that created in the public hospital will push in expanding market share, reducing promotional costs, increase equity customers and be able to improve excellence competitive in the era of the development of the healthcare industry.
References
- Aaker, D.A. (1991). Managing brand equity: Capitalizing on the value of a brand name. New York: The Free Press.
- Aaker, D.A. (1996). Building strong brands. New York: The Free Press.
- Al-Bhalusi, S., & Khan, F.R. (2017). Factors influence the preference of private hospitals to public hospitals in Oman. International journal of management, innovation & entrepreneurial research, 3(2), 67-78.
- Blattberg, R.C., & Deighton, J. (1996). Manage marketing by the customer equity test. Harvard Business Review.
- Benoit, D.F., & Van Den Poel, D. (2009). Benefits of quantile regression for the analysis of customer lifetime value in a contractual setting: An application in financial services. Expert Systems with Applications, 36(7), 10475-10484.
- Chow, H.W., Ling, G.J., Yen, I.Y., & Hwang, K.P. (2016). Building brand equity through industrial tourism. Asia Pacific Management Review, 22(2), 70-79.
- Gookeh, E.M., & Tarokh, M.J. (2013). Customer lifetime value models: A literature survey. International Journal of Industrial Engineering and Production Research, 24(4), 317-338.
- Gupta, S., & Lehmann, D.R. (2003). Customers as assets. Journal of Interactive Marketing, 17(1), 9-24.
- Gupta, S., Hanssens, D., Hardie, B., Kahn, W., Kumar, V., Lin, N., Ravishanker, N., & Sriram, S. (2006). Modelling customer lifetime value. Journal of Service Research, 9(2), 139-155.
- Haenlein, K., Kalpan, A.M., & Schoder, D. (2006). Valuing the real option of abandoning unprofitable customers when calculating customer lifetime value. Journal of Marketing, 70(3), 5-20.
- Jain, D., & Singh, S.S. (2002). Customer lifetime value research in marketing: A review and future directions. Journal of Interactive Marketing, 16(2), 34-46.
- Keller, K.L. (1993). The effects of corporate branding strategies on brand equity. Advances in Customer Research, 20(1), 27.
- Kim, S.Y., Jung, T.S., Suh, E.H., & Hwang, H.S. (2006). Customer segmentation and strategy development based on customer lifetime value: A case study. Expert Systems with Applications, 31(1), 101-107.
- Kotler, P.T. (1993). Marketing management: Analysis, planning, implementation and control. The Prentice-Hall Series in Marketing.
- Kotler, P.T., & Armstrong, G. (2008). Principles of marketing. United States of America: Pearson.
- Kumar, P.N., Jacob, A., & Thota, S. (2014). Impact of healthcare marketing and branding on hospital services. International Journal of Research Foundation of Hospital & Healthcare Administration, 2(1), 19-24.
- Lee, E.J., Park, J.S., & Kim, N.Y. (2015). The effect of hospital brand equity on trust and relationship commitment of customers. The Korean Journal of Health Service Management, 9(2), 1-12.
- Lonial, S., & Raju, P.S. (2015). Impact of service attributes on customer satisfaction and loyalty in a healthcare context. Leadership in Health Services, 28(2), 149-166.
- Mohan, B.C., & Sequeira, A.H. (2016). The impact of customer-based brand equity on the operational performance of FMCG in India. IIMB Management Review, 28(1), 13-19.
- Moliner, J.R.S., & Tena, M.A.M. (2016). Customer equity and CLV in Spanish telecommunication service. Journal of Business Research, 69(10), 4694-4705.
- Oyner, K.O., & Sukhorukova, O. (2013). Marketing budget allocation: Using customer lifetime value as your guide. Journal Business Marketing Management, 1, 91-106.
- Pfeifer, P.E., Haskins, M.E., & Conroy, R.M. (2004). Customer lifetime value, customer profitability and the treatment of acquisition spending. Journal of Managerial Issues, 17(1), 11-25.
- Pitta, D.A., Patino, A., & Maddox, L. (2016). Social media influences on building brand equity. Journal of Marketing Development and Competitiveness, 10(3), 17-25.
- Rosset, S., Neumann, E., Eick, U., Vatnik, N., & Idan, Y. (2002). Customer lifetime value modelling and its use for customer retention planning. Proceedings of the eighth ACM SIGKDD international conference on Knowledge discovery and data mining.
- Rust, T.R., Lemon, K.N., & Zeithaml, V.A. (2004). Return on marketing: Using customer equity to focus marketing strategy. Journal of Marketing, 68, 109-127.
- Stahl, F., Heitmann, M., Lehmann, D.R., & Neslin, S.A. (2012). The impact of brand equity on customer acquisition, retention and profit margin. Journal of Marketing, 76(4), 44-63.
- Zeithaml, A.V., & Mary, J.B. (2000). Service marketing. Singapore: Mc Graw-Hill Companies Inc.