Research Article: 2024 Vol: 28 Issue: 3
The Behaviour of Consumers towards Subscriptions to Online Streaming Applications
Richa Pandey, Galgotias University, Greater Noida
Md. Chand Rashid, Galgotias University, Greater Noida
Citation Information: Pandey R., & Rashid Khan, MD. (2024). The behaviour of consumers towards subscriptions to online streaming applications. Academy of Marketing Studies Journal, 28(3), 1-19.
Abstract
Purpose of the Study: The study aims to analyze the behavioral elements of consumers in relation to their subscriptions to online video streaming applications. Methodology: The study conducted a regression analysis to examine the impact of factors such as ease of use, available content, social media trends, price, and demographics on the usage of online video streaming apps. Findings: Based on our investigation, we have determined the primary factors that influence internet streaming. All variables were determined to have a substantial impact on the utilization of online streaming application subscriptions. Implication: This might assist organizations in enhancing their application/product and focusing their marketing endeavours. For instance, enhance their UI to optimize user experience and minimize any usability challenges encountered while utilizing the application or website. Additionally, they have the ability to augment the quantity or calibre of their content. Offering discounts to users can attract and retain them. Utilizing digital media advertising and leveraging social media influencers can aid organizations in both retaining and acquiring additional consumers. Furthermore, it is apparent that a significant proportion of consumers belong to the millennial demographic. Therefore, corporations should prioritize targeting their advertising efforts towards this younger generation.
Keywords
Consumer Behaviour, Subscriptions, Online Streaming Applications, Theory of Planned Behaviour, Media Content.
Introduction
Online video streaming apps are gaining popularity with the world getting technologically advanced (Soni and Puthawala, 2020). As there is technical progress, consumer preferencesare also changing (Santarius and Soland, 2018). While developed countries have had easy access to the internet for a while, developing and under-developed countries are still struggling withgood internet connection before moving on to video streaming for entertainment. According to the 2019 Consumer OTT Report released by OpenX, people who are regular users of OTT, spend more time watching video content as compared todriving or spending time with friends and family (OpenX, 2019). Millennials spend more time watching OTT rather than live TV. Top content preferred by viewers is movies, followed by TV series or scripted TV shows. People who have switched to OTT also say that it is very unlikely that they would prefer cable TV or live TV over OTT anymore (Sadana and Sharma, 2021). Online video streaming apps are gaining popularity with an increasing number of content creators, content providers, smartphones, tech devices and easy availability of data.
The way people consume media is revolutionized (Ulin, 2019; Krikke, 2021). Television is being complimented as well as replaced with online video apps that provide different content. This has been appealing to millennialsand people from more developed countries. They’re being used in the entertainment as well as the education sector (Schrum, & Levin, 2009; Nawaz, 2020). Growth in the sector is also seendue to increasing digitization and customization. Consumers today can decide their media usage. They can also have a personal selection of channels and content on their OTT apps (Nijhawan and Dahiya, 2020). The online video streaming app's global market size was $42.6 billion in 2019 with an expected CAGR of 20.4% between 2020 and 2027 (Business wire, 2020). Disruptive innovations like AI are helping to improve the quality of video. This has led to an increase in the market (Strusani and Houngbonon, 2019). Technology has a crucial role in various aspects of producing, editing and uploading video. High-quality videos are produced usingAI. An increasing number of smartphones and data usage are also driving the world market (Lu and Nam, 2021). Users of smartphones globally are estimated to be 4741 mn by the year 2022 and 5136 mn by 2028 (Statista, 2023). This shows that there is a visible shift in users from desktop to mobile. It was also seen that 61 percent of people accessedtheinternet from their smartphones in the year 2018. Users spend 69 percent of their time consuming media on their mobile phones and these devices are driving close to 80 percent of the internet traffic (GSMA, 2021).
With the advent of smart phones and internet, online video streaming is gaining popularity in India. There has been a shift in the way users are consuming entertainment programs (Singh et al., 2021). India being one of the prominent market for OTT video streaming appsare becoming a trend due to easier access to internet after the advent of Jio. Starting with YouTube, more recently apps such as Netflix, Amazon Prime, HotStar have gained good number of users(Think with niche, 2020). Other channels are also going digital. In India, Zee5, Voot, Alt Balaji are also gaining prominence. According to a consultancy firm Counterpoint Research, in India 89 percent of users who consume OTT content are below the age of 35. However, the preference for the type of content varies greatly across users of different age groups and based on their geographical location (the hindu businessline., 2019). However, in general it is moreof an urban phenomenon. Maximum OTT users (55 percent) come from the topfive metro cities of India while another 36 percent come from the Tier 1 cities. The low-cost production of smart phones and affordability of internet has revolutionized the video consumption market in India (Brand Equity, 2019).
With a plethora of options available for the users, the question that intrigues us is that what are the factors that make a user choose online video streamingand whether there is a pattern in the kind of video they stream. These factors may include price paid for the entertainment, options available, ongoing socialtrends, gender, location and age. While there are papers focusing on differentiation between cable tv vs video streaming and rise of digital media, there aren’t any that lay stress on the behavior of the users that led them to switch to and/or stick with OTT. This paper tries to understand and focus on the behavioral aspects of users regarding online video streaming app subscription. PricewaterhouseCoopers (PwC), a global consultancy firm produced a report called “Global Entertainment & Media Outlook 2018-2022” wherein they mention that mobile connections in India would reach 850 million people by the year 2022, hence increasing data consumption as well. Indian video OTT services accounted for $638 million in 2018. It is expected that it would grow at 21.8 percent CAGR to reach $1.7 billion in 2023. While the growth is more prominent in urban India and among millennials, it would be interesting to figure out factors leading to this growth. India’s OTT market is expected to be the 8th largest in the world by 2023 (PWC, 2018). However, traditional TV is also growing. So, we can conclude that OTT is not replacing traditional TV buthas its own reasons of expanding. The introduction and increasing demand of streaming devices such as Google Chromecast and Amazon Fire TV have also led to a growth spurt in video consumption due to the ease of usage and combining subscription of various OTT apps in a single device. The graph belowshows the common devices that were used to stream internet video on to thetelevision screen according to internet users all over the world in the years 2018 and 2019.
For this study, a questionnaire was prepared based on the Theory of Planned Behavior. This questionnaire was administered to a variety of people across different locations in India. We restricted the sample to millennials living in metro and Tier 1 cities and below the age of 35. The answers collected from the survey were then run into regression to test our hypotheses and derive theconclusions. We will begin by analyzing the Literature review of the reportspreviously published related to this topic. We will look at our research questionand design our hypotheses on that basis. Following that, we will look at the research methodology used in this project. Then we will look at the test carriedout to test our hypotheses and the results of regression. We will further look at the implications of our research, specially from a managerial perspective based on our findings and finally conclude our report with ideas for future scope.
Literature Review
Khuong and Hiep (2014), Kang (2002) and Jacobs (1995) carried out a study in to look at consumer satisfaction with regardsto cable companies and what do they give importance to while deciding whichprovider to proceed with. Previous studies conducted by Kristensen et al. (1999) and Churchill and Suprenant in 1982 and Tse and Wilton in 1988 consisted of four attributes – performance, satisfaction, disconfirmation and expectations. Jacobs (1995) focused mainly on satisfaction. His hypotheses were based on cost, number of channelsand the subscriber base; how any of these attributes would affect satisfaction.Regression was run on the data collected. One major conclusion was that the performance of cable companies was of great importance. Hence, availability of program, reliability and customer care was important for them to gain market share. Bondad-Brown, Rice and Pearce (1992) wanted to focus on the attributes that drive the adoption of online streaming services and websites. They wanted to understand what motivates users to access online media services over traditional television. They considered age, health, economic security andgeneration in their survey. They sent their survey via email to a sample size of 500. Their research focused on many independent variables like experience with the internet, use of online video, age, activity of audience, generation anduse of media.
Cha and Chan-Olmsted (2012) conducted a research to understand if online streaming would take over traditional television. With growing technological advancement, experts were wondering whether online video streaming wouldreplace cable television. This study focused to find out whether digital media would cannibalize traditional media or complement it. They questioned users to understand their motivation to watch video content. They ran the responseson Likert Scale to understand the motives for music, video, TV programs and movies. ANOVA was used to provide results, which were varied but gave someinsights like learning and satisfaction were two factors that differentiated the users of digital media and traditional TV. The research also showed that onlinevideo streaming could be used as a substitute for cable. This research showed the similarities as well as the differences originating from cable television and digital media (Monaco, 1999).
In a study conducted in UK by Lessiter et al. (2001), and (Chen and Yao, 2022) stated that people’s attitude towards technology and media consumption were described.The attributes of digital media like computers and better TVs and the issues faced with adopting streaming video was discussed. One of the barriers was a perceived sense of easy usage. They used cluster analysis to look at theusability using different technological applications from TV to computers. In this study, they looked at a survey composed of four sections (Keogh et al., 2001), Perceived usageease, knowledge of digital TV, demographics and familiarity with technology. They used Principal Axis Factoring to conclude results from the data collected via questionnaires. According to the result, 42% people were fine with the difficulty whereas 33% felt it was very complicated. For our report, we consider“ease of use” as a factor to determine consumer behavior and their decision regarding internet video streaming.
Customers’ choice of media platforms is growing quickly (Purnomo, 2023). Kim (2016) examined patterns of media consumption across various media outlets, keeping in mind differences in the background of users. Regression analysis helped to study factor scores which decided which method of media consumption was most popular, including traditional television, digital media and newspapers. Age was concluded to be the most prominent factor in determining this. Taneja, Webster and Malthouse (2012) looked at different platforms and what content was available for the users. They also examined how customers react when they are given an abundant number of options. They used Factor analysis on data collected by recording their daily streaming behavior. There were two hypotheses formed by them. One was that program schedule mold consumption of media, the second was that customers make rational choices when consuming media. Findings from the research indicated that customers create subsets from available options and consume media from these subsets. Nielsen also conducted a similar survey with cable television in 2009 and concluded that out of all channels available to them, customers watched only 14 percent.
Lee et al. (2018) and Johnson and Reed (2005) wanted to demonstrate cable television monopoly. Cable choices were very less and it was determined by the cable companies depending on the geography of the consumer. There was a survey conducted with 1000 people in USA asking their views on competition between cable companies. Around 80 percent Americans wanted the companies to compete for their customers, as they believed that this would improve prices and services. In USA, cable prices increased by around 86 percent in the past ten years and customer satisfaction declined greatly. Cable companies became really powerful by exercising monopoly like situation. The increased prices andbad services forced the citizens to reach out to the law- making bodies to help them in this situation.
Ferreira et al. (2021) and Hibberd conducted a study in 2004 to prove that ratings are not the sole attributes to determine customer satisfaction. He tried to categorize which channels were most important to customers and how much they were willing to pay for it. A survey was conducted on customers with age greater than 18. Perception of consumers towards different channels was measured. ESPN came out to be the highest rated television channel, even though it wasn’t available on all platforms. Customers were willing to pay a high price for it. Nextin line were Discovery, History, followed by CNN and Weather. There should bea further research to see which of these high rated channels are available online on streaming platforms as compared to cable television. McCreery and Krugman came up with a questionnaire in 2015 to look at the changes in the media consumption habits and the products such as television,tablet, smart phone that allow the customers an option to view media in different ways. They conducted surveys online as well as focus group discussions. Cluster analysis was performed on the data to group different viewing devices. This offered a very interesting perspective. Their questionnaire has been referred to in preparing the questionnaire for this report.
Prince & Greenstein (2014) wanted to understand the ongoing changes in the television industry. Forrester Research was used to collect data of American households. They focused on the period between 2007 and 2009 as it is believed that during this time only a change in the way of media consumption occurred. Television subscriptions were costing too much. Peopleanyway needed internet services. So, they tried to cut their cable fees in half and use online streaming services. With the development of social TV, it became essential that we understand which users use them and for what reasons. Bautista, Lin & Theng (2016) studied ten qualitative and exploratory studies to find that consumers were showing a positive view towards socialization and using social TV, even thoughthey had concerns about their privacy and the lack of dominance. They also determined a relationship between ease of use and social influence while consumers chose a social television (Abbas Naqvi et al., 2020).
Kim et al. (2020) and Chulkov and Nizovtsev, (2015) reviewed different price categories and provided adetailed analysis of bundling of video services, their implementation and success rate. This was done after revolutionized video streaming services took prominence over traditional television. Online video streaming apps such as Netflix has changed the way people are consuming media. 61 percent consumers between the ages of 18 and 29 viewed television mainly by streaming online. As far as adults were concerned,59 percent of them used cable to view television. This data was collected in theUnited States of America. Age was concluded to be a significant factor in this research. This report, too shall look at age as an important attribute to derive conclusions of our research. According to a study conducted by LaRose and Atkin (1988), Americans gave more preference to satisfaction from their cable companies rather than cost and market differences. They analyzed 1296 responses and found out that customer satisfaction or rather dissatisfaction was the primary reason for customers to end their subscriptions.
According to Fitzgerald and Jensen (2020) during National Football League (NFL) in 2016, Feldman looked at the positionsof football fans and television viewers based on television ratings dropping. This survey was conducted by TiVo Inc. on American citizens. The results showed a loss of 4 to 18 percent viewers of NFL across different age and demographics. A number of attributes were considered like the attention spanof the viewers, interest or disinterest in live broadcast, digital technology and its social aspects, smart phones and apps including media consumption apps that may have caused a loss in this viewership. Chang & Chan-Olmsted (2010) conducted a study to prove that 5/7 hypothesesconcerning consumers’ behavior towards a particular cable company. Perceived sub-brands of the company, attitude of parent brand, fit, innovationand portfolio of brand were attributes that had a significant impact rather thanfamiliarity with the brand and channel repertoire. It was also seen than males preferred brand extension more than females, thus showing that gender also played a role. Also, with higher income, likelihood of consumer opting for brandextension decreased, showing a negative correlation.
Tse (2016) researched to show how sociability is impacting online streaming. People enjoyed online streaming but at the same time they were apprehensiveof this lowering the attachment they have with society. They believed society to be more accepting of traditional television. However, they also felt a sense of attachment while streaming videos on online platforms. This was due to tworeasons: 1. They could connect with other people having similar interest in programs that are foreign and 2. Re-bond with their home when they are consuming domestic content in a foreign land. Tse concluded that there is a positive correlation of sociability with online video streaming. According to Cox, in 2017, 50 percent Americans were planning to cut cord withcable TV due to high rates. A report by TiVo showed past years’ trend which proved that people wanted to replace cable for online video streaming. 80 percent people who had already abandoned cable television agreed that it wasdue to rising prices. 54 percent people who took this survey were Netflix users and 27 percent were Amazon Prime users.
To sum up, we see that many studies have been done on related topics and many factors have been analyzed. In all these studies, some factors are chosenbut most are not taken into consideration. Usage ease has been determined asan important attribute in one of the studies. The reasons for viewing certain content has also been discussed. Performance, reliability, value and customer satisfaction has also been looked at in different studies. One study determinedthat traditional television was used mostly for entertainment purpose whereasonline video streaming was used for learning and informational purposes. Product bundling and its impact on consumers was also studied. Gender and age were also considered as attributes in few studies. The relation with sociability was also studied. Price was identified as an important factor for customers to stick to a particular service. There wasn’t any study which combined all these factors. This research attempts to do this as well as look atother new factors that may impact online streaming app subscription and usage behavior. This report attempts to fill the gap found in the various studiesreferred to.
Why India?
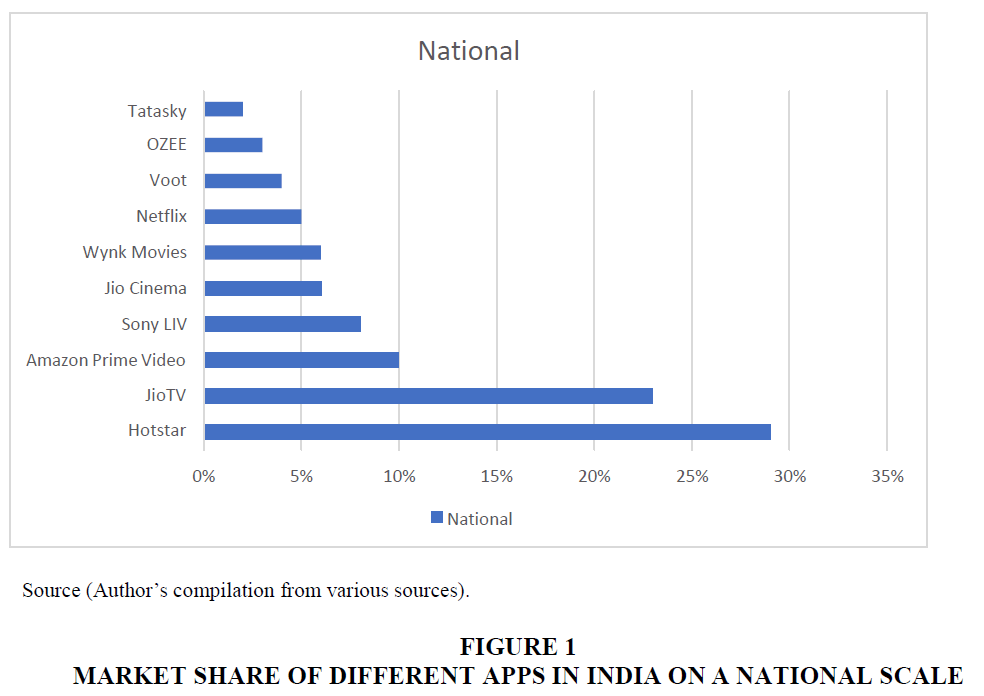
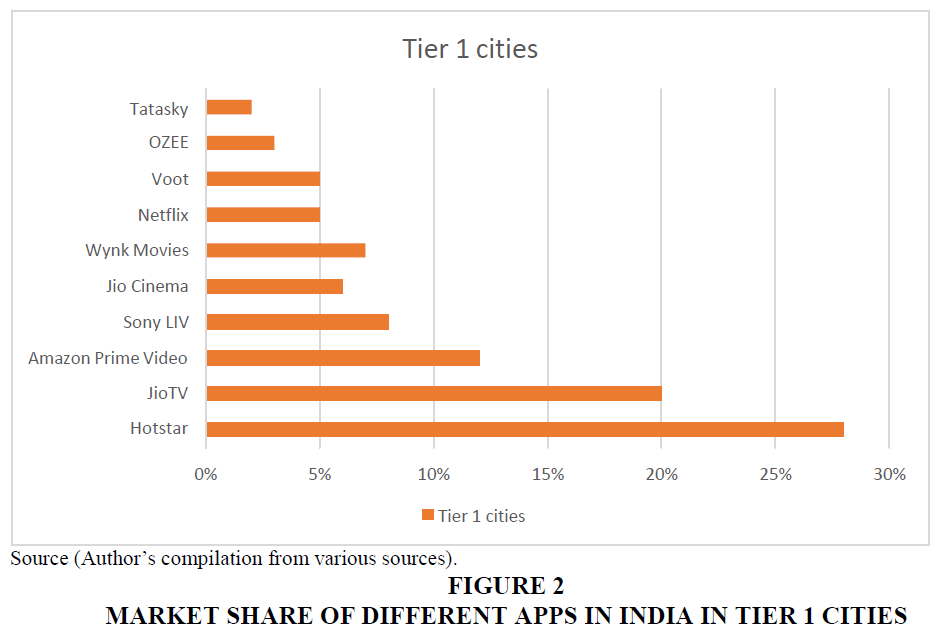
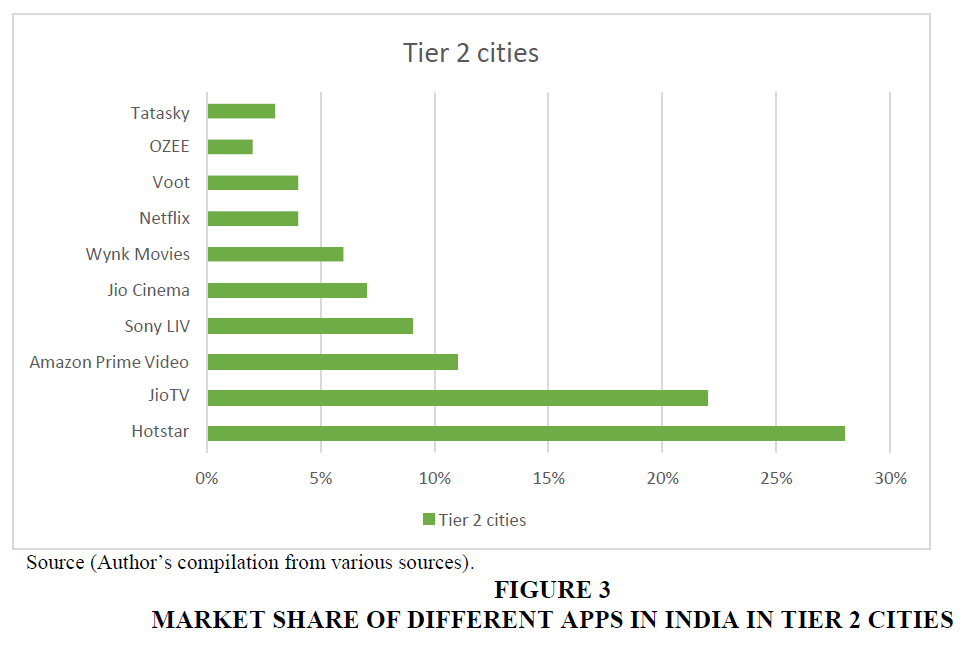
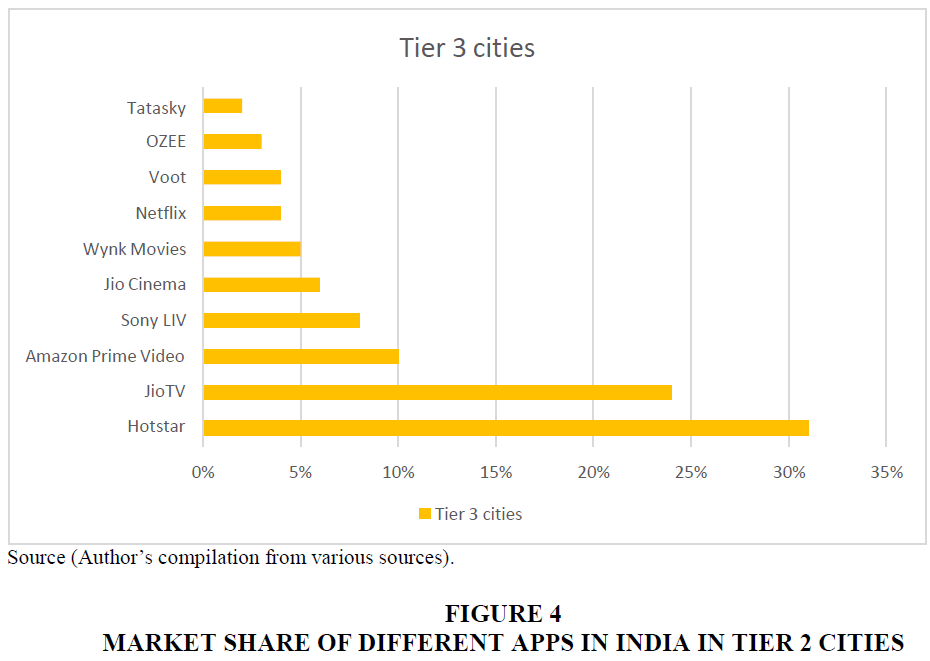
India is one of the highest growing entertainment markets on a global scale andit is expected that India will retain the momentum. It is expected that in the coming years, India will see an increase in OTT apps, online advertising and Internet gaming (Economic Times, 2023). The media and entertainment sector in India was pegged at USD 73.6 by 2028. It is set to reach USD 46207 mn in 2022 an OTT revenue surged to USD 1.8 bn in 2022 (Economic Times, 2023). The online video streaming sector is expected to reach 113 mn users by 2028, and SVOD is projected to reach USD 1.7 Bn by 2023. Itis estimated to grow at a CAGR of 11.96 percent (Statista, 2023). It is the highest driving factorof the M&E industry. Availability of data after the advent of Jio has helped this cause. Soon, 5G network is set to arrive in India, thus increasing digitization and hence incentivizing users to stream more online apps for video viewing. This will alsocreate new opportunities for business. Total revenue in this industry is expected to come from traditional television (Economic Times, 2023). Subscribers who pay forthe app subscription is likely to increase by 50 mn, whereas users who watch video for free while getting disrupted by ads is expected to reach 600 mn users (LiveMint, 2018) Let us look at the different apps’ market share in India based on their geographical locations. This data was captured by Atlas Figures 1-9.
Research Hypotheses
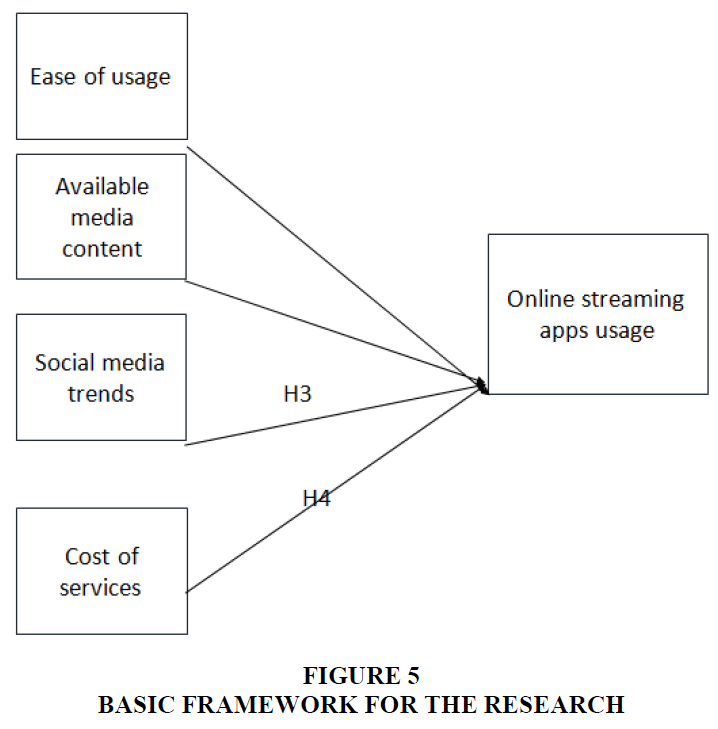
As technology continues to advance, we can see that there are issues arising alongside it. This is because previous generations are not at ease with using online video streaming options (Wu et al., 2001). They are also unwilling to try it if it is very difficult to understand. In the newer generation too, not everyone is willing tooperate these apps if they are difficult to stream (Stein, 2013). For this, companies are tryingto make really simple and easy-to-use products that the audience finds connectwith and doesn’t find complicated (Smiciklas, 2012). Kumar et al. (2021) found a positive relation between streaming video consumption and ease of usage. Consumers will be more willing to use online media consumption apps if they are easy to use. With this, we form our first hypothesis.
H1: Ease of usage and online streaming are positively related.
For consumers, the kind of content they view and the options for content andchannel that they have seem to play an important role in their online video streaming usage behaviour (Heinonen, 2011; Johnson and Woodcock, 2019). Studies have shown whichchannels were more important for customers (Furey and Friedman, 2012). There are many customers who have Hot Star subscriptions mainly for watching sports events like cricket and football (Singh and Kumar, 2023). This shows media content might influence online streaming. Thus we can state that,
H2: Available media content and online streaming are positively related.
In the present world, digital advancement has influenced consumers to consume more media, whether it is through online videos or streaming apps ordigital television (Kumar et al., 2020; Matrix, 2014). With evolving technology, devices used to view media are also becoming important. Hence, smart phones are also playing an important role in this (Gillenwater, 2017). Social media also plays an influencing role here. People see what others are watching, get their reviews and base their decisions on this (Kumar et al., 2023; Vinoi et al., 2024). According to a study by Bondad-Brown et al. (2012), a positive relation was seen between social media trends and adoption of online streaming apps. Social media may also decrease viewership through negative opinions. People consider social media as an important platform to get information on media content.
H3: Social media trends and online streaming are positively related.
Another important factor to take into consideration is the price that one needsto pay for these streaming services. Since, some of the videos on Hot Star are free, we see more viewers of Hot Star as compared to Netflix (Kumar et al., 2020) which is quite costly as per India standards. In countries like US, online streaming appsprovide much better content along with a very reasonable price as compared to their cable televisions (Ulin, 2019). However, that is not the case in India. Given that users are already comfortable with traditional television, getting them to use online streaming services is already a difficult task; but with high prices it becomes near to impossible (Smith and Telang, 2016). Therefore, we don’t see a lot of people from oldergenerations using online streaming apps. Millennials still prefer online app streaming for the content and the convenience to watch it while traveling or from anywhere that doesn’t get them glued to a single place (Kumar et al., 2022). The cost is however, an important factor for them also, given that they have a plethora ofapps available as options. So, they try to keep cost in mind while opting for a particular service.
H4: Cost of services and online streaming are negatively related.
To determine user behavior with respect to online video streaming, we also need to consider factors like age, gender, income and geographical location (Wasserman and Richmond‐Abbott, 2005). This is quite important in a country like India, where there is more viewership from Metro and Tier 1 cities as compared to Tier 2 and Tier 3 cities (Golwalkar and Mishra, 2023). Income alsodefines whether people may or may not opt for online streaming apps and if they do, then which apps do they opt for (Pittman and Sheehan, 2015). Age is already seen to be animportant factor with more millennials seeming to use these video streaming apps as compared to older generations. We use all these factors and perform statistical analysis on them (Wasserman and Richmond‐Abbott, 2005). We proposein this study that users choose to view online streaming apps based on usage ease, social media trends, content and cost. We will also look at how age, gender, income and geography influences user behavior for online video streaming apps.
Methodology
Usage of online video streaming apps is our dependent variable. Our independent variables are ease of usage, available content, social media trendsand price to be paid and demographics. We developed a questionnaire to lookat each of these variables and their role in online video streaming app usage. This questionnaire can be seen in Appendix 1. The diagram below shows a basic framework of what we will be studying further.
The questionnaire was prepared in the form of an online survey (attached in the Appendix). This questionnaire was sent to different people online and the responses were collected and analyzed. 216 people responded to the survey. The data was first divided in terms of age, gender, income and location. Ease of use was adopted from (Rauniar et al., 2014), Content availability from (Wakefield et al. 2016), Cost of services (Zainab et al., 2017), social media trends (Koay, et al. 2021)
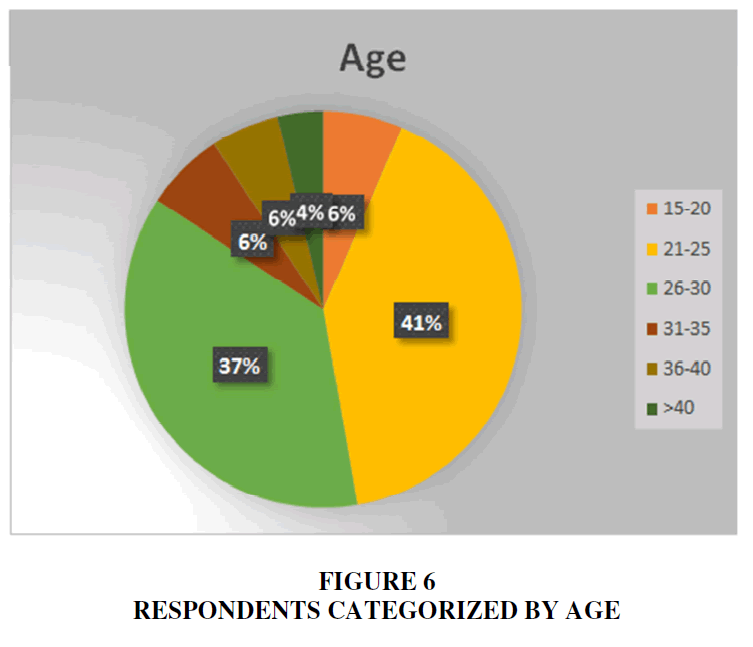
Age
Users were asked to choose the category they fall in. Age categories were largely defined as “15- 20”, “21-25”, “26-30”, “31-35”, “36-40” and “>40” years.Most of the respondents were between 21-30, which is the age of the millennials who are maximum users of online streaming apps as seen in secondary research.ults and Discussion
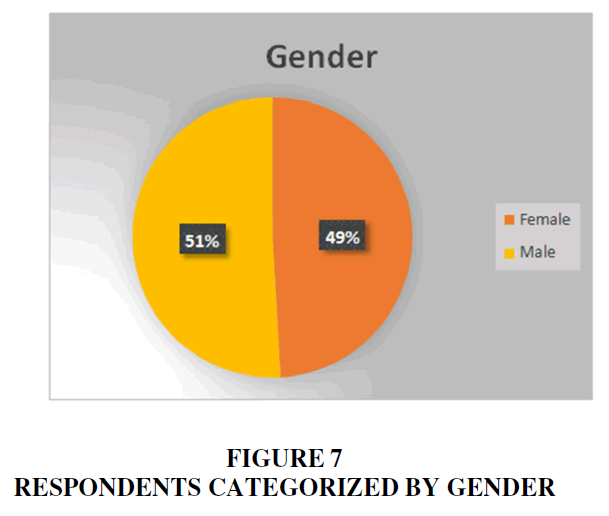
Gender
Users were asked to choose the category they fall in with respect to gender. Gender categories were largely defined as “Female”, “Male” and “Prefer not tosay”. Respondents were almost equally divided in terms of gender with 106 female respondents and 110 male respondents. No one marked “prefer not to say”.
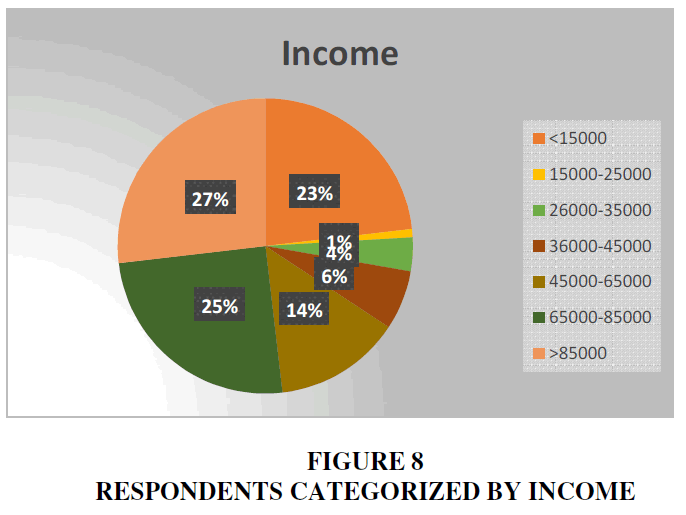
Income
Users were asked to choose the category they fall in with respect to income earned per month. Income categories were largely defined as “<15000”, “15000-25000” and “26000-35000”, “36000-45000”, “45000-65000”, “65000- 85000”, “>85000” rupees per month. Respondents fell mostly in earning >45000 rupees per month category. A chunk of respondents also fell in earning <15000 rupees per month category as this survey was also sent out in the college, where students are currently unemployed.
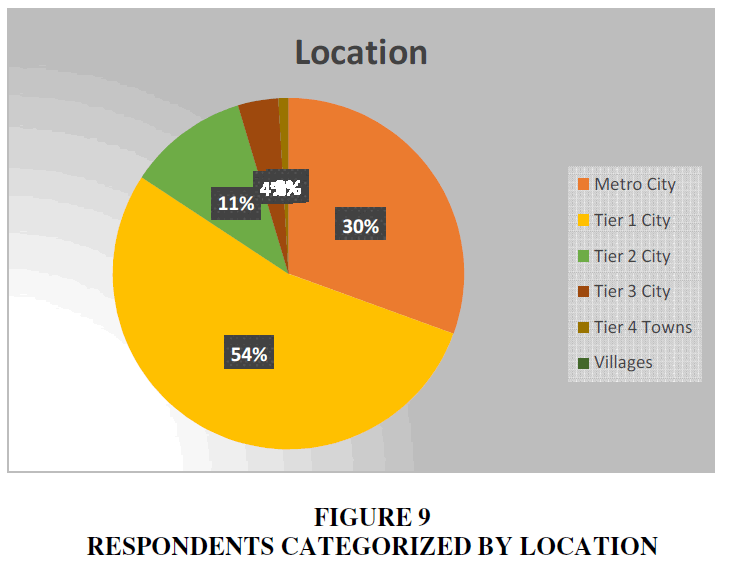
Location
Users were asked to choose the category they fall in with respect to location they currently reside in. Geographical categories were largely defined as “Metro City”, “Tier 1 City”, “Tier 2 City”, Tier 3 City”, “Tier 4 Towns”, “Villages”.Majority of respondents fell in Metro cities and Tier 1 cities. There were no responses collected from any user residing in village as it was very unlikely to locate one.
Having analysed our respondents on basis of Age, Gender, Location and Income, we proceed to analyse answers collected from them for various questions. For each of our factors, few questions were asked. The questions were on a Likert scale, which means users had to choose answers on a scale ranging from 1-5 or lowest to highest. Then, on basis of importance of the factor, they were given weightage before determining the final attributes on which to perform regression.
Data Analysis and Results
Regression was done on the data collected with the help of questionnaire. We took Online Streaming as the dependent variable. Ease of usage, Available media content, Social media trends and Cost of services were taken as independent variables. There were questions asked in the survey based on each of these factors. Based on the importance of the factor/attribute, weightswere assigned to them. These weights were used to average out the responsesreceived. Online streaming was given weightage of 5, Social media trends – 4, Ease of usage – 3, Available media content and Cost of services given a weightof 2. The importance of these factors was determined from studies done previously, mentioned in the Literature review. Weights were determined referring to previous research done in the field.
We can see from the table 1 above that the model is overall significant statistically. The value of Adjusted R Square is 0.721 which means that variancecan be explained 72.1% overall with the help of this model.
| Table 1 Regression Statistics | |
| Multiple R | 0.84934 2318 |
| R Square | 0.72138 2373 |
| Adjusted R Square | 0.71056 2271 |
| Standard Error | 0.28993 6503 |
| Observat ions | 216 |
We can see from the above table 2 that this regression predicts significantly thedependent variable. The Significance F column shows the statistic significance of the overall model. The value is less than 0.05 (with confidence interval taken as 95%). This shows that this model overall predicts significantly the outcome.Hence, the regression model is a right fit.
| Table 2 Anova | |||||
| df | SS | MS | F | Significance F | |
| Regression | 4 | 22.4182 | 5.60454 | 66.6706 | 9.99E-28 |
| Residual | 210 | 8.65851 | 0.08406 | ||
| Total | 216 | 31.0767 | |||
The above table 3 shows that all the independent variables that we had predictedhad a significant relationship with the dependent variable. All the p values areless than 0.05 (confidence interval taken as 95%), which means they all have statistic significance. Looking at this model, we can prove that Ease of usage, Available media content, Social media trends and Cost of services all impact Online streaming. Looking at the coefficients row, we see that cost of services is negative, which shows that cost of services negatively impacts online streaming, i.e., higher the cost of using online streaming apps, more thedeterrence of people from using these apps. If online streaming apps reduced their prices, more people would be willing to stream their content. Also, higherthe ease of using these apps, more traffic can be expected. Good quality and greater number of content items also attract and retain more users. Given thatthis is an age of social media, influencers and reviews also encourage or deter users from online video streaming. The results also align with the research conducted by Keogh in 2001 and Bautista in 2016 which correlated ease of usage and adopting online video streaming services. In their study also, they found a significant relation between the two. Our results also showed a positive correlation between available media content and online streaming which couldn’t be proved in thestudy done by Cha & Chan-Olmsted in 2012. Summarizing, we can say that we have looked at all these variables together tosee and prove their impact on online video streaming as opposed to studies done previously that only looked at one factor at a time.
| Table 3 Regression – Coefficient Table | ||||
| Coefficients | Standard Error | t Stat | Significant | |
| Intercept | 0.23497006 | 0.13740336 | 1.71007516 | Accepted |
| Ease of Usage | 0.48088116 | 0.07948816 | 6.04972043 | Accepted |
| Available Media Content | 0.12968888 | 0.0649069 | 1.99807561 | Accepted |
| Social Media Trends | 0.2953688 | 0.06999027 | 4.22014112 | Accepted |
| Cost of services |
- 0.18344413 | 0.08302558 | - 2.20948914 | Accepted |
Conclusion
This study shows that understanding these factors is important from a managerial point of view. Online streaming apps are spending lakhs of rupees in marketing to understand the needs of the Indian market and decide whomto target and how to best advertise their products. Through our research, we have identified the main attributes that impact online streaming. This can help companies to better their app/product and concentrate their marketing efforts. For example, make their interface better for the users, so that they have no difficulty in using the app/website. They can also increase the numberor quality of their content. Discounts for users may lure and retain them. Digitalmedia advertising and using social media influencers will also help the companies retain and gain more consumers. It is also evident that the majority of the consumers are millennials, so companies can also focus on advertising to theyounger population. Based on the findings of the research, online video streaming channels can make or alter their business models, depending on the usage behaviour of customers towards online video streaming apps.
The way consumers approach subscriptions to online streaming applications has undergone significant changes in recent years. The study would assist managers in developing a diverse range of high-quality content. Users are drawn to platforms that provide a wide range of top- notch content, such as original series, movies, documentaries, and exclusive material that cannot be found elsewhere. The presence of diverse content options greatly impacts the choices made when subscribing. Managers can improve user experience by prioritizing ease of use, ensuring content availability, managing service costs, and staying up to date with social media trends. Considerations of pricing play a crucial role in the decision-making process for subscriptions. Users carefully consider the cost of the subscription in relation to the value they receive in terms of content and features. Price increases may prompt certain users to reconsider or terminate their subscriptions. As a result, managers would have the ability to address the cost of the subscription. The managers can prioritize original content and its exclusivity. Having access to exclusive content, particularly original series or movies created by the streaming service, can greatly incentivize people to subscribe. Subscribing to access such unique content may be of interest to users. Many users choose to subscribe to multiple streaming services at the same time. The emergence of aggregation platforms that bring together various services into a single interface or combine subscriptions can have an impact on consumer decision-making. The Managers need to focus on understanding and addressing user preferences and demographics. Streaming subscriptions are influenced by the diverse preferences and behaviors of different demographics. Various factors, including age, geographic location, cultural interests, and household composition, can influence subscription choices. With the ever-evolving landscape of technology, including the widespread availability of high-speed internet and the continuous improvements in streaming quality (4K, HDR, etc.), consumer preferences is inevitably influenced. Consequently, managers must adapt and incorporate these emerging technologies into their strategies. In general, the way consumers behave when it comes to streaming subscriptions is constantly changing. It is influenced by a variety of factors such as the content available, pricing, current trends, and media content. Services that are able to adapt and cater to consumer preferences, while providing engaging content, are more likely to thrive in today's highly competitive environment.
Future Scope
Further studies could be carried out with more factors like customer service and the impact of having additional features and devices like Google Chromecast. These may or may not have a direct or indirect impact on online streaming. Theadditional factors could be studied in combination with the previous ones anda new and better model could be designed, further helping the market to come up with newer solutions to retain their old customers and gain new customers.This could help holistically explain consumer behaviour towards the usage of onlinevideo streaming services. Future research can be extended with mediating variables like behaviour intention, trust, commitment, and satisfaction to gain better insight into consumer behaviour. The studies can also include moderating variables like frequency of use, type of platform, and demographics like age, gender, and income to examine do they alter the relationship between the subscription factors and actual usage. A similar study can also be done for types of mobile application apps like mobile health, social media, and informational apps to gain a better understanding of consumer behaviour
References
Abbas Naqvi, M. H., Jiang, Y., Miao, M., & Naqvi, M. H. (2020). The effect of social influence, trust, and entertainment value on social media use: Evidence from Pakistan. Cogent Business & Management, 7(1), 1723825.
Indexed at, Google Scholar, Cross Ref
Bautista, J. R., Lin, T. T., & Theng, Y. L. (2016). How and why users use social TV systems? A systematic review of user studies. In 2016 49th Hawaii International Conference on System Sciences (HICSS) (pp. 3868-3877). IEEE.
Bondad-Brown, B. A., Rice, R. E., & Pearce, K. E. (2012). Influences on TV viewing and online user-shared video use: Demographics, generations, contextual age, media use, motivations, and audience activity. Journal of Broadcasting & Electronic Media, 56(4), 471-493.
Brand Equity (2019). Top 5 metro cities account for 55% of the total video OTT users, while Tier I cities account for 36% of the users: Survey.
Businessline. (2019). Young Indians driving OTT video content platforms.
Businesswire. (2020). Global Video Streaming Market Forecast to Reach USD 184.3 Billion by 2027, Registering a CAGR of 20.4% - ResearchAndMarkets.com.
Cha, J. &.-O. (2012). Substitutability between online video platforms and television.
Chang, B. H., & Chan-Olmsted, S. M. (2010). Success factors of cable network brand extension: Focusing on the parent network, composition, fit, consumer characteristics, and viewing habits. Journal of Broadcasting & Electronic Media, 54(4), 641-656.
Indexed at, Google Scholar, Cross Ref
Chen, C., & Yao, M. Z. (2022). Strategic use of immersive media and narrative message in virtual marketing: Understanding the roles of telepresence and transportation. Psychology & marketing, 39(3), 524-542.
Indexed at, Google Scholar, Cross Ref
Chulkov, D. &. (2015). Bundling, cord-cutting and the death of TV as we know it.
Chulkov, D., & Nizovtsev, D. (2015). Bundling, cord-cutting and the death of TV as we know it. Journal of the international academy for case studies, 21(5), 7-14.
Churchill, G.A. & Suprenant, C. (1982) An investigation into the determinants of consumer satisfaction, Journal of Marketing Research, 19, 491-504.
Indexed at, Google Scholar, Cross Ref
Ferreira, D. C., Marques, R. C., Nunes, A. M., & Figueira, J. R. (2021). Customers satisfaction in pediatric inpatient services: A multiple criteria satisfaction analysis. Socio-Economic Planning Sciences, 78, 101036.
Fitzgerald, C. F., & Jensen, R. L. (2020). A comparison of the national football league's Annual national football league combine 1999–2000 to 2015–2016. The Journal of Strength & Conditioning Research, 34(3), 771-81.
Furey, T., & Friedman, L. (2012). The channel advantage. Routledge.
Gillenwater, T. (2017). Evolution of the Smartphone. Microwave Journal, 60(2), 40.
Golwalkar, S., & Mishra, M. (2023). Rise of Indian regional content on video streaming platforms: A study of audience consumption and perception of Indian regional content on OTT platforms. In AIP Conference Proceedings (Vol. 2523, No. 1). AIP Publishing.
GSMA. (2021). The State of Mobile Internet Connectivity 2021.
Heinonen, K. (2011). Consumer activity in social media: Managerial approaches to consumers' social media behavior. Journal of consumer behaviour, 10(6), 356-364.
Jacobs, R. (1995). Exploring the determinants of cable television subscriber satisfaction. Journal of Broadcasting & Electronic Media, 262-274.
Johnson, M. R., & Woodcock, J. (2019). “And today’s top donator is”: How live streamers on Twitch. tv monetize and gamify their broadcasts. Social Media+ Society, 5(4), 2056305119881694.
Johnson, R., & Reed, C. (2005). Most Americans want choice for cable TV service, Poll shows. PR Newswire, 1.
Kang, M. H. (2002). Digital cable: Exploring factors associated with early adoption. The Journal of Media Economics, 15(3), 193-207.
Indexed at, Google Scholar, Cross Ref
Keogh, E. D. (2001). A cross-media presence questionnaire: The ITC-sense of presence inventory. Presence: Teleoperators and Virtual Environments, 282-297.
Khuong, M. N., & Hiep, T. H. (2014). The Effects of Customer Satisfaction through Perceived Value and Service Quality of Saigon Tourist Cable Television Services, Vietnam. International Journal of Currunt Research And Academic Review, 2(6), 1-17.
Kim, J., Nam, C., & Ryu, M. H. (2020). IPTV vs. emerging video services: Dilemma of telcos to upgrade the broadband. Telecommunications Policy, 44(4), 101889.
Kim, S. J. (2016). A repertoire approach to cross-platform media use behavior. New Media & Society, 353-372.
Koay, K. Y., Ong, D. L. T., Khoo, K. L., & Yeoh, H. J. (2020). Perceived social media marketing activities and consumer-based brand equity: Testing a moderated mediation model. Asia Pacific journal of marketing and logistics, 33(1), 53-72.
Krikke, J. (2004). Streaming video transforms the media industry. IEEE Computer Graphics and Applications, 24(4), 6-12.
Kristensen, K., Martensen, A., & Gronholdt, L. (1999). Measuring the impact of buying behaviour on customer satisfaction. Total Quality Management, 10(4-5), 602-614.
Kumar, A. A., Rahman, E. U., & Sowmyya, T. (2021). Inclination of Indian Youth Towards Video Streaming Platforms. International Journal of Business and Economics, 20(3), 233-247.
Kumar, J., Dixit, S., Maurya, A., & Gupta, A. (2022). Social Media Marketing and Purchase Behavior of Millennials: A Systematic Literature Review. Integrating New Technologies in International Business, 281-291.
Kumar, J., Gupta, A., & Dixit, S. (2020). Netflix: SVoD entertainment of next gen. Emerald Emerging Markets Case Studies, 10(3), 1-36.
Kumar, J., Tapar, A. V., & Bhattacharjee, S. (2023). Social media and the bottom of the pyramid: a systematic literature review and future research agenda. International Journal of Emerging Markets.
LaRose, R. &. (1988). Satisfaction, demographic, and media environment predictorsof cable subscription. Journal of Broadcasting & Electronic Media, 403-413.
LaRose, R., & Atkin, D. (1988). Understanding cable subscribership as telecommunications behavior. Telematics and Informatics, 5(4), 377-388.
Lee, C. C., Nagpal, P., Ruane, S. G., & Lim, H. S. (2018). Factors affecting online streaming subscriptions. Communications of the IIMA, 16(1), 2.
Lessiter, J., Freeman, J., Keogh, E., & Davidoff, J. (2001). A cross-media presence questionnaire: The ITC-Sense of Presence Inventory. Presence: Teleoperators & Virtual Environments, 10(3), 282-297.
Livemint. (2018). Video streaming market in India to reach $5 billion by 2023: BCG report.
Lu, Z., & Nam, I. (2021). Research on the influence of new media technology on internet short video content production under artificial intelligence background. Complexity, 2021, 1-14.
Matrix, S. (2014). The Netflix effect: Teens, binge watching, and on-demand digital media trends. Jeunesse: young people, texts, cultures, 6(1), 119-138.
Monaco, J. (1999). The Dictionary of New Media: The New Digital World: video, audio, print: film, television, DVD, home theatre, satellite, digital photography, wireless, super CD, internet. UNET 2 Corporation.
Nawaz, I. Y. (2020). Characteristics of millennials and technology adoption in the digital age. In Handbook of research on innovations in technology and marketing for the connected consumer (pp. 241-262). IGI Global.
Niche, T.W. (2023). Understanding The Rise of OTT in India.
Nijhawan, G. S., & Dahiya, S. (2020). Role of COVID as a Catalyst in increasing adoption of OTTs in India: A Study of evolving consumer consumption patterns and future business scope. Journal of Content, Community and Communication, 12(6), 298-311.
Pittman, M., & Sheehan, K. (2015). Sprinting a media marathon: Uses and gratifications of binge- watching television through Netflix. First Monday.
Prince, J., & Greenstein, S. (2014). Does service bundling reduce churn?. Journal of Economics & Management Strategy, 23(4), 839-875.
Indexed at, Google Scholar, Cross Ref
Purnomo, Y. J. (2023). Digital marketing strategy to increase sales conversion on e-commerce platforms. Journal of Contemporary Administration and Management (ADMAN), 1(2), 54-62.
Rauniar, R., Rawski, G., Yang, J., & Johnson, B. (2014). Technology acceptance model (TAM) and social media usage: an empirical study on Facebook. Journal of enterprise information management, 27(1), 6-30.
Sadana, M., & Sharma, D. (2021). How over-the-top (OTT) platforms engage young consumers over traditional pay television service? An analysis of changing consumer preferences and gamification. Young Consumers, 22(3), 348-367.
Santarius, T., & Soland, M. (2018). How technological efficiency improvements change consumer preferences: towards a psychological theory of rebound effects. Ecological Economics, 146, 414-424.
Schrum, L., & Levin, B. B. (2009). Leading 21st-century schools: Harnessing technology for engagement and achievement. Corwin Press.
Singh, M., & Kumar, A. (2023). A Critical Political Economy Perspective on Indian Television: STAR, Hotstar, and Live Sports Streaming. tripleC: Communication, Capitalism & Critique. Open Access Journal for a Global Sustainable Information Society, 21(1), 18-32.
Indexed at, Google Scholar, Cross Ref
Singh, S., Singh, N., Kalinic, Z., & Liébana-Cabanillas, F. J. (2021). Assessing determinants influencing continued use of live streaming services: An extended perceived value theory of streaming addiction. Expert Systems with Applications, 168, 114241.
Smiciklas, M. (2012). The power of infographics: Using pictures to communicate and connect with your audiences. Que Publishing.
Smith, M. D., & Telang, R. (2016). Streaming, sharing, stealing: Big data and the future of entertainment. Mit Press.
Soni, A., & Puthawala, H. (2020). Factors Affecting Millennials' Preference for Online Video Streaming Apps in Ahmedabad. IUP Journal of Marketing Management, 19(1).
Statista. (2023). Number of smartphone users worldwide from 2013 to 2028.
Stein, J. (2013). Millennials: The me me me generation. Time magazine, 20, 1-8.
Strusani, D., & Houngbonon, G. V. (2019). The role of artificial intelligence in supporting development in emerging markets.
Taneja, H., Webster, J. G., Malthouse, E. C., & Ksiazek, T. B. (2012). Media consumption across platforms: Identifying user-defined repertoires. New media & society, 14(6), 951-968.
Tse, D. K., & Wilton, P. C. (1988). Models of consumer satisfaction formation: An extension. Journal of marketing research, 25(2), 204-212.
Indexed at, Google Scholar, Cross Ref
Tse, Y. K. (2016). Television’s changing role in social togetherness in the personalized online consumption of foreign TV. New media & society, 18(8), 1547-1562.
Ulin, J. C. (2019). The business of media distribution: Monetizing film, TV, and video content in an online world. Routledge.
Vinoi, N., Shankar, A., Khalil, A., Mehrotra, A., & Kumar, J. (2024). Holding on to your memories: Factors influencing social media hoarding behaviour. Journal of Retailing and Consumer Services, 76, 103617.
Indexed at, Google Scholar, Cross Ref
Wakefield, D. V., Manole, B. A., Jethanandani, A., May Jr, M. E., Marcrom, S. R., Farmer, M. R., & VanderWalde, N. A. (2016). Accessibility, availability, and quality of online information for US radiation oncology residencies. Practical Radiation Oncology, 6(3), 160-165.
Indexed at, Google Scholar, Cross Ref
Wasserman, I. M., & Richmond-Abbott, M. (2005). Gender and the Internet: Causes of variation in access, level, and scope of use. Social science quarterly, 86(1), 252-270.
Wu, D., Hou, Y. T., Zhu, W., Zhang, Y. Q., & Peha, J. M. (2001). Streaming video over the Internet: approaches and directions. IEEE Transactions on circuits and systems for video technology, 11(3), 282-300.
Zainab, B., Awais Bhatti, M., & Alshagawi, M. (2017). Factors affecting e-training adoption: An examination of perceived cost, computer self-efficacy and the technology acceptance model. Behaviour & Information Technology, 36(12), 1261-1273.
Indexed at, Google Scholar, Cross Ref
Received: 29-Nov-2023, Manuscript No. AMSJ-23-14217; Editor assigned: 30-Nov-2023, PreQC No. AMSJ-23-14217(PQ); Reviewed: 30-Jan-2024, QC No. AMSJ-23-14217; Revised: 29-Feb-2024, Manuscript No. AMSJ-23-14217(R); Published: 19-Mar-2024s
