Research Article: 2022 Vol: 26 Issue: 4S
The balanced scorecard's five dimensions and stock performance in emerging markets: Evidence from EGX
Osama Wagdi, International Academy for Engineering & Media Science - IAEMS
Karim Mamdouh, Modern University for Technology and Information (MTI)
Sameh Daher, International Academy for Engineering & Media Science - IAEMS
Sharihan Aly, Arab Academy for Science, Technology and Maritime Transport
Keywords
Stock Performance, Balanced Scorecard, Creating Value, Emerging Markets, EGX
Citation Information
Wagdi, O., Mamdouh, K., Daher, S., & Aly, S. (2022). The balanced scorecard's five dimensions and stock performance in emerging markets: Evidence from EGX. Academy of Accounting and Financial Studies Journal, 26(S4), 1-32.
Abstract
This study investigates the ability of the Balanced Scorecard (BSC) to explain stock performance; The BSC has a multi-dimensional approach to performance measurement. According to (Kaplan & Norton, 1992); the traditional balanced scorecard was broken down into four dimensions: financial, marketing, operations, and learning dimension. But value creation is based on a risk-return tradeoff. So, the current study adds a new dimension to the BSC; it's the risk dimension. That created the Balanced Scorecard's Five Dimensions (BSC5D). The study used the methodology of panel data for twenty six common stocks listed on the Egyptian exchange during the period from 2011 to 2020, based on the fixed-effects method for 260 observations. The Balanced Scorecard's Five Dimensions (BSC5D) affected (83.4%) and (87%) of common stock return and total risk, respectively.
Introduction
Financial and non-financial information contribute to building the corporation's financial reputation; it's a tool as a means of communicating with the investing community (Savi?; 2013). To achieve economic development in emerging markets, the equity markets need to function efficiently (Boyd & Smith, 1998). With the hypothesis of efficient markets, financial and non-financial information is free and available to all stakeholders (Clarke et al., 2001; Vasileiou, 2021).
There are many studies that dealt with the efficiency of emerging markets (Cajueiro & Tabak, 2004; Lagoarde-Segot & Lucey, 2008); but according to (Risso, 2009) the informational efficiency levels found a difference between the emerging and developed markets; Therefore, the current study believes that the financial and non-financial information included in the balanced scorecard works as an inference to creating value for stockholders in emerging and developed markets. According to (Kaplan & Norton, 1992); the Traditional Balanced Scorecard (BSC) was broken down into four dimensions: financial, marketing, operations, and learning dimension. But value creation is based on a risk-return tradeoff. So, the current study adds a new dimension to the Balanced Scorecard (BSC); it's the risk dimension.
The current study proposes adding the risk dimension to the Traditional balanced scorecard, while investigating ability of the Balanced Scorecard (BSC) to explain value creation for stockholder in emerging market that created the Balanced Scorecard's five dimensions (BSC5D).
Method
Literature Review and Theoretical framework
To represent an ever-changing and demanding reality, financial reporting has gotten more complicated over time. Management utilizes this information to help them make decision (Nobes, 2015). On the other hand, the external users (such as customers, financial institutions, suppliers, free flow investors, potential investors, and government authorities) of financial reports have a need for financial reports characterized by sufficient and appropriate information on all aspects of the corporate’s performance, as there is a difference in the information available to internal and external users of financial reports.
The Balanced Scorecard (BSC) is created by "Kaplan and Norton", which provides a measure of performance evaluation by tying operating performance to the strategic vision and goals of the corporation, as all members of the corporation must strive to achieve that vision and the associated strategic goals, via several pieces of financial and non-financial information that reflect the effectiveness and efficiency of the corporation. An integrated framework of financial and non-financial information allows stakeholders to assess the strategic and operational performance of the facility in an unbiased way and gives comprehensive information on its performance (Kaplan & Norton, 1992; Epstein & Wisner, 2001; Tseng, 2010).
Literature shows different studies related to the Balanced Scorecard (BSC), the Study (Zairi & Letza, 1994) found that new metrics are needed to differentiate between activities that bring value to the customer and the corporate, and activities that do not contribute value for both. On the other hand; some studies that the Balanced Scorecard (BSC) may be used to measure how corporate operations contribute to sustainable development (Hakkak & Ghodsi, 2015) and the extent to which they comply with environmental regulations (Staš et al., 2015).
As a result of the study (Kaplan & Norton, 1992) the conceptual framework was created the Balanced Scorecard (BSC), which is the first study to combine financial and non-financial information in the evaluation of corporation performance. This study investigates for twelve banks in the United States. The Balanced-Scorecard System was discovered as a result of this study. To provide managers an accurate view of their corporation's overall performance, managers use this technique, which includes financial and non-financial metrics. It is considered a cutting-edge approach to create and analysis value in corporation. The Balanced Scorecard (BSC) was broken down into four dimensions, each of which was examined in depth in this study: "the financial dimension", "the marketing dimension", "the operations dimension", and "the learning and growth dimension".
But value creation is based on a risk-return tradeoff. So, the current study adds a new dimension to BSC; it's the risk dimension (see figure No.1). "Risk" may be defined in many ways, it's any situation in which there's a chance that a result will be different from what one expects or hopes. Despite the simplicity of the previous definition, the indications of risk differ between individuals and areas of application.

Figure 1: The Five Dimensions Of Balanced Scorecard (Bsc)
The traditional financial reporting has the lack of relevance interpret the future of the corporate; that back to the traditional financial reporting focused on the short-term but stockholder need to do more to establish effective strategies for long-term goals (Hopwood, 1972; Johnson & Kaplan, 1987). The Financial and Non-financial Information under informational efficiency helped reduce businesses’ capital costs and has increased financial analyst precision (Platikanova & Perramon, 2012; ICAEW, 2014); When risk is added to the balanced scorecard, the determinants of value, return and risk can be presented.
Figure (2) Illustrates proposes the relationship between the Balanced Scorecard dimensions and creating value for stockholder; this is done through three independent variables: Cash dividend and growth rates through a positive relationship with value creation versus the required rate of return with an inverse relationship with value creation; That under a sequential relationship between operational, marketing and financial performance; This is reflected in two dimensions: Learning and growth rates? as well as ?systematic and unsystematic risks.

Figure 2: Creating Value For Stockholder Under The Balanced Scorecard's Five Dimensions
Literature shows different classifications of risks. Like a systematic vs. unsystematic risk (Beja, 1972) these classifications can be used on real and financial assets. The credit for creating this concept can be attributed to Markowitz (1952); Unsystematic risk is a danger unique to a single corporate or sector, while systematic risk is a risk that affects the whole economy. The contribution of diversification to risk management appears when it works to minimize systemic risks. This task can be performed at the level of real assets (diversification of corporate products) and financial assets (diversity of financial instruments).
According to Elkhouly, et al., (2015); Henry Fayol introduced the notion of risk management in 1916. But only until Gallagher wrote his essay on risk management did it become codified in 1956. After these efforts, the trade-off models between risk and return tradeoff (Wagdi; 2014), that included the capital asset pricing model, that call CAPM (Sharpe, 1964; Lintner, 1965; Mossin, 1966), the Arbitrage pricing theory, that call APT (Ross, 1976), the three factor model of Fama & French (1995), but after twenty years there the five factor model of Fama & French (2015).
Study Design
This study investigates using financial and non-financial information under a balanced scorecard to estimate creating value in emerging markets; the study used the methodology of panel data for twenty six common stocks listed on the Egyptian exchange. Through a literature review, the study found both the Balanced Scorecard's five dimensions as independent variables ("the financial performance," "the marketing performance," "the operations performance," and "the learning and growth rate" and "systematic and unsystematic risks") have an effect on creating value for stockholders; the study used risk and return as variables to create value; Figure (3) illustrates the study layout.

Figure 3: Study Layout
The study investigated determinants of creating stockholder value in emerging markets. The study removed the outliers using winsorization at 5% for the continuous variables from study sample data. The functions are drafted to explain the proposed framework for creating stockholder value through five groups.

The study uses two measures to estimate the creating stockholder value based on returns and risk of common stock. So, the study presents an independent model for each measure. The study proposes two models to creating stockholder value; as follows:
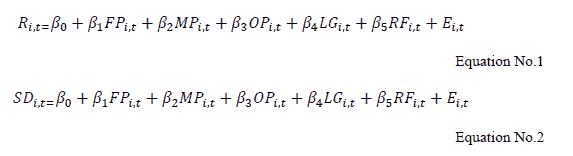
The study tested two hypotheses, and Equations (1), and (2) were drafted to test these hypotheses. Where (i) represent the common stock of corporate and (t) represents time.
In equation (1), (R) represents hold Returns of the common stock as a dependent variable, but in equation (2), (SD) represents total risk (Standard Deviation) of the common stock as a dependent variable.
On other hand; (FP) represent Financial Performance, (MP) represent Marketing Performance, (OP) represent Operations Performance, (LG) represent Learning And Growth, (RF) represent Risk Factors; The study created an index of equal weights for each of the five dimensions (financial, marketing, operations, learning and risk dimension).
Financial Performance (FP)
Finances performance is used to measure how much money has been invested and how much money has been made from that investment. The stockholders' expectations are important considerations. In the Balanced Scorecard (BSC), long-term value creation begins with the financial driving force. The current study was used revenue, profit, outstanding debt and bad debt rate to total assets as independent variables for financial performance.
Marketing Performance (MP)
It is important under the Balanced Scorecard (BSC) to stress the chain link between corporate products and customer satisfaction. To achieve consumer pleasure, products and services must have value propositions to consumer. Customers are the primary focus of many corporate strategies. The current study was used corporate image, customer satisfaction as independent variables for marketing performance.
Operational Performance (OP)
An operational performance is the third perspective of the Balanced Scorecard (BSC) that examines implementation stages. Customer value distribution performance may be measured using internal process metrics. For example, it might include short-term and long-term goals; the study adopts the existence of a quality assurance system in addition to obtaining one of the quality certificates such as IOS-9001 as independent variables for operational performance.
Learning and Growth (LG)
A Learning and Growth is the fourth perspective of the Balanced Scorecard (BSC) that examines implementation stages. Customer value distribution performance may be measured using internal process metrics. For example, it might include short-term and long-term goals. The study adopts the growth rates of revenues, profits and labor productivity, in addition to the rate of employee turnover as independent variables for learning and growth.
Risk Factors (RF)
Risk factors are the fifth perspective of the Balanced Scorecard (BSC); the study adopts the Operating leverage and financial leverage, in addition to the Systemic risk based on beta as independent variables for risk factors.
Data; Examine and Results
The Study Sample
The study sample includes data from twenty-six corporate indexed on the Egypt 30 index. Four companies were omitted due to the incompleteness of the time series. Table (1): illustrates study sample.
| Table 1 The Study Sample |
||||||
|---|---|---|---|---|---|---|
| No. | Corporate Name | Reuters Code | Listing Date | Listed Shares | Sector | Market Cap. |
| 1 | Abu Dhabi Islamic Bank | ADIB.CA | 19/06/1996 | 200,000,000 | Banks | 2,974,000,000 |
| 2 | Abou Kir Fertilizers | ABUK.CA | 12/09/1994 | 1,261,875,720 | Basic Resources | 23,735,882,293 |
| 3 | Alexandria Mineral Oils Company | AMOC.CA | 22/12/2004 | 1,291,500,000 | Energy | 4,507,335,000 |
| 4 | Aspire Capital Holding For Financial Investments | ASPI.CA | 22/06/2008 | 1,054,805,160 | Non-bank financial services |
295,345,445 |
| 5 | Citadel Capital ? Common Shares | CCAP.CA | 03/12/2009 | 1,418,261,351 | Non-bank financial services |
1,706,168,405 |
| 6 | Commercial International Bank |
COMI.CA | 02/02/1995 | 1,970,241,790 | Banks | 101,487,154,603 |
| 7 | Credit Agricole | CIEB.CA | 03/07/1996 | 310,917,000 | Banks | 9,013,483,830 |
| 8 | Eastern Company | EAST.CA | 27/09/1995 | 2,250,000,000 | Tobacco | 25,380,000,000 |
| 9 | Egyptian Financial Group-Hermes Holding Company | HRHO.CA | 10/02/1999 | 973,070,671 | Non-bank | Egyptian Financial Group-Hermes Holding Company |
| 10 | Egyptian Chemical Industries (Kima) |
EGCH.CA | 16/08/1995 | 1,186,578,999 | Basic Resources | 3,927,576,487 |
| 11 | Egyptian for Tourism Resorts | EGTS.CA | 10/02/1999 | 1,050,000,000 | Travel & Leisure | 1,502,550,000 |
| 12 | Egyptian Iron & Steel | IRON.CA | 13/11/1958 | 976,872,278 | Basic Resources | 3,448,359,141 |
| 13 | Egyptian Kuwaiti Holding | EKHO.CA | 27/01/1999 | 1,126,885,287 | Non-bank financial services |
23,213,836,912 |
| 14 | ELSWEDY ELECTRIC | SWDY.CA | 18/05/2006 | 2,184,180,000 | Industrial Goods | 18,652,897,200 |
| 15 | Ezz Steel | ESRS.CA | 25/05/1999 | 543,265,027 | Basic Resources | 7,138,502,455 |
| 16 | Ezz Steel | ESRS.CA | 25/05/1999 | 543,265,027 | Basic Resources | 7,138,502,455 |
| 17 | Heliopolis Housing | HELI.CA | 07/05/1995 | 1,335,085,200 | Real Estate | 6,808,934,520 |
| 18 | Juhayna Food Industries | JUFO.CA | 18/05/2010 | 941,405,082 | Food & Beverages | 6,505,109,117 |
| 19 | Medinet Nasr Housing | MNHD.CA | 07/05/1995 | 1,497,600,000 | Real Estate | 3,594,240,000 |
| 20 | Oriental Weavers | ORWE.CA | 14/12/1994 | 665,107,268 | Textile | 5,660,062,851 |
| 21 | Palm Hills Development Company | PHDC.CA | 27/12/2006 | 3,081,249,635 | Real Estate | 5,666,418,079 |
| 22 | Raya Holding For Financial Investments | RAYA.CA | 12/05/2005 | 2,143,995,190 | Non-bank financial services |
5,317,108,071 |
| 23 | Sidi Kerir Petrochemicals | SKPC.CA | 09/03/2005 | 630,000,000 | Basic Resources | 4,315,500,000 |
| 24 | Six of October Development & Investment |
OCDI.CA | 10/03/1998 | 356,197,368 | Real Estate | 7,002,840,255 |
| 25 | T M G Holding | TMGH.CA | 25/11/2007 | 2,063,562,286 | Real Estate | 16,776,761,385 |
| 26 | Telecom Egypt | ETEL.CA | 29/12/1999 | 1,707,071,600 | Communication | 25,247,588,964 |
Descriptive Statistics
The normal distribution of daily returns
The normal distribution of return can be displayed in the figures from (4) to (29)
A. Abu Dhabi Islamic Bank (ADIB)

Figure 4: The Normal Distribution For Common Stock Returns Of Abu Dhabi Islamic Bank
B. Abu Qir Fertilizers and Chemical Industries Co SAE

Figure 5: The Normal Distribution For Common Stock Returns Of Abu Qir Fertilizers And Chemical Industries
C. Alexandria Mineral Oils Company (AMOC)

Figure 6: The Normal Distribution For Common Stock Returns Of Alexandria Mineral Oils Company
D. Aspire Capital Holding for Financial Investments (ASPI)

Figure 7: The Normal Distribution For Common Stock Returns Of Aspire Capital Holding
E. Citadel Capital (CCAP)

Figure 8: The Normal Distribution For Common Stock Returns Of Citadel Capital
F. Commercial International Bank (COMI)

Figure 9: The Normal Distribution For Common Stock Returns Of Commercial International Bank
G. Credit Agricole Egypt (CIEB)

Figure 10: The Normal Distribution For Common Stock Returns Of Credit Agricole
H. Eastern Tobacco (EAST)

Figure 11: The Normal Distribution For Common Stock Returns Of Eastern Tobacco
I. EFG Hermes Holdings SAE (HRHO)

Figure 12: The Normal Distribution For Common Stock Returns Of Efg Hermes Holdings
J. Egyptian Chemical Industries (EGCH)

Figure 13: The Normal Distribution For Common Stock Returns Of Egyptian Chemical Industries
K. Egyptian for Tourism Resorts (EGTS)

Figure 14: The Normal Distribution For Common Stock Returns Of Egyptian For Tourism Resorts
L. Egyptian Iron & Steel (IRON)

Figure 15: The Normal Distribution For Common Stock Returns Of Egyptian Iron & Steel
M. Egyptian Kuwaiti Holding (EKHO)

Figure 16: The Normal Distribution For Common Stock Returns Of Egyptian Kuwaiti Holding
N. El Sewedy Electric Co SAE (SWDY)

Figure 17: The Normal Distribution For Common Stock Returns Of El Sewedy Electric
O. Ezz Steel (ESRS)

Figure 18: The Normal Distribution For Common Stock Returns Of Ezz Steel
P. GB AUTO (AUTO)

Figure 19: The Normal Distribution For Common Stock Returns Of Gb Auto
Q. Heliopolis Housing (HELI)

Figure 20 The Normal Distribution For Common Stock Returns Of Heliopolis Housing
R. Juhayna Food Industries (JUFO)

Figure 21: The Normal Distribution For Common Stock Returns Of Juhayna Food Industries
S. Madinet Nasr for Housing and Development SAE (MNHD)

Figure 22: The Normal Distribution For Common Stock Returns Of Madinet Nasr For Housing And Development
T. Oriental Weavers (ORWE)

Figure 23: The Normal Distribution For Common Stock Returns Of Oriental Weavers
U. Palm Hills Development Company (PHDC)

Figure 24: The Normal Distribution For Common Stock Returns Of Palm Hills Development Company
V. Raya Holding for Financial Investment SAE (RAYA)

Figure 25: The Normal Distribution For Common Stock Returns Of Raya Holding For Financial Investment
W. Sidi Kerir Petrochemicals (SKPC)

Figure 26: The Normal Distribution For Common Stock Returns Of Sidi Kerir Petrochemicals
X. Six of October Development & Invest (OCDI)

Figure 27: The Normal Distribution For Common Stock Returns Of Six Of October Development & Invest
Y. T M G Holding (TMGH)

Figure 28: The Normal Distribution For Common Stock Returns Of T M G Holding
Z. Telecom Egypt (ETEL)

Figure 29: The Normal Distribution For Common Stock Returns Of Telecom Egypt
Average Return on a Daily Basis
The daily rates of return can be displayed in the figures from (30) to (55)
A. Abu Dhabi Islamic Bank (ADIB)

Figure 30: Daily Average Return For Abu Dhabi Islamic Bank
B. Abu Qir Fertilizers and Chemical Industries Co SAE

Figure 31: Daily Average Return For Abu Qir Fertilizers And Chemical Industries
C. Alexandria Mineral Oils Company (AMOC)

Figure 32: Daily Average Return For Alexandria Mineral Oils Company
D. Aspire Capital Holding for Financial Investments (ASPI)

Figure 33: Daily Average Return For Aspire Capital Holding For Financial Investments
E. Citadel Capital (CCAP)

Figure 34: Daily Average Return For Citadel Capital - Common Shares
F. Commercial International Bank (COMI)

Figure 35: Daily Average Return For International Bank
G. Credit Agricole Egypt (CIEB)

Figure 36: Daily Average Return For Credit Agricole Egypt
H. Eastern Tobacco (EAST)

Figure 37: Daily Average Return For Eastern Tobacco
I. EFG Hermes Holdings SAE (HRHO)

Figure 38: Daily Average Return For Efg Hermes Holdings
J. Egyptian Chemical Industries (EGCH)

Figure 39: Daily Average Return For Egyptian Chemical Industries
K. Egyptian for Tourism Resorts (EGTS)

Figure 40: Daily Average Return For Egyptian For Tourism Resorts
L. Egyptian Iron & Steel (IRON)

Figure 41: Daily Average Return For Egyptian Iron & Steel
M. Egyptian Kuwaiti Holding (EKHO)

Figure 42: Daily Average Return For Egyptian Kuwaiti Holding
N. El Sewedy Electric Co SAE (SWDY)

Figure 43: Daily Average Return For El Sewedy Electric
O. Ezz Steel (ESRS)

Figure 44: Daily Average Return For Ezz Steel
P. GB AUTO (AUTO)

Figure 45: Daily Average Returns For Gb Auto
Q. Heliopolis Housing (HELI)

Figure 46: Daily Average Return For Heliopolis Housing
R. Juhayna Food Industries (JUFO)

Figure 47: Daily Average Return For Juhayna Food Industries (Jufo)
S. Madinet Nasr for Housing and Development SAE (MNHD)

Figure 48: Daily Average Return For Madinet Nasr For Housing And Development
T. Oriental Weavers (ORWE)

Figure 49: Daily Average Return For Oriental Weavers
U. Palm Hills Development Company (PHDC)

Figure 50: Daily Average Return For Palm Hills Development Company
V. Raya Holding for Financial Investment SAE (RAYA)

Figure 51: Daily Average Return For Raya Holding For Financial Investment
W. Sidi Kerir Petrochemicals (SKPC)

Figure 52: Daily Average Return For Sidi Kerir Petrochemicals
X. Six of October Development & Invest (OCDI)

Figure 53: Daily Average Return For Six Of October Development & Invest
Y. T M G Holding (TMGH)

Figure 54: Daily Average Return For T M G Holding
Z. Telecom Egypt (ETEL)

Figure 55: Daily Average Return For Telecom Egypt
Standard Deviation on a Daily Basis
The Standard Deviation of return can be displayed in the figures from (56) to ().
A. Abu Dhabi Islamic Bank (ADIB)

Figure 56: Daily S.D For Common Stock Of Abu Dhabi Islamic Bank Abu Dhabi Islamic Bank
B. Abu Qir Fertilizers and Chemical Industries Co SAE (ABUK)

Figure 57: Daily S.D For Common Stock Of Abu Qir Fertilizers And Chemical Industries
C. Alexandria Mineral Oils Company (AMOC)

Figure 58: Daily S.D For Common Stock Of Alexandria Mineral Oils Company
D. Aspire Capital Holding for Financial Investments (ASPI)

Figure 59: Daily S.D For Common Stock Of Aspire Capital Holding For Financial Investments
E. Citadel Capital - Common Shares (CCAP)

Figure 60: Daily S.D For Common Stock Of Citadel Capital - Common Shares
F. Commercial International Bank (COMI)

Figure 61: Daily S.D For Common Stock Of Commercial International Bank
G. Credit Agricole Egypt (CIEB)

Figure 62: Daily S.D For Common Stock Of Credit Agricole Egypt
H. Eastern Tobacco (EAST)

Figure 63: Daily S.D For Common Stock Of Eastern Tobacco
I. EFG Hermes Holdings SAE (HRHO)

Figure 64: Daily S.D For Common Stock Of Efg Hermes Holdings Sae
J. Egyptian Chemical Industries (EGCH)

Figure 65: Daily S.D For Common Stock Of Egyptian Chemical Industries
K. Egyptian for Tourism Resorts (EGTS)

Figure 66: Daily S.D For Common Stock Of Egyptian For Tourism Resorts
L. Egyptian Iron & Steel (IRON)

Figure 67: Daily S.D For Common Stock Of Egyptian Iron & Steel
M. Egyptian Kuwaiti Holding (EKHO)

Figure 68: Daily S.D For Common Stock Of Egyptian Kuwaiti Holding
N. El Sewedy Electric Co SAE (SWDY)

Figure 69: Daily S.D For Common Stock Of El Sewedy Electric Co Sae
O. Ezz Steel (ESRS)

Figure 70: Daily S.D For Common Stock Of Ezz Steel
P. GB AUTO (AUTO)

Figure 71: Daily S.D For Common Stock Of Gb Auto
Q. Heliopolis Housing (HELI)

Figure 72: Daily S.D For Common Stock Of Heliopolis Housing
R. Juhayna Food Industries (JUFO)

Figure 73: Daily S.D For Common Stock Of Juhayna Food Industries
S. Madinet Nasr for Housing and Development SAE (MNHD)

Figure 74: Daily S.D For Common Stock Of Madinet Nasr For Housing And Development
T. Oriental Weavers (ORWE)

Figure 75: Daily S.D For Common Stock Of Madinet Nasr For Housing And Development
U. Oriental Weavers (ORWE)

Figure 76: Daily S.D For Common Stock Of Oriental Weavers
V. Palm Hills Development Company (PHDC)

Figure 77: Daily S.D For Common Stock Of Palm Hills Development Company
W. Raya Holding for Financial Investment SAE (RAYA)

Figure 78: Daily S.D For Common Stock Of Raya Holding For Financial Investment Sae
X. Sidi Kerir Petrochemicals (SKPC)

Figure 79: Daily S.D For Common Stock Of Sidi Kerir Petrochemicals
Y. Six of October Development & Invest (OCDI)

Figure 80: Daily S.D For Common Stock Of Six Of October Development & Invest
Z. T M G Holding (TMGH)

Figure 81: Daily S.D For Common Stock Of T M G Holding
AA. Telecom Egypt (ETEL)

Figure 82: Daily S.D For Common Stock Of Telecom Egypt
Examining
The assumption of stationary "constant variance" exists in many time series methods. One of the defining characteristics of a stationary process is that "the mean", "variance", and "autocorrelation values" do not vary over time.
The current study exam the data stationary to ensure that the mean and variance were invariant according to a unit root test, the stationarity of the time series of the basic independent and dependent indicators at level zero was evaluated according to the constant level.
This was done through the "Augmented Dickey–Fuller (ADF)", "Philips–Perron (PP)", "Im, Pesaran and Shin W-stat (IPSW)", "Levin, and Lin and Chu t (LLC)" tests at a significance level of less than 0.05. In addition to the "Tau-statistic", the "Z-statistic" criteria were at a significance level of less than 0.05.
Returns Hypothesis
This hypothesis examines the ability of using Financial and Non-financial Information under a Balanced Scorecard to Interpretation of corporate returns; the study used a panel data analysis to examine this hypothesis based on fixed-effects. as shows in Table 2.
| Table 2 Returns Hypothesis |
||||||
|---|---|---|---|---|---|---|
| Coefficient | Std. Error | t-ratio | p-value | |||
| const | -4.23980 | 0.402501 | -10.53 | <0.0001 | *** | |
| FP | 71.5826 | 2.78106 | 25.74 | <0.0001 | *** | |
| OP | 0.732958 | 0.472939 | 1.550 | 0.1226 | ||
| MP | -0.883770 | 0.523188 | -1.689 | 0.0925 | * | |
| LG | 2.21703 | 0.777539 | 2.851 | 0.0048 | *** | |
| RF | 1.43150 | 0.309598 | 4.624 | <0.0001 | *** | |
| Mean dependent var | 0.109521 | S.D. dependent var | 1.568892 | |||
| Sum squared resid | 39.08114 | S.E. of regression | 0.413110 | |||
| LSDV R-squared | 0.838697 | Within R-squared | 0.834357 | |||
| LSDV F(30, 229) | 116.8849 | P-value(F) | 1.1e-121 | |||
| Log-likelihood | -122.5686 | Akaike criterion | 307.1372 | |||
| Schwarz criterion | 417.5183 | Hannan-Quinn | 351.5119 | |||
| rho | -0.105087 | Durbin-Watson | 1.739019 | |||
Model 1: Fixed-effects, using 260
observations Included 26 cross-
sectional units
Time-series length=10 Dependent variable: R
Joint test on named regressors -
Test statistic: F(5, 229)=651.915
with p-value=P(F(5, 229)>651.915)=3.13168e-133
Test for differing group intercepts -
Null hypothesis: The groups have a
common intercept Test statistic: F(25,
229)=1.65583
with p-value=P(F(25, 229)>1.65583)=0.0297326
According to the statistical results from table (2), the study rejects the null hypothesis, as the study found impact of the Balanced Scorecard's five dimensions (BSC5D) on the retunes of common stock; and this was significant at the 0.01 level. The financial performance, marketing performance, operations performance, learning and growth, risk factors affected (83.4%) of total risk.
Risk Hypothesis
This hypothesis examines the ability of using Financial and Non-financial Information under the Balanced Scorecard's Five Dimensions (BSC5D) to Interpretation of common stock returns; the study used a panel data analysis to examine this hypothesis based on fixed-effects. as shows in Table 3.
| Table 3 Risk hypothesis | ||||||
|---|---|---|---|---|---|---|
| Coefficient | Std. Error | t-ratio | p-value | |||
| Const. | 28.3370 | 3.56027 | 7.959 | <0.0001 | *** | |
| FP | -68.9294 | 24.5995 | 2.802 | 0.0055 | *** | |
| OP | -48.8793 | 4.18332 | 11.68 | <0.0001 | *** | |
| MP | -58.0567 | 4.62779 | -12.55 | <0.0001 | *** | |
| LG | -27.5996 | 6.87762 | 4.013 | <0.0001 | *** | |
| RF | 63.3211 | 2.73851 | 23.12 | <0.0001 | *** | |
| Mean dependent var | 5.823300 | S.D. dependent var | 21.86180 | |||
| Sum squared resid | 3057.732 | S.E. of regression | 3.654113 | |||
| LSDV R-squared | 0.875298 | Within R-squared | 0.870243 | |||
| LSDV F(30, 229) | 301.3866 | P-value(F) | 1.2e-166 | |||
| Log-likelihood | -689.3412 | Akaike criterion | 1440.682 | |||
| Schwarz criterion | 1551.063 | Hannan-Quinn | 1485.057 | |||
| rho | -0.160086 | Durbin-Watson | 2.081776 | |||
Model 2: Fixed-effects, using 260
observations Included 26 cross-
sectional units
Time-series length=10 Dependent variable: SD
Joint test on named regressors -
Test statistic: F(5, 229)=1493.32
with p-value=P(F(5, 229)>1493.32)=1.50845e-172
Test for differing group intercepts -
Null hypothesis: The groups have a
common intercept Test statistic: F(25,
229)=8.80369
with p-value=P(F(25, 229)>8.80369)=6.27205e-022
According to the statistical results from table (3), the study rejects the null hypothesis, as the study found impact of the Balanced Scorecard's five dimensions (BSC5D) on the total risk of common stock; and this was significant at the 0.01 level. The financial performance, marketing performance, operations performance, learning and growth, risk factors affected (87%) of total risk.
Conclusion and Recommendations
Conclusion
The central premise of this study is improving the Balanced Scorecard (BSC) for stock performance interpretation, so the objective of the current study was to develop the traditional Balanced Scorecard (BSC) based on adding a new dimension. Based on the study Kaplan & Norton (1992), the traditional Balanced Scorecard (BSC) conceptual framework was developed, and that is through the integration of financial and non-financial information, to understand the performance of corporate. The Balanced Scorecard (BSC) takes a multi-dimensions approach to performance evaluation. While it retains the emphasis on traditional financial performance measures as the outcome measures for corporate success, it integrates these with metrics from three additional perspectives based on cause- and-effect relationships and regarded as the drivers for creating long-term stockholder value; it's marketing, operations, and learning dimension. But value creation is based on a risk-return tradeoff. So, the current study adds a new dimension to the Balanced Scorecard (BSC); it's the risk dimension. That created the Balanced Scorecard's five dimensions (BSC5D).
The Balanced Scorecard's Five Dimensions (BSC5D) are built on the basis of the dynamic relationship between real assets and financial assets. Financial assets are a source of financing for the acquisition of real assets (production lines - buildings - raw materials), while real assets are the source of returns for financial assets (stocks and bonds).
The scientific addition presented in the current study is represented by adding the risk factors to the Balanced Scorecard (BSC) as a new fifth dimension not included in the traditional Balanced Scorecard (BSC), Risk factors have been estimated through an equal-weight index of three variables: operating leverage, financial leverage (as indicators of unsystematic risks) and the beta coefficient (as an indicator of systematic risks), That created the Balanced Scorecard's five dimensions (BSC5D). It affected (83.4%) and (87%) of common stock return and total risk, respectively.
This conclusion agree with Baseri & Hakaki (2018); Lourenço, et al., (2019); Asraf & Desda (2020); Grau & Reig (2021); for impact of risk factors on corporate performance under real assets; with de Medeiros, et al., (2006); Syaifullah (2017); Ashraf et al., (2017) for impact of risk factors on stock performance under financial assets. Therefore, the conclusions reached in this study will be of interest to both professionals and academics in understanding, analyzing and perceiving the logical of stock performance in emerging market.
Recommendations
The study recommends that the top management of corporations have a comprehensive vision of the determinants of common stock's performance, which includes five groups of variables: financial, marketing, operations, learning, and risk factors; while the researchers recommend Replicated studies should be done in other emerging markets to verify the results that lead to creating knowledge; addition to extensive exam of the Balanced Scorecard's five dimensions (BSC5D) through a cross-sectional analysis of several countries.
References
Ashraf, D., Felixson, K., Khawaja, M., & Hussain, S.M. (2017). Do constraints on financial and operating leverage affect the performance of Islamic equity portfolios?.Pacific-Basin Finance Journal, 42, 171-182.
Crossref , Indexed at, Google scholar
Asraf, A., & Desda, M.M. (2020). Analysis of the effect of operating leverage and financial leverage on companies profitability listed on Indonesia Stock Exchange.Ilomata International Journal of Management, 1(2), 45-50.
Baseri, S., & Hakaki, A. (2018). Analysis of financial leverage, operating leverage and capital venture effect on tobin's q ratio of investment and holding companies listed in Tehran stock exchange.Advances in Mathematical Finance and Applications, 3(1), 91-96.
Beja, A. (1972). On systematic and unsystematic components of financial risk. The journal of finance, 27(1), 37-45.
Boyd, J.H., & Smith, B.D. (1998). The evolution of debt and equity markets in economic development. Economic Theory, 12(3), 519-560.
Crossref , Indexed at, Google scholar
Cajueiro, D.O., & Tabak, B.M. (2004). Ranking efficiency for emerging markets. Chaos, Solitons & Fractals, 22(2), 349-352.
Crossref , Indexed at, Google scholar
Clarke, J., Jandik, T., & Mandelker, G. (2001). The efficient markets hypothesis. Expert financial planning: Advice from industry leaders, 7(3/4), 126-141.
Crossref , Indexed at, Google scholar
Ribeiro, D.M.O., Roberto, B.L.P., & Alves, D.J. (2006). The impact of the degree of operating leverage on stock returns: An empirical study in the Brazilian Market.
Crossref , Indexed at, Google scholar
Elkhouly, S.M., Ibrahim, M.M., El Frargy, M.M., & Kotb, A.S. (2015). Measuring the effectiveness of banking risk balanced scorecard in enhancing bank value. International Journal of Economics and Finance, 7(6).
Crossref , Indexed at, Google scholar
Epstein, M.J., & Wisner, P. (2001). Good neighbours: Implementing social and environmental strategies with the BSC.Balanced Scorecard Report, 3(3).
Fama, E.F., & French, K.R. (1995). Size and book- to- market factors in earnings and returns.The journal of finance, 50(1), 131-155.
Crossref , Indexed at, Google scholar
Fama, E.F., & French, K.R. (2015). A five-factor asset pricing model.Journal of financial economics, 116(1), 1-22.
Grau, A., & Reig, A. (2021). Operating leverage and profitability of SMEs: Agri-food industry in Europe.Small Business Economics, 57(1), 221-242.
Crossref , Indexed at, Google scholar
Hakkak, M., & Ghodsi, M. (2015). Development of a sustainable competitive advantage model based on balanced scorecard.International Journal of Asian Social Science, 5(5).
Crossref , Indexed at, Google scholar
Hopwood, A.G. (1972). An empirical study of the role of accounting data in performance evaluation, empirical research in accounting.Supplement to Journal of Accounting Research, 10(10), 156-182.
Crossref , Indexed at, Google scholar
ICAEW. (2014). The effects of mandatory IFRS adoption in the EU: A review of empirical research. Institute of Chartered Accountants in England and Wales, London.
Johnson, H.T., & Kaplan, R.S. (1987). Relevance lost: The rise and fall of management accounting. Harvard Business School Press, Boston, MA.
Robert, K.S., & David, P.N. (1992). The balanced scorecard measures that drive performance. Harvard Business review. January- February.
Lagoarde-Segot, T., & Lucey, B.M. (2008). Efficiency in emerging markets—Evidence from the MENA region. Journal of International Financial Markets, Institutions and Money, 18(1), 94- 105.
Crossref , Indexed at, Google scholar
Lourenço, W.D.S., Louzada, L.C., & Novaes, P.V.G. (2019). The moderating role of market structure on the relationship between firm operational performance and degree of operating leverage.Revista Universo Contábil, 14(4), 160-181.
Crossref, Indexed at, Google scholar
Markowitz, H. (1952). Portfolio selection. Journal of Finance, 7(1), 77-91
Nobes, C. (2015). The international transfer of technology: examples from the development of accounting. European Accounting and Management Review, 2 (1), 1-14.
Crossref, Indexed at, Google scholar
Platikanova, P., & Perramon, J. (2012). Economic consequences of the first-time IFRS introduction in Europe. Spanish Journal of Finance and Accounting, 41(156), 497-519.
Crossref, Indexed at, Google scholar
Risso, W.A. (2009). The informational efficiency: The emerging markets versus the developed markets. Applied Economics Letters, 16(5), 485-487.
Crossref , Indexed at, Google scholar
Ross S.A. (1976), The arbitrage theory of capital asset pricing. Journal of Economic Theory, 13(3), 341–360.
Crossref , Indexed at, Google scholar
Savic, B. (2013). Financial reporting policy as tool for creating value for stockholders.Acta Economica, 11(19).
Crossref , Indexed at, Google scholar
Staš, D., Lenort, R., Wicher, P., & Holman, D. (2015). Green transport balanced scorecard model with analytic network process support. Sustainability, 7(11).
Crossref , Indexed at, Google scholar
Syaifullah, A. (2017). Lampiran data financial leverage: Operating leverage dan stock return. Monetary-Journal of Accounting and Finance, 4(2), 183-190.
Tseng, M.L. (2010). Implementation and performance evaluation using the fuzzy network balanced scorecard.Computers & Education, 55(1).
Crossref, Indexed at, Google scholar
Vasileiou, E. (2021). Efficient markets hypothesis in the time of COVID-19. Review of Economic Analysis, 13(1), 45-63.
Crossref , Indexed at, Google scholar
Wagdi, O. (2014). Relationship between risk and common stock return in CML and CAPM.Scientific Journal of Economic and Commerce, Ain Shams University, 44(2), 1-16.
Zairi, M., & Letza, S. (1994). Performance measurement: A challenge for total quality and the accounting professions. Asia Pacific Journal of Quality Management, 3(2), 26-41.
Received: 04-Dec-2021, Manuscript No. AAFSJ-21-10232; Editor assigned: 07-Dec-2021, PreQC
No. AAFSJ-21-10232 (PQ); Reviewed: 15-Dec-2021, QC No. AAFSJ-21-10232; Revised: 28-Dec
2021, Manuscript No. AAFSJ-21-10232; Published: 04-Jan-2022