Research Article: 2021 Vol: 20 Issue: 3
Testing of Co Movement in Commodities Markets
R. Sugirtha, Bharathidasan University
M. Babu, Bharathidasan University
S. Srinivasan, Sri Ramachandra Faculty of Management Sciences
J. Gayathri, Bharathidasan University
G. Indhumathi, Mother Teresa Women’s University
Abstract
The paper proposes to analyse the price movement of metal commodities such as aluminium, copper and zinc, during the study period from January 2015 to January 2020. ADF, GARCH Model, Correlation and Granger Causality Test were used, to identify the bidirectional relationship between Aluminium and Zinc. The study found that copper reported a unidirectional relationship with Aluminium and Zinc, during the study period. In short, the price of one metal commodity is based on the other metal commodity.
Keywords
Commodities, Metal, Aluminium, Copper, Zinc.
JEL Code
G1, G11
Introduction
Increase and decrease in Indian commodity prices, particularly metal commodity price have been the substance of dynamic debate among Alquist et al. (2014); Daskalaki et al. (2014); and Antonakakis & Kizys (2015). The study examined the significant degree of co-movement in Indian metal commodity prices.
Various firms are actively engaged in base metals trading, for a variety of reasons. Some firms are hedging a physical price exposure due to their involvement in the supply chain of the metal. Startups are also increasingly engaged in metals trading as the startup booms are happening in emerging economies (Salamzadeh, 2018). Others trade base metals as an investment asset.
Aluminium is the fastest growing non-ferrous metal in India. India ranks fourth in terms of aluminium production, behind China, Australia and Brazil. In FY17, primary aluminium output stood at 2.9 million tonnes. Copper is the second largest non-ferrous metal market in India, in terms of production. In FY17, primary copper output totalled 0.8 million tonnes. By 2020, India is poised to become the world’s fourth largest copper market, growing at a CAGR of ~6.1% per annum from FY16-FY20. Zinc is the fourth most widely used metal across the globe, trailing behind, steel, aluminium and copper. Zinc consumption in India was recorded at 0.67 million tonnes during FY17. This is set to rise to 0.90 million tonnes by FY20. Around 75% of zinc is used for galvanising in order to protect steel from corrosion Byrne et al. (2019). Hence, the study selected these base metals as sample commodity and analysed the co movements and volatility among the prices of Indian base metals. This paper is presented into different segments namely introduction, review of literature, methodology, results and discussions, and conclusion.
Literature Review
Theoretical contribution is significant in explaining a concept, relationship and empirically proving it (Salamzadeh, 2020). According to Samuelson Effect (1973) also called maturity effect, price volatility is more nearing maturity. Andersen (1996) stated that trading returns and volume are influenced by various variables. Coordination of market and state would results in ultimate prosperity for an economy (Roshanaei & Khoramshahi, 2020). Watkins & McAleer (2006) found that spot price, future price, interest rate, stock level variables contained stochastic trends and long run versions of the general model can be estimated, within a co-integration frame work. This paper provides evidence that either of the risk premium and cost of carry models can be applied to each of the LME metals market over different sub samples. Geman & Smith (2012) examined six base metals trade on the LME, based on the relationship between spot and future markets. The study concluded that the spot price did not influence the market players and there was no volatility in inventory. Basoglu et al. (2014) found that the volatility in raw material and product prices have distressed manufacturers and consumers. The London metal exchange is one of the leading future commodity markets of the world. The study concluded that aluminium granger caused other non ferrous metals. Sinha & Mathur (2013) analysed recent global financial crisis and its effect on trading of five base metals and concluded that there was a determination of short term price volatility in daily price of base metal. Since option contracts are priced on the basis of price volatility of underlying asset, copper futures market on the London metal exchange was inefficient and futures prices did not provide unbiased estimates of the future spot prices, both in the long and in the short run. Analysed aluminium and copper price and found relationship between the spot and future price of related metals. The foremost justification behind that was high amount of investment, high risk and lack of awareness. It is the best tool for hedging the risk.
From the literature, it was understood that majority of existing literature studied the Indian commodities and only few studies analysed the base metals. Hence the study aims to analyse the co movement and volatility of daily prices of Indian base metals. Thus the present study has made an attempt to contribute to theoretical implications regarding co-movements of commodity prices.
Methodology
Objective of the Study
The study proposes to investigate the price volatility and co movements of Indian base metal commodities.
Hypotheses of the Study
H01 Daily prices of sample commodity is not stationary
H02 There is no significant volatility in daily prices of sample commodity
H03 There is no co movement among daily prices of sample commodity
The study used secondary data for the analysis. The daily prices of sample commodities, namely, Aluminium, Copper, and Zinc were collected from official website of MCX. The data were related to the period from January 2015 to January 2020, with a total of 1305 observations. Augmented Dickey-Fuller Test, GARCH (1, 1) and Granger Causality Test were used to analyze the unit root of the data, volatility and co-movements of daily prices of sample commodities.
Results and Discussion
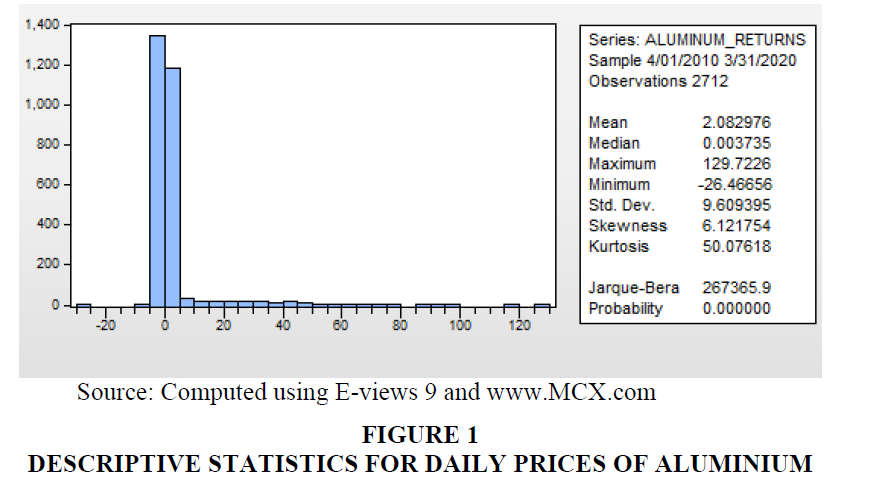
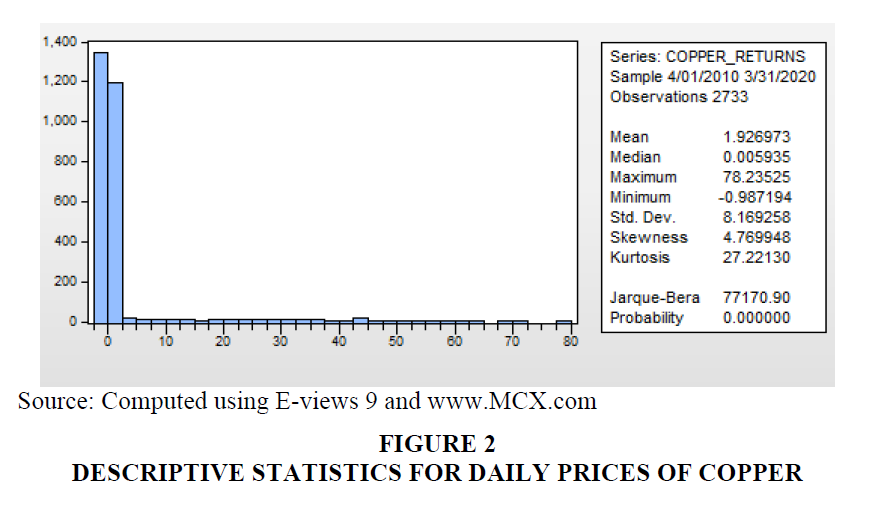
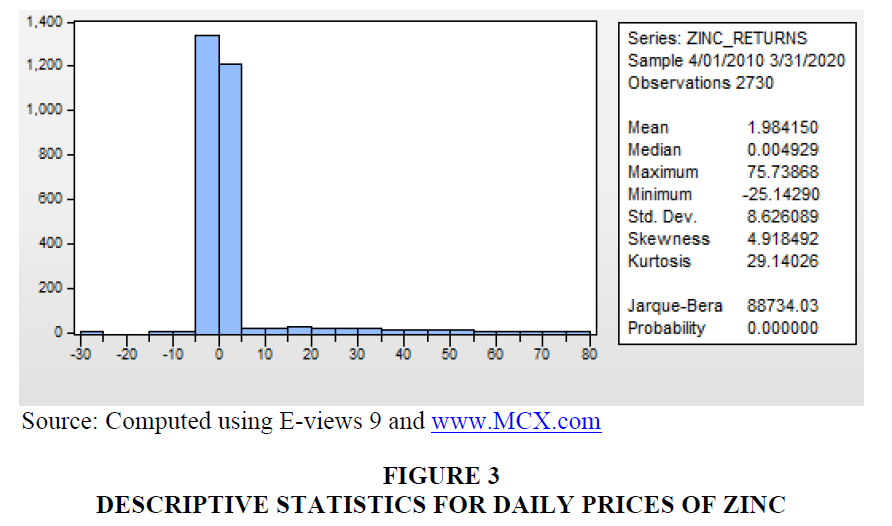
Descriptive Statistics for Daily Prices of Sample Commodities (Figures 1-3).
The mean returns of base metals, during the sample test period, were positive, indicating the fact that base metal returns were positive and average base metal prices had increased over a period of time. The analysis revealed that daily returns of Aluminium (2.082976) recorded the highest returns while returns of Copper (1.926973) recorded the lowest returns during the period of study.
The results of standard deviation of base metals revealed that the daily returns of Aluminium recorded highest risk (9.609395) while the returns of copper (8.169258) recorded the lowest risk.
According to the descriptive statistics, the daily returns of base metals were positively skewed (6.121754 for Aluminium, 4.769948 for Copper, 4.918492 for Zinc), indicating that there was low probability of earning returns, which was higher than the mean value during the period of study.
The Kurtosis of returns of base metals were greater than 3 (50.07618 for Aluminium, 27.22130 for Copper, 29.14026 for Zinc). Hence it was called leptokurtic, associated with peaked and fat tail. In other words, the returns of the indices assume a fat tail. This was further confirmed by Jarque-Bera test statistics.
The Table 1 shows the results of Augmented Dickey- Fuller Test, for daily returns of Aluminium, Copper and Zinc. The results indicated the presence of unit root. The probability value of ADF for all three sample commodities were less than 0.05 (0.0<0.05), indicating stationary. The critical values at 1%, 5% and 10% level were greater than the Augmented Dickey Fuller Test statistic value for all the three sample base metal commodities namely Aluminium (-5.14609), Copper (-4.548496) and Zinc (-5.24607). It confirmed that all the sample base metal commodities daily prices were attained stationarity, at level difference during the study period. Hence the study rejected the null hypothesis NH01 “Daily prices of sample commodity are not stationary, during the study period” (Table 2).
| Table 1 Augmented Dickey-Fuller (Unit Root) Test for Daily Prices of Sample Commodities | |||
| Augmented Dickey-Fuller test statistic | Aluminium | Copper | Zinc |
| -5.14609 | -4.548496 | -5.24607 | |
| 1% Level | -3.43259 | -3.432567 | -3.43259 |
| 5% Level | -2.86241 | -2.863241 | -2.86241 |
| 10% Level | -2.56728 | -2.567275 | -2.56728 |
| Probability | 0 | 0.0002 | 0 |
| Table 2 Results of Garch (1, 1) Model for Daily Prices of Aluminium | ||||
| Variable | Coefficient | Std. Error | z-Statistic | Prob. |
| C | 0.258169 | 0.044584 | 5.790648 | 0.0000 |
| Variance Equation | ||||
| C | 0.031013 | 0.001785 | 17.37607 | 0.0000 |
| RESID(-1)^2 α (ARCH effect) | 0.069747 | 0.001398 | 49.88815 | 0.0000 |
| GARCH(-1) β (GARCH effect) | 0.946908 | 0.000760 | 1245.897 | 0.0000 |
| R-squared | -0.036075 | Mean dependent var | 2.082976 | |
| Adjusted R-squared | -0.036075 | S.D. dependent var | 9.609395 | |
| S.E. of regression | 9.781187 | Akaike info criterion | 5.383164 | |
| Sum squared resid | 259365.8 | Schwarz criterion | 5.391874 | |
| Log likelihood | -7295.571 | Hannan-Quinn criter. | 5.386313 | |
| Durbin-Watson stat | 2.056836 | |||
To explore the volatility, GARCH (1, 1) model was applied to the daily returns of Aluminium. The results of the estimated model are reported in the Table, indicates parameter estimates of the GARCH (1, 1) model were statistically significant (α=0.069747 and β=0.946908). The estimates of β were marked greater than those of α and the sum α+ β (1.016655) was greater than unity. As the lag coefficient of conditional variance β was higher than the error coefficient α it implied that volatility was not spiky at all times. In short, there was low volatility. Further the volatility did not decay speedily and tended to die out slowly and hence shocks will persist in the future period.
The results of the estimated model are reported in the Table 3, which indicates the parameter estimates of the GARCH (1, 1) model were all statistically significant (α=-0.011280 and β=0.458205). The estimates of β were marked greater than those of α and the sum α+ β (0.446925) was less than unity. As the lag coefficient of conditional variance β was higher than the error coefficient α, it implied that volatility was not spiky at all times. In short, there was a low volatility. Further, volatility tended to die out slowly and hence shocks will persist in the future period.
| Table 3 Results of Garch (1,1) Model for Daily Prices of Copper | ||||
| Variable | Coefficient | Std. Error | z-Statistic | Prob. |
| C | 1.823137 | 0.427107 | 4.268569 | 0.0000 |
| Variance Equation | ||||
| C | 36.46365 | 12.72648 | 2.865181 | 0.0042 |
| RESID(-1)^2 α (ARCH effect) | -0.011280 | 0.000524 | -21.52495 | 0.0000 |
| GARCH(-1) β (GARCH effect) | 0.458205 | 0.194321 | 2.357981 | 0.0184 |
| R-squared | -0.000162 | Mean dependent var | 1.926973 | |
| Adjusted R-squared | -0.000162 | S.D. dependent var | 8.169258 | |
| S.E. of regression | 8.169919 | Akaike info criterion | 7.023923 | |
| Sum squared resid | 182354.4 | Schwarz criterion | 7.032577 | |
| Log likelihood | -9594.191 | Hannan-Quinn criter. | 7.027051 | |
| Durbin-Watson stat | 2.160337 | |||
The results of the estimated model are reported in the Table 4, which indicates the parameter estimates of the GARCH (1, 1) model were all statistically significant (α=-0.013482and β=0.470275). The estimates of β were marked greater than those of α and the sum α+ β (0.456793) was less than unity. As the lag coefficient of conditional variance β was higher than the error coefficient α, it implies that volatility was not spiky at all times. In short, there was low volatility. Further, the volatility tended to die out slowly and hence shocks will persist in the future period.
| Table 4 Results of Garch (1,1) Model for Daily Prices of Zinc | ||||
| Variable | Coefficient | Std. Error | z-Statistic | Prob. |
| C | 1.840752 | 0.427384 | 4.307020 | 0.0000 |
| Variance Equation | ||||
| C | 39.77581 | 9.692451 | 4.103792 | 0.0000 |
| RESID(-1)^2 α (ARCH effect) | -0.013482 | 0.000415 | -32.49366 | 0.0000 |
| GARCH(-1) β (GARCH effect) | 0.470275 | 0.131348 | 3.580372 | 0.0003 |
| R-squared | -0.000273 | Mean dependent var | 1.983287 | |
| Adjusted R-squared | -0.000273 | S.D. dependent var | 8.624627 | |
| S.E. of regression | 8.625805 | Akaike info criterion | 7.126949 | |
| Sum squared resid | 203124.3 | Schwarz criterion | 7.135609 | |
| Log likelihood | -9727.849 | Hannan-Quinn criter. | 7.130079 | |
| Durbin-Watson stat | 2.146555 | |||
The results of GARCH (1, 1) model confirmed that prices of all three sample base metals were volatile during the study period. Hence the study rejected the null hypothesis NH02, “There is no significant volatility in daily prices of sample commodity, during the study period”.
The results of Granger Causality Test for Copper, Aluminium and Zinc are displayed in the Table 5. F statistic values for Zinc and Aluminium (5.82521), Aluminum and Zinc (45.7681) were greater than three. It indicated that there was a bidirectional relationship between Zinc and Aluminium, during the study period. Similarly, the F statistic values for Copper and Zinc (11.4462), Copper and Aluminium (5.81640) were also greater than three. In other words, copper reported unidirectional relationship with Zinc and Aluminium, during the study period. The results also proved the probability value is less than 0.05 and the study rejected the Null Hypothesis. NH03, “There are no co-movements among daily prices of sample commodity, during the study period”.
| Table 5 Results of Ganger Casualty Test for Daily Prices of Sample Commodities | |||
| Null Hypothesis | Obs | F-Statistic | Prob. |
| D(COPPER) does not Granger Cause D(ALUMINIUM) | 2710 | 5.81640 | 0.0030 |
| D(ALUMINIUM) does not Granger Cause D(COPPER) | 1.30146 | 0.2723 | |
| D(ZINC) does not Granger Cause D(COPPER) | 2706 | 2.15341 | 0.1163 |
| D(COPPER) does not Granger Cause D(ZINC) | 11.4462 | 1.E-05 | |
| D(ZINC) does not Granger Cause D(ALUMINIUM) | 2706 | 5.82521 | 0.0030 |
| D(ALUMINIUM) does not Granger Cause D(ZINC) | 45.7681 | 3.E-20 | |
Conclusion
The study analysed the movement of metal commodities such as Aluminium, Copper and Zinc prices, during the study period. The daily prices of sample metal commodities were collected and tested by ADF Test, GARCH Model and Granger Causality Test. The results of the study revealed bidirectional relationship between Aluminium and Zinc. The study also found copper to have unidirectional relationship with Aluminium and Zinc, during the study period. It clearly indicated that the price of one metal commodity is based on other metal commodity. The results of GARCH (1, 1) model indicated that prices of all the sample base metal commodities were volatile during the study period. The results of the present study are in agreement with the results of Sinha & Mathur (2013) and Basoglu et al. (2014). The present study has practical implications by providing useful inputs to the investors in commodity markets. Hence investors should consider all the commodity prices, while investing their money in commodity markets.
References
- Alquist, R., Bhattarai, S., & Coibion, O. (2014).Commodity-price comovement and global economic activity(No. w20003). National Bureau of Economic Research.
- Andersen, T.G. (1996). Return volatility and trading volume: An information flow interpretation of stochastic volatility.The Journal of Finance,51(1), 169-204.
- Antonakakis, N., & Kizys, R. (2015). Dynamic spillovers between commodity and currency markets.International Review of Financial Analysis,41, 303-319.
- Basoglu, M.S., Korkmaz, T., & Cevik, E.I. (2014). London metal exchange: Causality relationship between the price series of non-ferrous metal contracts.International Journal of Economics and Financial Issues,4(4), 726.
- Byrne, J.P., Cao, S., & Korobilis, D. (2019). Decomposing global yield curve co-movement.Journal of Banking & Finance,106, 500-513.
- Daskalaki, C., Kostakis, A., & Skiadopoulos, G. (2014). Are there common factors in individual commodity futures returns?.Journal of Banking & Finance,40, 346-363.
- Geman, H., & Smith, W.O. (2012). Shipping markets and freight rates: an analysis of the Baltic Dry Index.The Journal of Alternative Investments,15(1), 98-109.
- Roshanaei, N., & Khoramshahi, N. (2020). Government intervention in free markets: The shipping industry.Journal of Entrepreneurship, Business and Economics,8(1), 180-203.
- Salamzadeh, A. (2018). Start-up boom in an emerging market: A niche market approach. InCompetitiveness in emerging markets(pp. 233-243). Springer, Cham.
- Salamzadeh, A. (2020). What constitutes a theoretical contribution?.Journal of Organizational Culture, Communications and Conflict,24(1), 1-2.
- Samuelson, P.A. (1973). Proof that properly discounted present values of assets vibrate randomly.The Bell Journal of Economics and Management Science, 369-374.
- Sinha, P., & Mathur, K. (2013). A study on the price behavior of base metals traded in India.
- Watkins, C., & McAleer, M. (2006). Pricing of non-ferrous metals futures on the London metal exchange.Applied Financial Economics,16(12), 853-880.


