Research Article: 2018 Vol: 17 Issue: 3
Strategy Model for Creating the Corporate Advantage of Indonesian Airlines
Suharto Abdul Majid, Trisakti Institute of Transportation Management
Keywords
Market Attractiveness, Resource Capability, Market-Driven Strategy, Corporate Advantage, Indonesia’s Airline Industry.
Introduction
Every airline company expects to have a high level of corporate advantage for their business competition. Corporate advantage can be created through market-driven strategy based on market attractiveness and resource capability. In general, the corporate advantage of Indonesian airlines has not been optimal if compared with the foreign airlines in the aspects of flight punctuality, profit gain, or flight safety and security. In fact, Indonesia’s domestic market has very high potential and attractiveness.
This phenomenon is reflected by the domestic airlines’ performance in their operation and flight service: unachieved target, highly frequent delay, frequent complaints and fairly frequent flight accidents. These, in turn, reflect that national airlines lack excellence in the aspects of product quality, innovation, business growth, and corporate image, contrast with the high market potential. This condition indicates that they do not implement market-driven corporate strategy based on market attractiveness and resource capability.
Based on the number of passengers and aircrafts, Indonesia’s airline industry is one of the air transports with the highest growth in Asia Pacific and in the world (Airlines business, 2008 & 2009). With 17,500 islands divided into three different time zones, Indonesia has been acknowledged by International Air Transport Association (IATA) as one of the five airline markets with the fastest growth of passengers in the world (INACA, 2016).
Despite the global economic crisis, Indonesia still gives hope for the growth of aircraft passengers as projected by the growing demand for air transport. The problem is that Indonesia’s national airlines have a high competitiveness but they are unable to exploit the high market attractiveness and resource capability as the basis for implementing market-driven strategy to achieve the corporate advantage.
In the variable of market-driven strategy, the problem is that not all Indonesia national airlines implement it appropriately and effectively, so they cannot achieve the optimal target.
Bibliographical Review
Referring to Thomas et al. (2015); David (2011), strategic management contains two important things:
1. It consists of three types of management process, namely strategy formulation, strategy implementation, and strategy evaluation.
2. It focuses on unifying or combining the business aspects of marketing, research and development, finance/accounting and production/operation.
The theory related to air transport management refers to Gubbins (2009); Shaw (2011); Doganis (2006); Wells (1999); Heracleous et al. (2009); Thomas & Catlin (2014).
There are three airline business models in the corporate level (Heracleous et al., 2009):
1. Traditional integrated airlines model.
2. Virtual airlines model.
3. Aviation business model.
Furthermore, there is a change of future airline business model. According to Thomas & Catlin (2014), airline business competition is divided into three main models: Full Service Carriers (FSCs), Low Cost Carriers (LCCs) and hybrid LCC (combination of FSC and LCC).
The theory of market attractiveness refers to Nova (2014); Porter (1996); Best (2005); Cravens & Piercy (2006); Cromley et al. (1993); Walker et al. (1995).
The theory of resource capability refers to Protogerou et al. (2008), Barney & Clark (2007); Amit & Schoemaker (1993); Schreyogg & Eberl (2007); Hitt et al. (2007); Cigler (2007); Kusumasari et al. (2010).
The theory of market-driven corporate strategy refers to Collis & Cynthia (2005); Cravens & Piercy (2006 & 2009); Best (2007); Narver & Slater (1990). Marketing strategy process is the stage of strategic situation analysis to identify market opportunity, define the market segments, evaluate the competition, and assess the organization’s strengths and weaknesses. Market sensing plays the key role in designing marketing strategy, which includes targeting and positioning, developing market relationship, as well as developing and introducing new products.
The theory of corporate advantage refers to Collis & Cynthia (1998 & 2005); Rozemeijer (2003); Chen & Chang (2013) where corporate advantage can be considered as the result of synergic cooperation among business units. Barney (1991); Coyne (1986); Porter (1985); Rozemeijer (2000), state that corporate advantage can be achieved through a synergy. Steininger et al. (2011) examined the existence of business model concept for studying competitive advantages by integrating resources and market-based perspective.
Research Methods
This research is descriptive and verificative through data collection, so the methods are descriptive survey and explanatory survey. The data analysis technique used is PLS-based SEM.
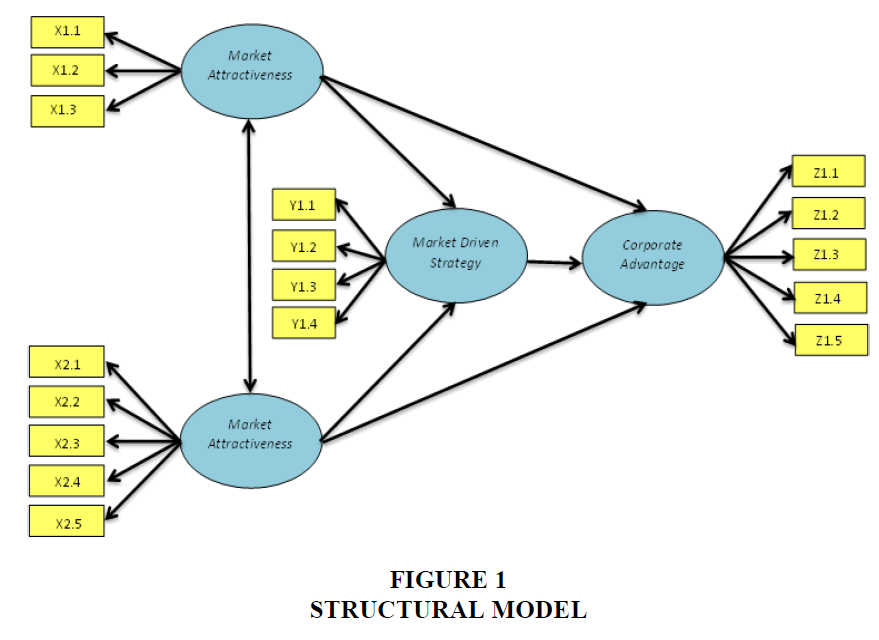
The population or analysis unit of this research is all the existing national airlines in Indonesia. The observation unit comprises 30 top managers of Indonesia’s domestic airlines. PLS analysis consists of two models: measurement model (outer model) and structural model (inner model). Measurement model shows how manifest variable or observed variable represents the latent variable to be measured whereas structural model shows the strength of estimation among latent variables or constructs.
Complete structural model can be seen in the following Figure 1:
All these four quantitative hypotheses are partially tested by comparing t-statistic with t-table at α=0.05 (1.96) and simultaneously tested by comparing F-statistic with F-table.
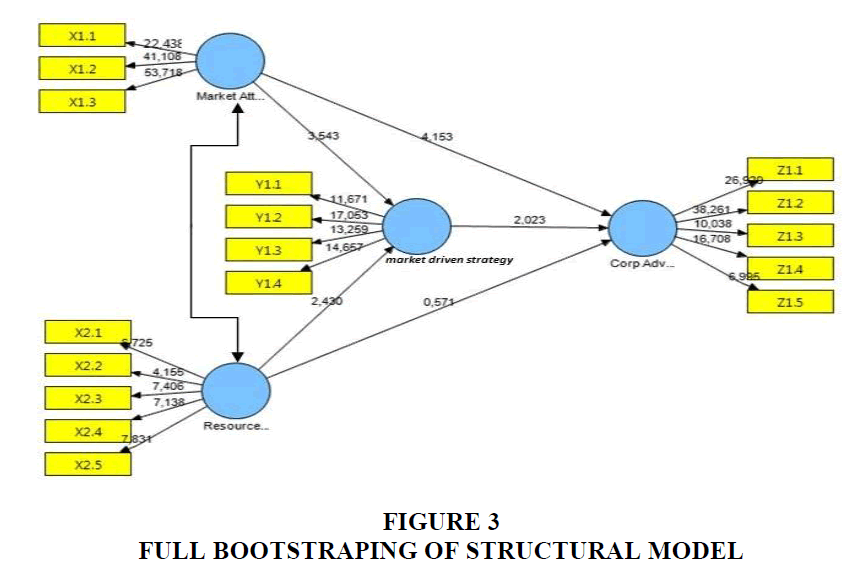
The estimated value of path relationship must be significant. The value of significance can be obtained through the bootstrapping procedure. The significance of the hypothesis can be seen through the coefficient value of parameter and the significance value of T-statistic in the bootstrapping report.
Result Of Research And Discussion
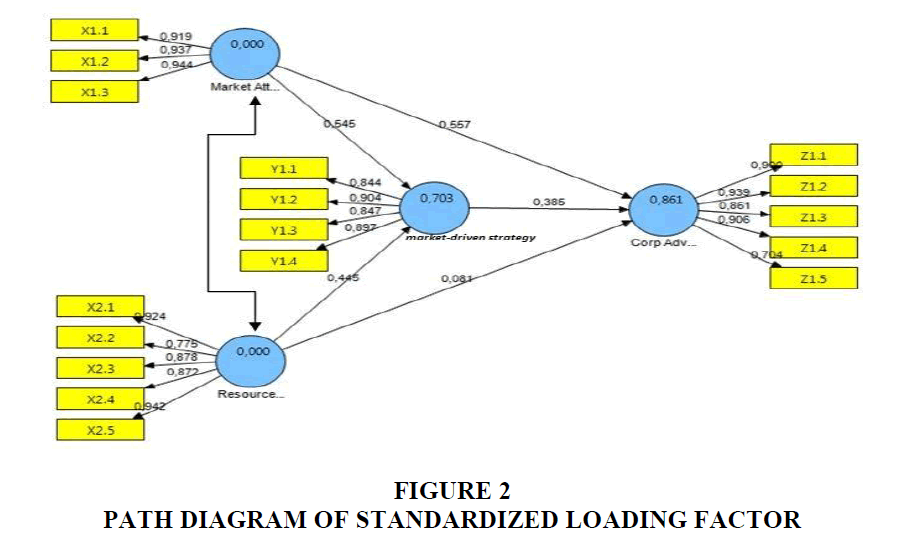
The calculation of full model is hypothesized as follows Figure 2:
Structural model represents the relationship among latent variables. It involves two exogenous latent variables (market attractiveness and resource capability), one intervening latent variable (market-driven strategy), and one endogenous latent variable (corporate advantage).
The result of bootstrapping calculation for each variable is presented in the following Figure 3.
The structural model test is carried out in the following steps with the value of R-square as presented in Table 1.
| Table 1: Result Of R Square | |||||
| Model | Path | Path Coefficient (Standardized) | t-statistic | Conclusion | R-square |
|---|---|---|---|---|---|
| First | X1 → Y | 0.545 | 3.543 | Significant | 0.703 |
| X2 → Y | 0.445 | 2.430 | Significant | ||
| Second | X1 → Z | 0.557 | 4.153 | Significant | 0.861 |
| X2 → Z | 0.081 | 0.571 | Not Significant | ||
| Y → Z | 0.385 | 2.023 | Significant | ||
Source: Primary data processed, 2017
The Influence of Market Attractiveness and Resource Capability on Market-Driven Strategy in Indonesia’s Airline Business
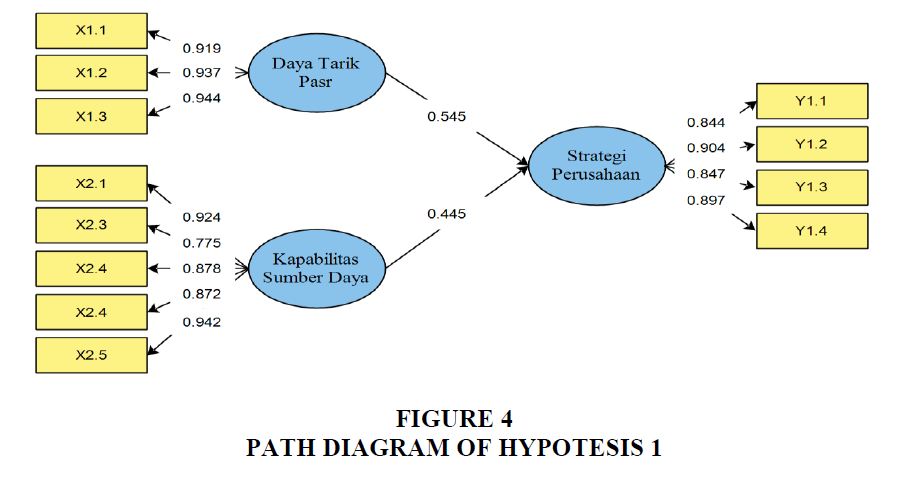
The first hypothesis (H1) examines the influence of Market Attractiveness and Resource Capability on Market-Driven Strategy both simultaneously and partially (see Figure 4).
The structural model for the above diagram is:

Simultaneous Influence
The test on the simultaneous influence of Market Attractiveness and Resource Capability on Market-Driven Strategy is done through F test by using the following formula.
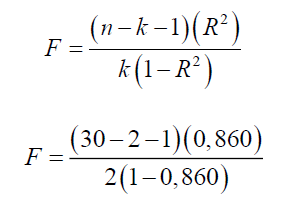
Fcal=31.955
With α=5% and df1=k=2, df2=n-k-1=30-2-1=27 the value of Ftable is obtained ± 3.354.
Based on the calculation, the value of Fcal is 31.955 which are bigger than Ftable (3.354). Hypothesis 3 (H3) is accepted, Market Attractiveness and Resource Capability simultaneously influence the Market-Driven Strategy in Indonesia’s airline industry.
Partial Influence of Market Attractiveness on Market-Driven Strategy
The path coefficient of Market Attractiveness variable on Market-Driven Strategy is 0.545 with positive direction (Table 2). The higher the Market Attractiveness the more it will improve the Market-Driven Strategy. This hypothesis is accepted because t statistic 3.543>1.96 (at significance of 5%), meaning that Market Attractiveness significantly influences the Market- Driven Strategy in Indonesia’s airline industry.
| Table 2: Result Of Simultaneous And Partial Tests On Hypothesis1 | ||||||
| Hypothesis | Fcalculation | g | SE | Tstatistic | R2 | Remarks |
|---|---|---|---|---|---|---|
| Market Attractiveness and Resource Capability ® Market-Driven Strategy | 31.95* | 0.703 | Significant | |||
| Market Attractiveness ® Market-Driven Strategy | 0.545 | 0.153 | 3.543* | 0.540 | Significant | |
| Resource Capability ® Market-Driven Strategy | 0.445 | 0.183 | 2.430* | 0.459 | Significant | |
*Significant at α=0.05
Source: Primary Data processed, 2017.
Furthermore, the influence of Resource Capability on Market-Driven Strategy is tested. The path coefficient is 0.445 with positive direction (Table 2). The higher Resource Capability the more it will improve Market-Driven Strategy. This hypothesis is accepted because t statistic 2.430>1.96 (α=5%), meaning that Resources Capability significantly influences the Market- Driven Strategy in Indonesia’s airline industry.
The Influence of Market Attractiveness and Resource Capability on Corporate Advantage in Indonesia’s Airline Business
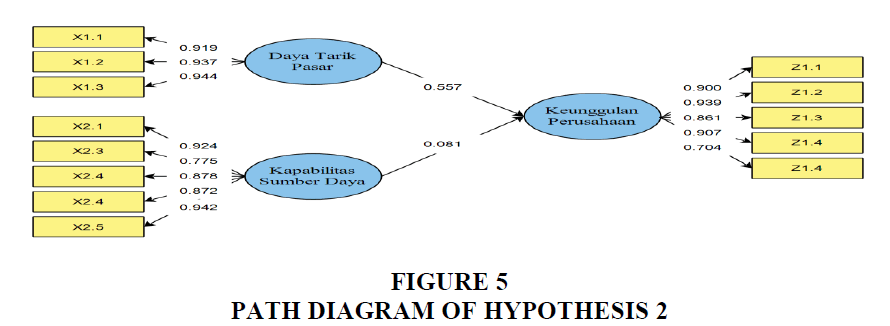
The second hypothesis examines the influence of Market Attractiveness and Resource Capability on Corporate advantage both simultaneously and partially (Figure 5).
The structural model for the above diagram is: η1=0.557ξ1+0.081ξ2+ζ 2
Simultaneous Influence
The simultaneous influence of market attractiveness and resource capability on corporate advantage is tested through F test by using the following formula.
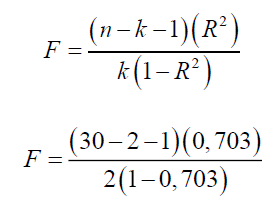
F calculation = 82.928
At α=5% and df1=k=2, df2=n-k-1=30-2-1=27 the value of Ftable is obtained ± 3.354.
The value of F calculation is obtained 82.928>Ftable (3.354), then Hypothesis 3 (H3) is accepted: Market Attractiveness and Resource Capability simultaneously influence the Corporate Advantage in Indonesia’s airline industry.
Partial Influence
The path coefficient of Market Attractiveness variable on Corporate Advantage amounting 0.557 with positive direction (Table 3). The higher the Market Attractiveness the more it will enhance the Corporate Advantage. This hypothesis is accepted because t-statistic 4.153>1.96 (α=5%) meaning that Market Attractiveness significantly influences the Corporate Advantage in Indonesia’s airline industry.
| Table 3: Result Of Simultaneous And Partial Tests On Hypothesis2 | ||||||
| Hypothesis | F calculation | g | SE | T statistic | R2 | Remarks |
|---|---|---|---|---|---|---|
| Market Attractiveness and Resource Capability ® Corporate advantage | 82.93* | 0.860 | Significant | |||
| Market Attractiveness ® Corporate advantage | 0.557 | 0.134 | 4.153* | 0.763 | Significant | |
| Resource Capability ® Corporate advantage | 0.081 | 0.141 | 0.571 | 0.335 | Not Significant | |
*Significant at α=0.05
Source: Primary data processed, 2017.
The next tested is the influence of Resource Capability on Corporate Advantage. As presented in Table 4 we can see the path coefficient is 0.081 with positive direction. The higher the Resource Capability the more it will enhance the Corporate Advantage. This hypothesis is rejected because t-statistic 0.571<1.96 (α=5%), meaning that the test result is not significant or Resource Capability does not significantly influence the Corporate Advantage in Indonesia’s airline industry.
| Table 4: Result Of Partial Hypothetical Test Hypothesis 3 | |||||
| Hypothesis | g | SE | T statistic | R2 | Remarks |
|---|---|---|---|---|---|
| Market-driven strategy®Corporate advantage | 0.385 | 0.190 | 2.023* | 0.148 | Significant |
*Significance at α=0.05
Source: Primary data processed, 2016
The Influence of Market-Driven Strategy on the Corporate Advantage in Indonesia’s Airline Industry
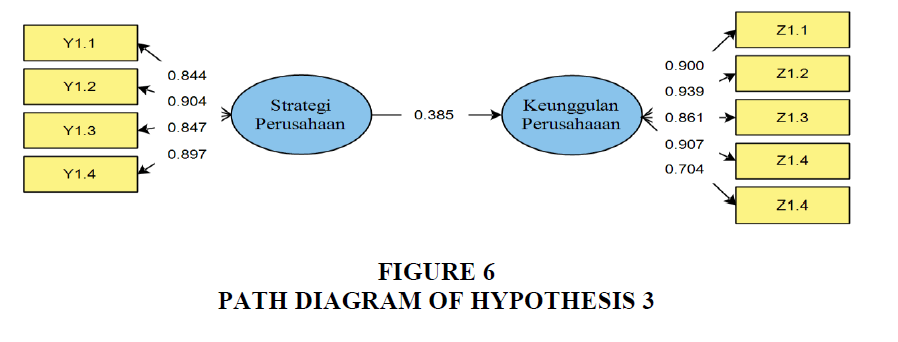
The third hypothesis examines the influence of Market-Driven Strategy on Corporate Advantage (Figure 6).
The structural model for the above figure is:

Hypothesis 3 (H3) test examines the influence of Market-Driven Strategy on Corporate Advantage. As seen in Table 4, the path coefficient is 0.385 with positive direction. The higher the Market-Driven Strategy the higher it will enhance Corporate Advantage. Hypothesis 3 can be accepted since t statistic 2.023>1.96 (α=5%), meaning that the result is significant or Market-Driven Strategy significantly influences the corporate advantage in Indonesia’s airline industry.
| Table 5: Direct And Indirect Influences (Mediation) | ||||
| Relationship | Direct Influence | Indirect Influence through Y | Total Influence | t statistic |
|---|---|---|---|---|
| X1 → Y | 0.545 | - | 0.545 | 3.543 |
| X2 → Y | 0.445 | - | 0.445 | 2.430 |
| X1 → Z | 0.557 | 0.210 | 0.766 | 8.351 |
| X2 → Z | 0.081 | 0.171 | 0.252 | 2.118 |
| Y → Z | 0.385 | - | 0.385 | 2.023 |
Source: Primary data processed, 2016.
The Influence of Market Attractiveness and Resource Capability on Corporate Advantage through Market-Driven Strategy in Indonesia’s Airline Industry
The fourth hypothetical test can be described from the direct and indirect influences.
Simultaneous Influence
The influence of Market Attractiveness and Resource Capability on Corporate Advantage is simultaneous and in partial through Market-Driven Strategy. The test is through F test by using the following formula.
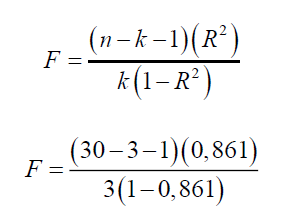
F calculation=53.683
At α=5% and df1=k=3, df2=n-k-1=30-3-1=26, F table is obtained ± 2.975.
F calculation is obtained 53.683>F table (2.975), then hypothesis 4 can be accepted. It means Market Attractiveness and Resource Capability influence Corporate Advantage both simultaneously and partially through Market-Driven Strategy.
Partial Influence
The influence of Market Attractiveness on Corporate Advantage through Market-Driven Strategy is presented in Table 5. The total path coefficient is 0.766 with positive direction. The higher the Market Attractiveness mediated by Market-Driven Strategy the higher it will enhance Corporate Advantage. This hypothesis is accepted because t-statistic is 8.351>1.96 (α=5%) meaning that Market Attractiveness significantly influences Corporate Advantage through Market-Driven Strategy.
The influence of Resource Capability on Corporate Advantage through Market-Driven Strategy is presented in Table 5. The total path coefficient is 0.252 with positive direction. The higher the Resource Capability mediated by Market-Driven Strategy the higher it will enhance Corporate Advantage. This hypothesis is acceptable because t-statistic is 2.118>1.96 (α=5%) meaning that Resource Capability significantly influences Corporate Advantage through Market- Driven Strategy.
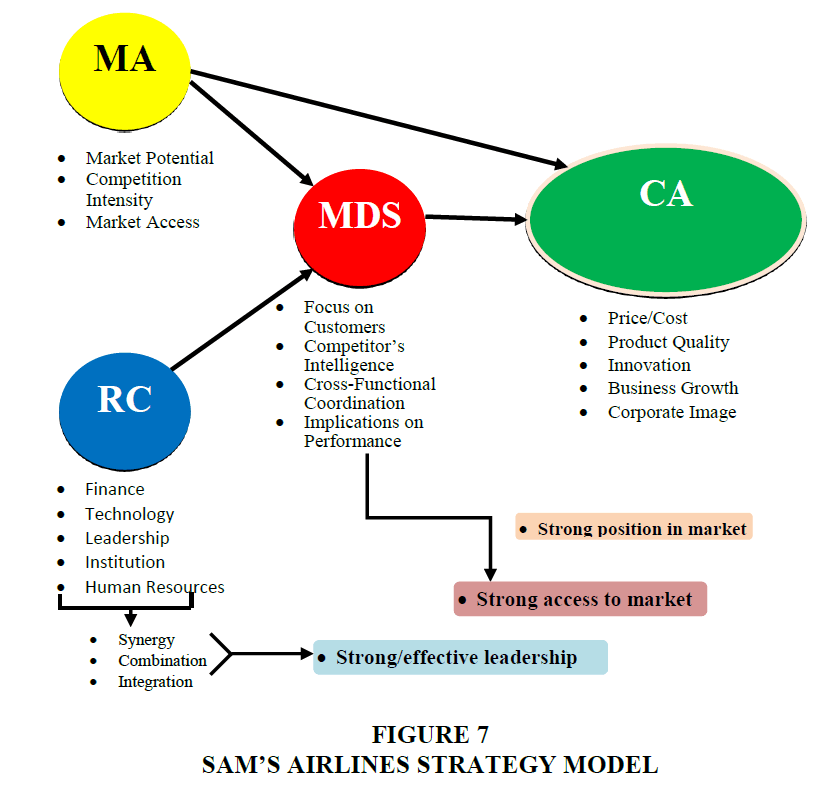
Based on these results, the author describes the model of research on the Strategy for Creating Airline Corporate Advantage through Market-Driven Strategy as follows(Figure 7):
It can be explained that airline Corporate Advantage is significantly influenced by:
1. Market attractiveness and market-driven strategy both simultaneously and partially.
2. Market attractiveness, both directly and indirectly through market-driven strategy.
3. Market attractiveness, resource capability, and market-driven strategy simultaneously.
4. Resource capability indirectly through market-driven strategy.
The author believes, in order to establish excellent Indonesia’s airline companies with sustainable competitive advantages, Indonesia’s national airline companies must be able to implement the Market-Driven Strategy (MDS) appropriately and effectively.
Conclusions
Market Attractiveness and Resource Capability, both simultaneously and partially, give positive and significant influence on Market-Driven Strategy in Indonesia’s airline industry. Market Attractiveness dominantly influences the formulation of market-driven corporate strategy, where the market potential shows positive things and is well responded by airline companies. Market-Driven Strategy is also influenced by Resource Capability dominantly reflected by the dimensions of institution and human resources.
Market Attractiveness and Resource Capability simultaneously give positive and significant influence to the Corporate Advantage in Indonesia’s airline industry, but in partial Resource Capability does not influence Corporate Advantage. Market Attractiveness dominantly influences the creation of national airline’s Corporate Advantage, which is affected and formed by the existing high Market Attractiveness.
Market-Driven Strategy positively and significantly influences the Corporate Advantage of Indonesia’s airline industry. An excellent company can be created through the appropriate and effective formulation and implementation of Market-Driven Strategy supported by Market Attractiveness and Resource Capability.
Market Attractiveness and Resource Capability positively and significantly influence Corporate Advantage through Market-Driven Strategy in Indonesia’s airline industry. Market Attractiveness dominantly influences Corporate Advantage through Market-Driven Strategy. However, three dimensions of Market Attractiveness, i.e. market potential, competition intensity, and access to market, are not responded optimally by Resource Capability, especially in the dimensions of leadership, institution, and human resources.
Market-Driven Strategy, as the intervening variable, has a very important and decisive role for realizing Corporate Advantage.
References
- Airlines business (2008). Turbulence in booming Indonesia: Indonesia’s third largest carrier has shut down but his country’s domestic market remains healthy and promising. Edition May.
- Airlines business (2009). World airlines rankings. Edition August.
- Amit, R. & Schoemaker, P.J.H. (1993). Strategic assets and organizational rent. Strategic Management Journal, 14(1), 33-46
- Barney, J. (1991). Firm resources and sustained competitive advantage. Journal of Management, 17(1), 99-120.
- Barney, J.B. & Clark, D.N. (2007). Resource-based theory creating and sustaining competitive advantages. Oxford: Oxford University Press.
- Best, R.J. (2005). Market-based management. Prentice Hall, Upper Saddle River
- Best, R.J. (2007). Market-based management, (Sixth Edition). Prentice Hall, Upper Saddle River
- Chen, Y.S. & Chang, C.H. (2013). Towards green trust: The influences of green perceived quality, green perceived risk, and green satisfaction. Journal of Management Decision, 51(1), 63-82.
- Cigler, B.A. (2007). Post-Katrina emergency management: Forum overview. Public Manager, 36(3).
- Collis, D.J. & Cynthia, A.M. (1998). How can you tell if your company is really more than the sum of its parts! Creating corporate advantage. Harvard Business Review, 72-73.
- Collis, D.J. & Cynthia, A.M. (2005). Corporate strategy: A resource-based approach. Irwin.
- Coyne, K.P. (1986). Sustainable competitive advantage-what it is, what it isn’t. Business horizons.
- Cravens, W.D. & Piercy, F.N. (2006). Strategic marketing. New York: McGraw Hill.
- Cravens, W.D. & Piercy, F.N. (2009). Strategic marketing, (Ninth Edition). New York: McGraw Hill.
- Cromley, R.G., Hempell, D.J. & Hillyer, C.L. (1993). Dimensions of market attractiveness: Competitively interactive spatial models. Journal of Decision Sciences institute, 24(4), 713-738.
- David, R.F. (2011). Strategic management concepts and cases, (Thirteenth Edition). New Jersey: Prentice Hall
- Doganis, R. (2006). The airlines business, (Second Edition). Routledge, 2 Park Square, Milton Park, Abingdon, Oxon, Canada: Routledge.
- Gubbins, J.E. (2009). Managing transport operations, (3rd Edition). London, UK: Kogan Page and the Chartered Institute of Logistics and Transport.
- Heracleous, L., Wirtz, J. & Pangarkar, N. (2009). Flying high in competitive industry secrets of the world’s leading airline. Singapore: McGraw Hill Education.
- Hitt, A.M., Hoskisson, E.R. & Ireland, R.D. (2007). Management of strategy. Thomson, South-Western.
- INACA (2016). Annual report of Indonesia national air carrier association 2016. Jakarta: INACA.
- Kusumasari, B., Alam, Q. & Siddiqiu, K. (2010). Resources capability for local government in managing disasters. Journal of Disaster Prevention and Management, 19(4), 438-451.
- Narver, J. &. Slater, S. (1990). The effect of a market orientation on business performance. Journal of Marketing, 5(4), 20-35.
- Nova, F. (2014). The influence of market attractiveness and core competence on value creation and competitive advantage and its implication on business performance (A study at pay TV industry in Indonesia). International Journal of Education and Research, 2(8).
- Porter, M.E. (1985). Technology and competitive advantage. Journal of Business Strategy, 5(3), 60-78.
- Porter, M.E. (1996). What is strategy? Harvard Business Review, 74(6), 61-78.
- Protogerou, A., Caloghirou, Y. & Lioukas, S. (2008). Dynamic capabilities and indirect impact on firm performance. DRUID 25th Celebration Conference 2008.
- Rozemeijer, F.A. (2000). Creating corporate advantage in purchasing. Eindhoven: Technische Universiteit Eindhoven.
- Rozemeijer, F.A. (2003). Creating corporate advantage in purchasing. Technische Universiteit Eindhoven.
- Schreyogg, G. & Eberl, M.K. (2007). How dynamic can organizational capabilities be? Towards a dual-process model of capability dynamization. Strategic Management Journal, 28(9), 913-933.
- Shaw, S. (2011). Airline marketing and management (Seventh Edition). England: ASHGATE.
- Steininger, D.M., Huntgeburth, J.C. & Veit, D.J. (2011). Conceptualizing business models for competitive advantage research by integrating the resource and market-based view. AMCIS 2011.
- Thomas, J. & Catlin, B. (2014). Aviation insights review: The future of airlines business model-Which will win? Singapore: LEK Consulting LLC.
- Thomas, L.W., Hunger, D.J., Hoffman, N.A. & Bamford, E.C. (2015). Strategic management and business policy globalization, innovation and sustainability, (Fourteenth Edition). England: Pearson Education Limited.
- Walker, O., Boyd, H. & Larreche, J.C. (1995). Marketing strategy: Planning and implementation. Chicago: R.D. Irwin.
- Wells, A.T. (1999). Air transportation a management perspective. London: International Thomson Publishing Europe.
