Research Article: 2018 Vol: 19 Issue: 3
RIA System Evaluation by Means of Composite Indicators
Mauro Visaggio, University of Perugia
Abstract
Keywords
Structure and Scope of Government, Regulatory Policy, RIA, Indicators.
Introduction
Regulation, in common knowledge, is considered as a crucial pivotal in the achievement of final goals such as sustainable growth and employment. For instance, the financial crisis of 2008 has clarified how “bad” (de)regulations or delays in the adoption of “good” regulation of financial markets have heavily influenced the economic performance in the real world over the last decade. Given the key role of regulation, over the last decades, Regulation Impact Assessment Program (hereinafter referred to as RIA) has become (or rather, should become) a key policy tool in the regulatory process by providing an institutional, organizational and decision making structure for implementing regulatory proposals and assessing their impact. At first, the RIA has been developed in the United States in the early seventies and, then, spread to the Anglo-Saxon countries. Subsequently, starting from the second half of the nineties, the development of RIAs in the countries started to proceed at a faster pace when the European Commission embraced the RIA and, at the same time, exerted strong pressure on the member countries to implement it (Renda, 2006; Jacobs, 2006). Furthermore, during the last decade, international organizations have strongly recommended to a number of developing and transition countries to adopt the use of RIA in order to manage the regulatory process (World Bank, 2010).
From the practices already implemented in the most industrialized countries of the OECD, a stylized fact emerges clearly: a significant difference between countries both in the implementation of the RIA and in the dynamics that, in turn, reflect the differences in the quality of the RIA. On the one hand, very few countries have regularly implemented the RIA process within their regulatory policy and have produced outputs in quantity and good quality. Regarding the latter, the best RIA practices show quite clearly how the RIA takes a relatively long time to work properly and effectively because it must go through several stages of change. On the other hand, some countries have not yet begun the RIA process although have already fixed the system. Given the scarcity of the RIA output, in these countries the assessment of the quality of output loses all meaning and, moreover, the use of the RIA fails to materialize. In turn, since in the more advanced countries the RIA dynamic keeps pace faster than the countries lagging behind, the differences in the implementation of the RIA between countries increase over time (Radaelli, 2005:2009).
On the theoretical ground, current literature has examined the scarce results of implementation of RIA in many countries. Some scholars have shown how contextual variables- such as institutional, organizational and political context-prevent RIA from working properly (Sager & Rissi, 2011; Peci & Sobral, 2011; Radaelli, 2005; OECD, 2008). Others scholars have drawn attention to another factor that undermines the effectiveness of RIA program i.e., the evaluation of RIA impact (White, 2009; Stame, 2010). Some others researchers have focused mainly on compliance testing to verify whether RIA proposals were performed according to the national formal procedures (Hahn et al., 2000; Harrington & Morgenstern, 2004). This is because the evaluation research has become a crucial aspect in the innovative countries. Indeed, in these countries, the quality of evaluation is important in view of the scale of output yielded from the program, while, assessing the quality of the system is considered unnecessary. Finally, few papers attempt to design a set of indicators that should work with tests for a larger assessment of the quality of the program (Radaelli, 2003). But in this case, since quality indicators are mainly designed to reduce the several variables that underpin the RIA program, a lot of useful information for evaluation is lost during the aggregation process. A lot of these issues have been, finally, assessed in Dunlop & Radaelli (2017).
This paper has a twofold aim. First, it defines the phenomenon to be measured by developing a RIA conceptual framework. Having fulfilled these task individual indicators - which detail the different RIA dimensions can be recorded in this framework straightforward. Second, after transforming row individual indicators into normalized individual indicators, it finally obtains the RIA quality aggregate composite indicator by an ascending four phase’s sequence of aggregations (normalized indicators → sub-dimensions → dimensions →steps → program).
This paper in section 2 sketches a RIA conceptual framework; in section 3 and 4 examines in detail the two part of RIA i.e., the implementation and the evaluation, the interrelationships between their several components and, accordingly, identifies their key dimensions; in section 5 analyses RIA in a dynamic perspective by describing the different phases of the RIA evolutionary process; finally, in section 6, proposes the RIA quality aggregate composite indicator defined as the sum of the key composite indicators representing the three steps of the implementation part.
A Conceptual Framework Of RIA
The definition of a conceptual framework of RIA is a difficult task. On the one hand, empirical analysis shows how the spectrum of RIA programs is hard to integrate in a general framework. On the other hand, theoretical analysis points out how the division of RIA into key dimensions is not clear-cut because many aspects overlap each other’s. Despite that, the definition of the phenomenon under study and measurement is the first step towards building RIA quality composite indicator (Nardo et al., 2005). In defining the conceptual framework, it is worth pointing out that even the positive and normative analysis interweave with each other. In other words, taking cue from real world we try to explain conceptually what RIA is but, for some issues, we attempt to suggest what the RIA should be for proper operation. Furthermore, the definition of the general framework is not bounded by the current available data but, instead, tries to suggest what data are needed to carry out a sound program quality evaluation.
According to a generally accepted definition, RIA is a tool used by governments for the management of regulatory policy. Although this definition generates a broad consensus, it is of little practical use because of its generality. The subsequent refinement of the RIA definition, however, clashes with different analytical issues.
First, the multidimensional nature of RIA-that is, economic, historical, political and legal-implies that different disciplines enter the field of analysis and, in turn, that different perspectives and methodological approaches are involved in the research. Second, RIA shows an intrinsic dynamic nature that generates a continuous process of refinement upon its fundamental dimensions that, in turn, produces a rapid obsolescence of any presumed conclusive definition. Thirdly, the differences between countries in the implementation of the program is reflected in country-centric definitions namely in the inclination to define the RIA on the basis of specific national programs.
Taking into account these general issues, at a conceptual level and in a dynamic perspective, RIA program is defined as a circular structure composed of two parts namely, implementation and evaluation which possibly, sooner or later, starts to spin illustrated in Figure 1. The starting point of the circle RIA is the assembling of inputs i.e., the instrumental variables that a government in a given historical and political context adopts in order to influence the regulatory legislation (system phase); the second step is the choice of the intermediate variables (process phase) and the last phase consists in affecting the real world variables-the final variables-in order to ensure accountability and transparency of decision-making process (outcomes phase). In Sections 2 and 3, we discuss the contents of the pivotal dimensions of the RIA parts in greater detail and, at the same time, we record individual elements and/or indicators that are the cornerstones of the implementation part.
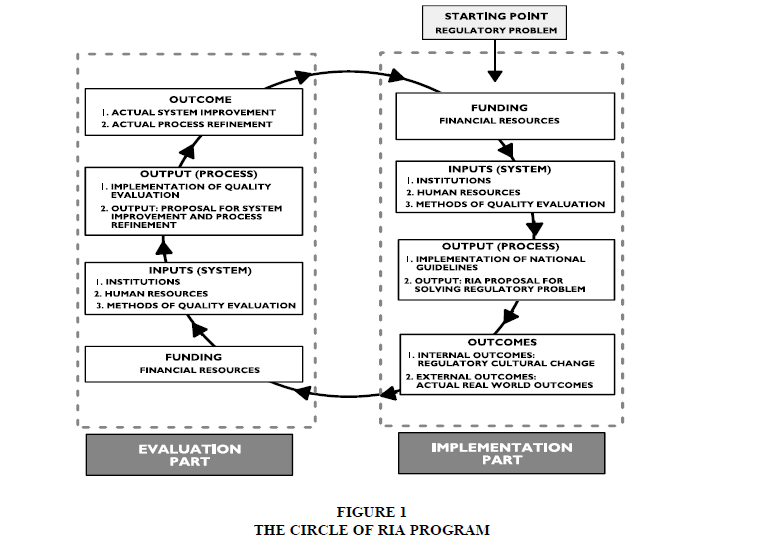
Figure 1: The Circle Of Ria Program
The Implementation Part: The Start of RIA “Circle”
The design of the implementation part is the first phase of the RIA circle and proceeds in three steps: input, output and results. Tables 1-3 summarize the design of RIA program and the different phases of its dynamic evolution. At the base, the capacity and development of the RIA are limited by the financial resources invested in the implementation of the program. In fact, the costs of implementing the program are subject to a budget constraint which conditions and limits the training, implementation and, ultimately, the development of the system. Monetary resources are the financial dimension of the inputs used, that is, the right side of the RIA budget constraint. Therefore, they cannot be added to inputs in order to avoid double counting.
| PROGRA Table 1 RIA Program Design And Dynamic Phase |
||||
| Static Design | Indicators | Dynamic Phase | ||
| Financing Program |
Financial Resources | Financial Effort Index |
||
| Step | Implementation | Evaluation | ||
| Dimension | ||||
| INPUT System design by input combination |
Institution | Institution |
|
READINESS
|
| Human resources | Human resources |
|
||
| National formal guidelines | Approaches to quality evaluation |
|
||
| OUTPUT | USAGE | |||
|
|
|
||
| OUTCOME | IMPACT | |||
| INTERNAL Interrelationship between output proposal with policy makers | INDIVIDUAL PROPOSALS
|
Evaluation proposal to improve system and refine process | Compliance national guidelines with benchmarking |
|
Program
|
Effectiveness of output | |||
| EXTERNAL | ||||
| DEMOCRACY | Accessibility and transparency decision making process | Accessibility and transparency of output and consultation indexes |
||
REAL WORLD
|
Effects on real world:
|
Effectiveness of output | ||
| Table 2 RIA Program Design And Dynamic Phase: Input Stepsteps |
|||
| Steps Dimensions Sub-Dimensions |
Row Individual Indicators & Variables | Normalized Individual Indicators | Sub Composite & Composite Indicators |
| FUNDING | |||
| RIA financial resources | RIA expenditures index |  |
|
| 1. INPUT STEP |  |
||
| 1.1INSTITUTIONS |  |
||
| Institution executing RIA |
Central government |  |
 |
| Sub-central government |  |
||
| Independent agencies |  |
||
| Functions | Targeting |  |
 |
| Veto |  |
||
| Leading |  |
||
| Advising & consulting |  |
||
| 1.2 HUMAN RESOURCES | |||
| Quantitative contents | HR in regulatory authorities (in % of PA employment) |
 |
|
| Qualitative contents | HR composition |  |
|
| Retraining | Number of regulatory officials involved in retraining courses |
 |
|
| 1.3 COMPLIANCE NATIONAL GUIDELINES WITH BENCHMARKING GUIDELINES |
 |
||
| 1.3.1 Problems and objectives |  |
||
| Necessity of action |
Identification of causes |  |
 |
| Magnitude of the problem |  |
||
| Stakeholder affected by proposal |  |
||
| Objectives | Identification of objectives |  |
 |
| Specific |  |
||
| Measurable |  |
||
| Accepted |  |
||
| Realistic |  |
||
| Time-dependent |  |
||
| Intervention logic | Articulate policy objectives as measurable outcome |
 |
 |
| Objectives consistency |  |
||
| Table 3 RIA Program Design And Dynamic Phase: Input Step |
||||
| Steps Dimensions Sub-Dimensions |
Row Individual Indicators & Variables | Normalized Individual Indicators | Sub Composite & Composite Indicators | |
| 1.3.2 Alternative options |  |
|||
| Necessity of action |
Selection of options
|
 |
 |
|
|
 |
|||
|
 |
|||
| Selection of affecting area of expected effects |
Effects on:
|
 |
 |
|
|
 |
|||
|
 |
|||
|
 |
|||
Choice of methodologies
|
 |
 |
||
|
 |
|||
|
 |
|||
|
 |
|||
| 1.3.3 Choice |  |
|||
| Comparison of options by the following principles | 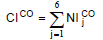 |
|||
|
|
 |
||
|
|
 |
||
|
|
 |
||
|
|
 |
||
|
|
 |
||
|
|
 |
||
| Ranking options |
|
 |
||
| Properties of choice |  |
|||
|
A is public or available on request |
 |
||
|
Executive summary |  |
||
|
|
 |
||
| Expected effects of proposal |
|
 |
||
The Input Step: The Establishment of the System
The start-up phase of the implementation part is the design of the RIA system, which consists in financing and combination of three inputs: institutions, human resources, formal procedures.
Institution
The RIA proposals are executed by the central government and/or sub-central government and/or independent authorities. In turn, the central government can use a single unit or many departments. The institutions are responsible for targeting, veto, advice, leading and consultation. The more numerous the institutions involved, the greater their functions, the more widespread the RIA is.
Human Resources
Human resources are relevant to their quantitative dimension (the number of total civil servants employed in the RIA implementation), to quality (the extent of expertise incorporated into regulatory officials), and to the balance of scientific expertise’s (e.g. economic, statistical, juridical and engineering skills) in the staff in relation to proper handling of the various aspects of the regulatory problem. The retraining of staff is important in the initial phase of implementation set-up, as it prepares regulatory officials to deal with a new policy instrument, and in advanced stages, as it is the channel through which the outputs of evaluation are quickly and profitably merged together in the implementation system.
Formal Procedures: The Benchmarking Guidelines
The main components of the formal procedures for the implementation of RIA are: the logical decision-making process; the common principles governing regulatory policy; the economic and statistical methodologies carried out along the different phases of the decision-making process; the macroeconomic models to forecast the effects of regulatory actions and so on. The knowledge of the above subjects is embodied in the RIA guidelines. Although the latter vary across countries, the benchmarking guidelines are described by a three-step process: issues and goals, alternative options, the choice. Indeed, the European Commission has published very advanced guidelines which follow the recommendations of Manderldkern’s report (2001). In the first phase, the RIA proposal should consider the need to introduce rules to start the regulation in a given sector, embracing the principles of subsidiarity and proportionality, indicating the objectives of the proposal and verifying the internal consistency of the proposal. In fact, as long as the objectives cannot be met directly, a transmission mechanism should be detailed by highlighting the interrelationships between the instrumental, intermediate and final variables. In fact, according to EU and UK, the objectives of the guidelines should be SMART i.e. Specific, Measurable, Accepted, Realistic, Time-dependent. During the second phase, the proposal should:
1. Select alternative options to provide greater transparency in the decision-making process.
2. Reduce the options to a shortlist including the “do nothing option” that provides the baseline against which to compare the other options.
3. Define the domains affected by the effects of RIA proposal (e.g. economic, social and environmental).
4. Identify the stakeholders involved in the regulatory policy action.
5. Measure the size of the quantitative effects of the alternative options by adopting the appropriate methodologies to the specific nature of the problem (e.g. cost benefit analysis, soft cost-benefit analysis, cost-effectiveness, business impact and so on; Jacobs, 2006). For example, in order to assess the effect of the introduction of prices regulation on the good market, the effect of sales on consumer behavior should be known. Zi-Yi & Yangxiaoteng (2017), for example, show that retail sales are more effective on consumer purchases than a price reduction. In these circumstances, a regulation that attempts to reduce prices might be ineffective.
6. Indicate the possible effects of trade-off.
In the final phase, the selected options should be compared using a set of common regulatory policy principles: effectiveness, efficiency, consistency, measurability, subsidiarity and proportionality. Therefore, the option that is the highest in the list should be chosen.
The organization and data collection form the basis that support all the different stages of the decision making process. In this context, therefore, the collection of data is an input to carry out the proposal. Data sources can be internal–organization and storage of data through an integrated micro/macro database shared by RIA units–and/or external namely the data retrieval on a specific problem through consultation. Consultations have different dimensions, i.e., aims, groups coverage, method, and their results should exhibit three main properties i.e., timeliness, transparency and accessibility. Hence, the more extensive the goals, the faster the consultation, the larger groups coverage, the more appropriate method, the more reliable the RIA proposal is. As a final remark it should be noted that although benchmarking guidelines are common knowledge, the national guidelines differ greatly across country: the laggard countries, indeed, are not able to catch up the most innovative countries on RIA guidelines design.
The Output Step: The Execution of the Process
At this stage of analysis, a distinction has to be made between RIA system and RIA process.Once the system has been designed and is available to the government, it can be used within the regulatory policy, (Table 4).
| Table 4 RIA Program Design And Dynamic Phase: Input And Output Steps |
|||
| Steps Dimensions Sub-Dimensions |
Row Individual Indicators &Variables | Normalized Individual Indicators | Sub Composite & Composite Indicators |
| 1.3.4 Data | 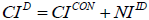 |
||
| Integrated database | Efficiency |  |
|
| Consultation | 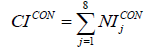 |
||
| General use | General use consultation |  |
|
| Aim | Articulate consultation during the RIA process |  |
|
| Group coverage | Coverage of all groups involved in the regulatory process |  |
|
|
|||
| External expertise |
|
 |
|
| Stakeholders |
|
 |
|
|
|||
|
|
 |
|
|
|
 |
|
|
|
 |
|
| 2. OUTPUT STEP |  |
||
| 2.1 PROPOSALS COMPLIANCE WITH NATIONAL GUIDELINES |  |
||
| Problems and objectives |  |
||
| Alternative options |  |
||
| Choice |  |
||
| Data |  |
||
| 2.2 EXPECTED EFFECTS OF OUTPUT | |||
| Expected effects on selected domains | Effects:
|
 |
|
|
 |
||
|
 |
||
Next, the operation of the system for solving the regulatory problem generates the process which yields the output of the proposal that, in turn, affects real world variables. In conclusion, while the system is constituted by the inputs, and hence represents the RIA capability, the process emerges from the interaction of input as soon as the system starts operating. Therefore, the RIA proposal output, summarizing the interrelation that have been generated from the process, should have three main properties namely, timeliness, transparency and accessibility and, finally, should quantify the expected effects on domains previously defined.
The Outcomes Step: The Effects of the Program
After the proposals have been delivered, and assuming that RIA proposals are completely converted into policy action, they produce effects on both the management of regulatory policies (the internal outcome) and the real world variables (the external outcome) by changing both the regulatory environment and the behaviors of the stakeholders. The internal outcome occurs when RIA pushes policy makers to consider all implications related to policy actions in order to bring more discipline and rigor in the regulatory decision making process. In these phases, the effects and the outcomes of the proposal should be distinguished from those of the program. The individual RIA proposal produces internal effects (as regards the formulation of a specific regulatory action in relation to a given problem) and external outcomes on the specific area (assuming that the policy action fully absorbs the proposal). The two main external objectives assigned to RIA program are greater accessibility and transparency in the process of establishing rules (democracy) and better conditions of the economic, environmental and social situations.
The Evaluation Part: the Closing of ria “Circle”
After RIA has produced real world outcomes, it has only partially fulfilled its task. Indeed, it should check the next phase of the implementation of the policy action in order to verify the quality of the RIA program i.e., the extent to which it meets its predicted outcomes. Given the actual outcomes, RIA quality evaluation should be done through a forward method starting from the bottom: it should check the system quality i.e., the inputs, and then, the process quality i.e., the output. Indeed, it should identify both the system default and the failure of the process that cause the poor quality of the program, and thus it should send a feedback to the part of implementation assessment. Therefore, the evaluation part closes the RIA circle, and should allow reshaping both the system and the process as long as the feedbacks are absorbed in a profitable way from the implementation part. In other words, RIA evaluation should check whether the RIA machine was good but it has been driven badly or, conversely, the driver was good but he led a bad machine or, obviously, both of them. The relation between the system and program quality is not always straightforward since some inputs of the system consists of both quantitative and qualitative elements. Nevertheless, to some extent, the quantitative contents should be reflected in qualitative aspects: the more the institutions, the largest the human resources and data, the better RIA quality should be. The structure of the RIA evaluation part mirrors the structure of implementation part and, therefore, proceeds in three steps: input, output and outcomes.
The Input Step: The Establishment of the System
Facing the budget constraint, the establishment of evaluation system comes out from the combination of three inputs: institution, human resources, approaches to quality evaluation.
Institutions & Human Resources
Institutions assigned to evaluate RIA can be found inside the administration (e.g. unit responsible of RIA, quasi-independent institution inside the government, other branches of government) and/or outside (e.g. advisory committees, national audit offices, businesses and international organizations). Since both kinds of institutions offer both advantages and disadvantages (OECD, 2004), the broader evaluators variety, the better evaluation activity is. The evaluators within the unit responsible for the implementation should check if the proposal was of good quality. In doing so, they have to check whether the proposal complies the formal procedures and, above all, the compliance of stakeholders’ behavior’s with respect to the new regulatory rule. In fulfilling this task, evaluators may make inspections and, if necessary, may apply additional rules to encourage stakeholders to meet the new regulation rules. This evaluation should lead to the identification of best and worst practices among administrations in charge of performing single RIA. Therefore if the results were made public, the evaluation should push the worst RIA units to improve their activity. The remaining evaluators should carry out comprehensive checks on both the strength of the system capability and the working of the process. Human resources are relevant for both quantitative and qualitative content i.e., for the skill contained in them. The retraining of evaluators is important because, through it, the evaluation techniques in force, or newly introduced, are embedded in human resources.
Approaches to Quality Evaluation
Tests and indicators are the approaches for assessing the RIA. An assessment of input, output and outcomes, that reflects the part of the implementation, should be carried out.
Tests
Until now, testing is the method adopted for the evaluation of RIA. Tests verify the quality of the various dimensions of the implementation part with particular reference to their qualitative contents.
Inputs tests verify system quality. The major input tests verify compliance of national guidelines to the benchmark guidelines. Based on our conceptual framework, this test should be considered as a preventive screening that should precede output tests. In fact, until national guidelines are poorly designed, RIA proposal inevitably produces an output of low quality, even if it fully complies with them. Inputs tests are fully meaningful during the initial stage of RIA establishment and, therefore, with the passage of time, gradually lose their importance. However, because common international standards are constantly evolving, tests on national guidelines should be carried out, from time to time, to assess the degree of updating the system with respect to the formal procedures.
Output tests monitor process quality. Since we introduced the distinction between system and process, it becomes necessary to redefine and expand the current classification of tests (OECD, 2004a). Actually some tests that are included in input tests from the current literature were transferred to output tests. As we have seen the output of the process summarizes the interrelationships between the inputs which were generated from the operation of the system. The degree of compliance of RIA proposal with national guidelines is the first step towards assessing the system quality. In literature a distinction has been made between extensive and intensive test (Harrington & Morgenstern, 2004). The former verifies the existence of key items included in the RIA proposal; the latter focuses on quality items in order to detect errors in carrying out RIA proposals. An extensive test verifies to which extent the expected output meets its formal properties (efficiency, effectiveness, consistency, subsidiarity, measurability, accessibility, transparency, timeliness, proportionality). Tests of this type have been carried out, for instance, by Renda (2006) and Lee and Kirkpatrick (2004). The second part is represented by ex-post tests of the output effectiveness that consist in comparing the expected against the ex-post effect. Finally, since consultation is essential in the implementation of the RIA proposal, tests should verify data collection quality as well. Tests of data collection quality would verify whether consultation met the common principles so as to ensure proper implementation of the RIA proposal i.e., broad aims, a quick start on a specific aim, the choice of the most appropriate method to the purpose.
Outcomes tests verify program quality. Obviously, outcomes tests sums up the quality of the system and process. Tests of the internal outcome verify the extent to which RIA has been spread within regulatory policy. With regard to the individual proposal, the internal outcome is measured by how the proposal is able to affects the regulatory rule-making process limited to a specific problem. The internal outcomes is measured by its effectiveness i.e. by the difference between the value of actual final variable and the value that would have occur in absence of the regulatory proposal where the counterfactual value is approximated by contrasting the actual value against the value produced by the “do nothing” option. Information about this aspect can be obtained by the percentage of new regulatory interventions subject to RIA analysis. Tests of the external outcomes verify to what extent the RIA program has modified the real world outcomes. Therefore, the properties of the output i.e., transparency and accessibility, are a measure of how the goal of more democracy is fulfilled. Additionally, with respect to the economic, social and environmental goals, the ex-post tests of outcomes effectiveness consists of comparing the actual outcomes produced by the program with the outcomes that would have occurred without it.
Indicators
An alternative approach to RIA quality evaluation is provided by indicators. On the one hand, indicators are derived from tests simply through the processing of their results; on the other hand, they complete program quality evaluation since measure the quantitative contents of the program. Later, we discuss only the complementary indicators for quality evaluation and the rationale for the construction of RIA quality composite indicators.
In carrying on RIA evaluation, two types of indicators are to be distinguished according to the extent of the aspects to be measured i.e. individual and composite indicators, and to the nature of the underlying data i.e. quantitative and qualitative indicators. The individual indicator is a measure of a characteristic of a given RIA dimension. Depending on the purpose of the quality evaluation, composite indicators can be used to aggregate both all individual indicators (that are able to grasp a given RIA sub-dimension or dimension to be measured) and the key dimensions. Quantitative indicators are applicable to the quantitative content of a given RIA aspect and/or dimension that are directly measurable; qualitative indicators are derived–through an appropriate metric–from aspects and dimensions that cannot be measured directly.
Indicators play a full role when measuring qualitative variables involved in evaluation. Financial resources are at the foundation of RIA program, and thus represent a constraint on RIA design, implementation and development: the limited financial resources are reflected, inevitably, in poor RIA quality. The greater financial resources, the broader RIA, the better quality should be. However, if the quality contents of inputs are poor, the positive relationship between financial resources and RIA quality is undermined. For example, this could happen because of administrative inefficiencies, low human resources capacity, inadequate national formal procedures and poor data quality. Despite this weakness, financial resources show the present government efforts to adopt RIA as an essential instrument of the regulatory policy. Indeed, some countries–particularly those that have introduced RIA on the recommendation of external organization or on emulation of what was done in other countries rather than on initiation of the internal political and administrative system–have adopted RIA only formally with scarce financial effort and without producing any significant RIA output. The RIA financial effort indicator (or index), therefore, is the first and rough measure of quality evaluation, which offers a synthetic measure of the RIA quantitative capability. Additionally, it enables to measure both the instrument/objective consistency and the RIA program efficiency. Human resources indicators (or indexes) of quantity and composition of scientific skills in the staff, can be calculated in a similar manner to the indicator financial effort. Both indicators, however, offer significant information about a small part of the entire RIA system capability.
The rationale for the use of indicators of RIA quality, beyond the quantitative aspects of the program, is to gather both the quantitative and qualitative contents of the program in the quality assessment and to form the basis for the quantitative analysis on RIA which should facilitate comparison between countries. In the RIA context, composite indicators should be constructed to address the complexity of information on the program quality evaluation.
The first step towards building of RIA composite indicators is to develop a conceptual framework which should provide the basis for the selection and aggregation of individual indicators, a task which we have already carried out in the preceding sections. Indeed, our conceptual framework has allowed us to determine the key dimensions of RIA, and to provide, within them, all raw individual indicators, in order to lay the foundations for the construction of composite indicators through the sum of the single normalized indicators in a representative manner rather than at random.
Output & Outcomes Steps
Activation of evaluation system produces a process which, in turn, should generate the output of evaluation i.e., the results of tests and indicators. The evaluation output finds out both flaws in the system and the failure of the operation of the process and, after revealing the causes of poor quality, sends feedbacks to implementation part for its improvement. The evaluation outcomes are the magnitude of the change in the structure of system and in the working of the process.
The stages Of RIA evolutionary process
Evaluation part is the internal driving force behind RIA program dynamics. Indeed, a RIA evolutionary process arises as long as the implementation part absorbs the evaluation feedbacks. Along the evolutionary process, quality program should continuously improve.
The dynamic perspective of the conceptual framework, therefore, seems to explain the stylized fact of differences in both RIA implementation and dynamics. Indeed, countries that activate the RIA circle through the formation of a system for evaluating the program have better quality program and evolve faster than the others. Actually, this hypothesis should be monitored more accurately through a cluster analysis.
As already noted, however, the start of RIA circle is triggered by external driving force i.e., the socio-political institutional factor. Institutions, according to their historical institutional evolution, can either hinder or facilitate the establishment of RIA program and its improvement. Therefore, without a profound change in the institutional culture, the efficient usage of RIA in the laggard countries is a vague fantasy (i.e. a vicious circle).
Returning to the conceptual framework, the evolutionary process progresses through three stages that correspond to that of the three steps of the RIA implementation part: the readiness, the usage and the impact stages.
During the readiness stage the establishment of the implementation system is the fundamental aim of the government, while the set-up of the evaluation system is absent or is still in an embryonic state. A process that produces significant outputs and outcomes still does not work and the occasional outputs are the result of pilot analyses rather than systematic ones. In this phase, indicators and/or tests should check both the financial effort and the quality of the system and, in particular, should verify the compliance of national guidelines to international standards. On the contrary, tests of outputs and outcomes quality are completely meaningless. Italy, for instance, even if has formally introduced RIA since 2000 and has established well-defined guidelines, has not yet activated the process on a regular basis so that RIA output is almost zero.
In the usage stage the system has been already deeply embodied within the regulatory policy and the process starts to produce regularly outputs and outcomes. Quality of output during these phases could track a U curve (Jacobs, 2006). At the beginning of these phases, the quality may actually decrease due to the enlargement of RIA officials needed to support the diffusion of RIA in several institutions. In fact, additional officers may show a lack of knowledge and poor learning ability in the implementation of the program and therefore produce output of low quality. Then in a second phase, the evaluation system emerges significantly, sends feedbacks steadily to the implementation part, and shifts attention from the system to process quality. Output tests and/or indicators start to evaluate both RIA proposal compliance with the high quality national guidelines and the effectiveness of RIA outputs.
Finally the impact stage is achieved when RIA has been greatly improved, and a virtuous circle, resulting in a continuous feedback, begins to run (e.g. USA, UK, New Zealand and Canada enter this phase). RIA process produces both high quality output and significant outcomes. Output evaluation loses in importance because RIA proposals strictly follow the national guidelines while, on the contrary, outcomes evaluation becomes fundamental to highlight the benefits of introducing RIA program.
The Aggregate RIA Quality Composite Indicators
The conceptual framework has shown that quality assessment of RIA program requires a great deal of information about the contents of the sub-dimensions, dimensions and steps of RIA. The complexity of information involved in quality evaluation, as we have seen, justifies the adoption and construction of composite indicators.
The RIA efficiency indicator is a first rough and partial indicator of RIA quality (Table 5). It is defined as the difference between the net benefits, given by the implementation of the process, and the financial resource invested in the course of RIA. An index of efficiency can also be calculated by the ratio between net profit and financial resources. Furthermore, in a comparative perspective the efficiency index can be normalized by expressing the national index of efficiency as a percentage of the benchmark.
| Table 5 RIA Program Design And Dynamic Phase: Output Step And The Ria Quality Aggregate Composite Indicator |
|||
| Steps Dimensions Sub-Dimensions |
Row Individual Indicators &Variables | Normalized Individual Indicators | Sub Composite & Composite Indicators |
| 2. OUTCOME STEP |  |
||
| 3.1 INTERNAL OUTCOMES | 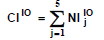 |
||
| Individual proposal | |||
|
 |
||
|
 |
||
| Program | |||
|
 |
||
|
 |
||
|
 |
||
| 3.2 EXTERNAL OUTCOMES |  |
||
| Democracy and accountability of decision making process |  |
||
|
|
 |
|
|
 |
||
|
|
 |
|
|
 |
||
| Real world effects |  |
||
| Effectiveness indexes: | |||
|
 |
||
|
 |
||
|
 |
||
| RIA Quality Aggregate Composite Indicator |  |
||
Actually this approach considers RIA as any productive activity and, consequently, defines its monetary profitability. However, it is undermined by two main shortcomings. Firstly, it highlights the weaknesses that affect tests: indeed the RIA efficiency indicator captures only the financial aspect of RIA. Indeed, it focuses exclusively on the economic final objective ignoring the qualitative ones i.e. the accountability and transparency of the decision making process. Secondly, it leads the RIA program evaluation to a dichotomous choice: to its abandonment if the profitability is negative and, conversely, to its implementation if the profitability is positive. A U curve may also occur with respect to the outcomes in such a way as to hinder the proper evaluation of this indicator in the initial phase of RIA implementation.
As we have already discussed in section 4, the construction of RIA composite indicators has great advantages compared to the tests since it can evaluate the entire program i.e., both the quantity and quality of its content reducing, at the same time, the complexity of information. However, the “Handbook of construction composite indicators” (OECD, 2005) has shown that ten steps are necessary to build up composite indicators. In fact, their construction through all stages is beyond the scope of our paper. In what follows, we discuss only the following steps (or numbers): variable selection, treatment quality indicators, the data normalization, weighting and aggregation. We must recall that other steps for the construction of composite indicators are: multivariate analysis, imputation of missing data, robustness and sensitivity, relationship to other variables, visualization and finally back to the real data.
Individual indicators have been selected on the basis of the conceptual framework, and placed into dimensions. In doing so, data availability has been taken into account. Actually, most of the selected individual indicators are borrowed from DIADEM Handbook (Table 2). Qualitative individual indicators that are based on yes/no format should be transformed into real number by assigning 1 to answer yes and 0 to answer no.
Then a weighting issue may arise from aggregation. Indeed, individual indicators do not count the same way so that different weights should be assigned to capture their relative importance. Two options are available. First, a weighting system to capture the different importance of individual indicators could be introduced. This option, however, is undermined by the subjectivity of choosing weights and, furthermore, implies a subsequent normalization of the weighted individual indicators. The weights should be fixed by experts (with respect to technical aspects) and politicians (with respect to the goals represented in their social utility function). Second, the assignment of identical weight to each individual indicator should avoid both the subjectivity and the normalization issues. This option, however, fails to capture the critical points to ensure a high RIA quality. In this paper, since we do not compute composite indicators, we simply get around the issue by transforming directly rough individual indicator into normalized indicators.
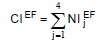
The issue of data normalization occurs at different levels. First, individual indicators with different units of measurement than the others should be normalized in order to have a range (0, 1), for instance, by the method of the distance to a reference country (country variable as a percentage of the benchmark country variable). Secondly, the introduction of a weighting system requires that indicators must be normalized to have the same range (0, 1) through the procedure of rescaling. Assuming that all the above steps are met, given a set of normalized indicators, (individual or composite), a generic composite indicator is defined as their linear aggregation (in order to avoid an additional rescaling stage):
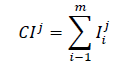
Where j refers to the sub-dimension, dimension or step of the conceptual framework; i refers to a generic normalized indicator belonging to one of them.
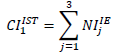
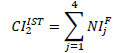
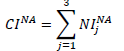
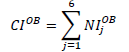
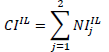
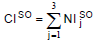
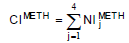
The RIA quality aggregate composite indicator  then is obtained through a four-phase sequence of aggregation (assuming a linear aggregation in each phase): (i) normalized indicators → sub-dimension CI (ii) sub-dimensions CI → dimension CI (iii) dimensions CI step → CI (iv) steps CI → program CI so as to obtain:
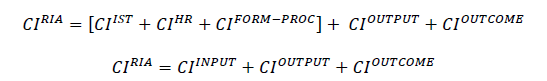
Where, we adopt the following: CIIST institutions composite indicator; CIHR, formal procedures composite indicator (national guidelines compliance with international standard); CIOUTPUT output step composite indicator (basically, proposal compliance with national guidelines); CIOUTCOME , outcome step composite indicator; CIINPUT , input step composite indicator.
The advantage of this approach is twofold. On the one hand it summaries the RIA quality into a single composite indicator in order to reduce the complexity to a single number. On the other hand, the overall composite indicator can be divided into the key composite indicators in order to focus on the main steps and/or dimensions and/or sub-dimension of the entire program. The separate key composite indicators should provide useful information to policy makers with respect to those RIA sub-dimensions, dimensions and steps where their regulatory tool seems to be weak or backward. On the other hand, we must point out some pitfalls of interpreting possible RIA composite indicators. As we have seen, the evolutionary structure of RIA implies that the importance of indicators is time-dependent. For example, indicators that focus on the inputs step lose importance when the program moves to more advanced phases. On the other hand, the assumed U curve, could also compromise the interpretation of indicators within the usage phase since at the early of this phase a reduction in RIA quality must to be taken into account.
Conclusions And Further Research
The main conclusions of this paper are the following. First, a conceptual framework of RIA has been studied in both static and dynamic perspective. In a static perspective the RIA program is designed as a circular framework composed of both the implementation and evaluation part. Both of them evolve through three steps: input, outputs and outcomes. In the implementation part, the establishment of the system and the operation of the process allow the program to produce real world outcomes. Second, the set-up of an evaluation system represents the internal force that activates the RIA circle and allows improving the implementation part. As long as the latter internalizes the feedbacks of evaluation output, an evolutionary process of RIA starts to go, so that the program evolves through three phases i.e. readiness, usage and impact, during which the quality of the program is continuously improving. Third, the conceptual framework has permitted to split the three phases of the implementation part in key sub-dimensions and dimensions which are representative of the entire program, to derive individual indicators, and to record indicators in the dimensions or sub-dimensions. Then, assuming that the row individual indicators can be transformed into normalized individual indicators, it has obtained the aggregate RIA quality composite indicator by summing up the key composite indicators representing each sub-dimension, dimension and step of the implementation part.
There are different directions for future research. First of all, as we have seen in spite of worldwide diffusion and, apart from a very limited number of countries, the RIA has not produced the expected results and its success is limited and weak. So the research should investigate the most important contextual variables-such as the institutional factor, the organizational elements and the political context that may explain the delay in the development of RIA. Secondly, further research should go beyond the design of composite indicators and, in fact, they should enter the operational phase. At present, this improvement, however, is severely limited and compromised by the scarcity and heterogeneity of the available data. In particular, international institutions should promote programs to collect homogeneous data in the most developed countries. Finally, it should be analyzed whether the establishment of an independent agency can promote the RIA both in the constitution and in the evaluation phase.
References
- De Francesco, F., & Radaellli, C. M. (2007). Indicators of regulatory quality. Edward Elgar Publishing.
- Kirkpatrick, C.H., & Parker, D. (2007). Regulatory impact assessment: Towards better regulation? Edward Elgar Publishing.
- Dunlop, C.A., & Radaelli, C.M. (2017). Research handbooks on impact assessment series. Edward Elgar, Cheltenham, United Kingdom.
- European Commission (2005). Impact assessment guidelines.
- European Court of Auditors (2010). Impact assessments in the EU Institutions: Do they support decision-making?
- Hahn, R.W., Burnett, J.K., Chan, Y.H.I., & Mader, E.A. (1999). Assessing regulatory impact analysis: The failure of agencies to comply with executive order 12,866. Harvard Journal of Law and Public Policy, 23(3), 859-884.
- Harrington, W., & Morgenstern, R.D. (2003). Evaluating regulatory impact analyses, paper prepared for the OECD project on ex post evaluation of regulatory tools and institutions. ANNEXE B, Paris.
- Jacobs K., Meuwese, A., & Radaelli, C.M. (2007). Report on indicators for regulatory quality.
- Jacobs, S. (2006). Current trends in regulatory impact analysis: The challenge of mainstreaming RIA into policy-making. Jacobs and Associates.
- Manderldkern Group Report (2001). Final report. Brussels.
- Nardo, M., Saisana, M., Saltelli, A., Tarantola, S., Hoffman, A., & Giovannini, E. (2005). Handbook on Constructing Composite Indicators.
- Development Council (1995). Recommendation of the council of the OECD on improving the quality of government regulation. OECD.
- OECD (2004a). Regulatory performance: Ex-post evaluation of regulatory tool and institutions. Public Governance Committee.
- OECD (2004b). Regulatory impact analysis (RIA) inventory. Public Governance Committee,Paris.
- OECD (2008). Building an institutional framework for regulatory impact analysis: Guidance for policy makers. Regulatory Policy Division Directorate for Public Governance and Territorial Development, OECD, Paris.
- Peci, A., & Sobral, F. (2011). Regulatory impact assessment: How political and organizational forces influence its diffusion in a developing country. Regulation & Governance, 5(2), 204-220.
- Radaelli, C.M. (2003). Impact assessment in the European Union: Innovations, quality, and good regulatory governance. Conference Background Report, European Commission.
- Radaelli C.M. (2005). Diffusion without convergence: How political context shapes the adoption of regulatory impact assessment. Journal of European Public Policy, 12(5), 924-943.
- Radaelli, C.M. (2009). Desperately seeking regulatory impact assessments: Diary of a reflective researcher. Evaluation, 15(1), 31-48.
- Radaelli, C.M., Dente, B., Jacobs, S.H., Kirkpatrick, C., Meuwese, A.C., & Renda, A. (2006). How to perform the DIADEM data collection. Brussels: European Network on Better Regulation.
- Renda A. (2006). Impact assessment in the EU. Centre for European Policy Studies, Brussels.
- Sager, F., & Rissi, C. (2011). The limited scope of policy appraisal in the context of referendum democracy-the case of regulatory impact assessment in Switzerland. Evaluation, 17(2), 151-163.
- Stame, N. (2010). What doesn’t work? Three failures, many answers. Evaluation, 16(4), 371-387.
- White H. (2010). A contribution to current debates in impact evaluation. Evaluation, 16(2), 153-164.
- World Bank (2010). Making it work: RIA light for developing countries. Better Regulation for Growth: governance frameworks and tools for effective regulatory reform, World Bank Group, Washington.
- Zi-Yi G., & Yangxiaoteng, L. (2017). The effect of sales and evidence from micro data. Research in World Economy, 8(1), 37-44.