Research Article: 2022 Vol: 25 Issue: 2S
Prediction analysis of food crop farmer index price during Covid-19 pandemic using ARIMA and LSTM
Teddy Oswari, Universitas Gunadarma
Tristyanti Yusnitasari, Universitas Gunadarma
Reni Diah Kusumawati, Universitas Gunadarma
Irvan Setiawan, Universitas Gunadarma
Citation Information: Oswari, T., Yusnitasari, T., Kusumawati, R.D., & Setiawan, I. (2022). Prediction analysis of food crop farmer index price during covid-19 pandemic using ARIMA and LSTM. Journal of Management Information and Decision Sciences, 25(S2), 1-10.
Keywords
Index Price, Food Crop Farmer, Forecasting Arima, LSTM
Abstract
Agriculture is a sector that has great influence and potential to be exploited for the Indonesian economy. The Indonesian agricultural sector is considered to be very influential on the national economy based on the main macroeconomic variables in the form of the composition of the workforce and the price index received by farmers (IT). Most of the workforce in Indonesia, especially for the small group, works in the agricultural sector. The price index received by farmers (IT) is a value that shows the level of development of farmer production. During the COVID-19 pandemic, Indonesia's agricultural sector is considered to still have a role in national economic growth. Even so, there are still impacts from the COVID-19 pandemic on Indonesia's agricultural sector. One of them is the disruption of farmers' production in all regions. Therefore, one solution to maintaining the stability of national economic growth in the agricultural sector is to predict the development of food crop farmers' production. In this research, prediction or forecasting will be carried out with the Auto Regressive Integrated Moving Average (ARIMA) algorithm with parameters SARIMA(2, 1, 2) x (0, 1, 1, 1) and the Long Short Term Memory (LSTM) algorithm with LSTM parameters 100, dropout 0.2, 100 times. The results of the forecasting analysis of the two models show that the LSTM model has more accurate prediction results than the ARIMA model because the MSE value in the LSTM model is lower (0.1051) than the ARIMA model (0.2692).
Keywords
Index Price, Food Crop Farmer, Forecasting Arima, LSTM
Introduction
Agriculture is a sector that has great influence and potential to be exploited for the Indonesian economy. The agricultural sector in Indonesia has experienced a period of ups and downs (Arifin, 2004). The Indonesian agricultural sector is considered to be very influential on the national economy based on the main macroeconomic variables in the form of the composition of the workforce and the price index received by farmers (IT). Most of the workforce in Indonesia, especially for the small group, works in the agricultural sector (Ministry of Agriculture, 2018). The price index received by farmers (IT) is a value that shows the level of development of farmer production.
During the COVID-19 pandemic, Indonesia's agricultural sector is considered to still have a role in national economic growth. This is known based on data from the Central Statistics Agency (BPS) which shows that the agricultural sector continues to grow positively during the COVID-19 pandemic (Kompas, 2020). In the second and third quarters of 2020, the food crop subsector grew 9.23% and 7.14% respectively. Even so, there are still impacts from the COVID-19 pandemic on Indonesia's agricultural sector. One of them is the disruption of farmers' production in all regions (Commission IV DPR RI Press Release ) due to the impact on market & agricultural prices, customer supply chains slowing down and tend to decrease, decreasing the quality of health and labor of farmers, lack of work safety, and decreasing quality of food resources. Therefore, one solution to maintaining the stability of national economic growth in the agricultural sector is to predict the development of food crop farmers' production.
Prediction of the development of the production of food crop farmers can be done by implementing machine learning in a time series data. One of the time series data that can be used to predict the development of the production of food crop farmers is the price index data received by farmers during the COVID-19 (IT) pandemic. This data can be processed with machine learning so that it can be used to predict IT in the future. Prediction made by implementing machine learning in a time series is also known as forecasting. Prediction or forecasting will be done by analyzing the forecasting results obtained from 2 algorithms, which are Auto Regressive Integrated Moving Average (ARIMA) and Long Short Term Memory (LSTM). The ARIMA and LSTM models developed in this research have several limitations, such as: (1) The research will be conducted using the ARIMA and LSTM algorithms only. (2) The dataset used is IT data received by food plants obtained from the Badan Pusat Statistik (BPS) from April 2020 to April 2021. (3) The model was developed using the python programming language. (4) Model analysis is done by comparing the MSE value from the output of the two models.
The ARIMA algorithm was chosen as the first algorithm in this research because the ARIMA algorithm is a time series forecasting algorithm that can be used to predict stable time series data. While the LSTM algorithm was chosen as the second algorithm of this research because the LSTM algorithm is a time series forecasting algorithm that can predict time series with a long period or time. In training the model, the input data will have a .csv format which contains 2 columns, namely the date and index column and 13 rows consisting of 13 pairs of months and index.
Related Work
There have been many time-series forecasting research using ARIMA and LSTM. These researches are been done to facilitate human work by making computers able to predict or forecast a value in a time-series data in the future. The researches that have been carried out are forecast on crop production such as rice and wheat from the National Food Security Mission in India. This research is being carried out in three different areas, which are the Area of Cultivation, Production, and Yielding of rice (Paidipati & Banik, 2019). They are creating a comparative analysis on the ARIMA and LSTM-NN models. Based on the analysis results, the LSTM-NN model is considered to be more capable in forecasting. The LSTM-NN model has a positive percentage error in forecasting value, while the ARIMA model has a negative value. In addition, there is also research that being conducted to predict quantitative amounts of rainfall and predictions of drought events to facilitate early warning of drought in Northeast China. This research was made (Wu et al., 2021). The forecasting in this research is conducted by comparative analysis between 3 models, which are Wavelete-ARIMA-LSTM (W-AL), Auto Regressive Integrated Moving Average (ARIMA), and Long Short-Term. Memory (LSTM). The results of the comparative analysis that have been carried out show that the W-AL hybrid model has a higher forecasting accuracy than the ARIMA and LSTM models.
There are two more researches that are related to data-series forecasting with ARIMA and LSTM. There is a research conducted for forecasting CPU usage (workload) (Janardhanan, Barrett, 2017). Forecasting in this research was conducted by analyzing 2 models, which are the ARIMA model and the LSTM model on the Google cluster dataset dataset (29-day trace period). Based on the validated performance results based on the Root Mean Square Error (RMSE) value, it is known that the LSTM model has a better performance than the ARIMA model. ARIMA model with parameter (2,1,2) has a forecasting error value between 37,331% to 42,881% (overfitting). While the LSTM model which has Neurons: 5 and epoch: 3000 parameters has a forecasting error value between 17.566% to 23.65%. There is also research that was being conducted (Hua, 2020) to forecasting the price of Bitcoin using the ARIMA and LSTM models. Forecasting is carried out on a dataset containing 10,000 data in the form of prices information on the Bitfinex website. Based on the results of forecasting the LSTM model with the Epochs: 100 parameter requires more time to train the model than the ARIMA model with parameter (1,1,0). But based on forecasting results it is known that the LSTM model can predict better than the ARIMA model. The LSTM model has an average error rate of 0.4765938 and a standard deviation of 2.092208.
Literature Review
Agriculture
Agriculture includes various activities such as farming, animal husbandry, fisheries, and also forestry. Farming is a job that dominates livelihoods in Indonesia because approximately 100 million people or nearly half of the total number of Indonesians work in the agricultural sector (Ministry of Agriculture, 2019). Agriculture is a major economic sector in developing countries. The role and contribution of the agricultural sector in economic development in a country has a priority position compared to other sectors. In developing countries, food production generally dominates the agricultural sector. If output increases due to increased productivity, farmers' income will tend to increase if demand can compensate for it.
The price index received by farmers () is a price index that shows the development of producer prices for farmer products (BPS, 2020). This price index measures the average price change (fluctuation) in a period of a type of agricultural product at the producer price level. This price index is also used as supporting data in calculating agricultural sector income.
Price Index received by Farmers ()
The price index received by farmers () is a price index that shows the development of producer prices for farmer products (BPS, 2020). This price index measures the average price change (fluctuation) in a period of a type of agricultural product at the producer price level. This price index is also used as supporting data in calculating agricultural sector income. is calculated based on the selling value of agricultural products produced by farmers including the food crop sector, horticulture, plantation crops, animal husbandry, fishermen and fish farming. In addition to the selling value of agricultural products, is also calculated based on the Rural Producer Price Survey, Farmers Exchange Rate Weigh Chart Survey, Agricultural Census, and Farming Business Cost Structure Survey. The higher the value, the higher the production value produced by farmers. Meanwhile, if it decreases, the income received by farmers will be lower.
Auto Regressive Integrated Moving Average (ARIMA)
ARIMA is one of the methods in time series forecasting that can be used in types of time series that are in stable condition. Stabel data in time series is when there is no trend or seasonal in time series. In addition, a stable time series has a constant mean and a relatively constant variance, which means that these two parameters tend not to change over time. ARIMA has good forecasting accuracy results in short-term forecasting, while for long-term forecasting the accuracy of forecasting tends to be less good. Generally, when ARIMA is used for long-term forecasting, the results will tend to be flat (horizontal or constant). Forecasting generated by the ARIMA method is obtained from data processing in the form of past and present values of the dependent variable. Therefore, ARIMA is a suitable method for making observations of time series which are statistically related to one another (dependent).
Long Short Term Memory (LSTM)
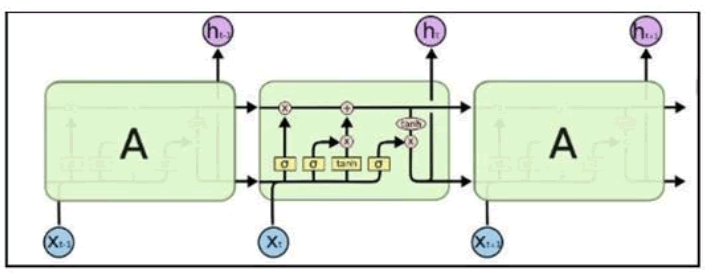
Long Short-Term Memory (LSTM) is a development of the Recurrent Neural Network (RNN) by overcoming one of the shortcomings of RNN, which is the ability to manage information over a long period of time. Proposed by Hochreiter & Schmidhuber (1997), LSTM is widely chosen for time series based predictions because it is known to be superior and reliable in making predictions over a long period of time compared to other algorithms (Zahara, Sugianto, & Ilmiddafiq, 2019). LSTM has a network structure as shown in Figure 1.
The LSTM model filters information through a gate structure to maintain and update the state of the memory cells. The door structure includes an input gate, forget gate, and output gate. Each memory cell has three sigmoid layers and one tanh layer. One LSTM cell has a path connecting the old memory cell (C?? − 1) to the new memory cell (????). Memory cell is a horizontal line that connects all the output layers on the LSTM. With this path, an old memory cell value can easily be passed to the new memory cell with minor modifications. The LSTM has the ability to add or delete previous information that entered the current cell. The sigmoid layer displays a number between zero and one, describing how much of each component should be allowed in. A zero value is interpreted as "may not enter" while a value of one is interpreted as "please enter".
Research Method
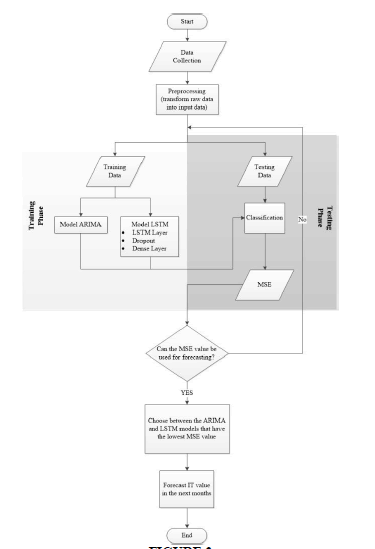
The implementation of the ARIMA and LSTM methods in time series forecasting will be formulated in the flowchart in Figure 2.
The following is an explanation of the flowchart in Figure 2:
1.Analysis of the time series forecasting model with the ARIMA and LSTM algorithms on the IT value of food crop farmers starting with data collection. The data collected is in the form of IT values received by food crop farmers every month from April 2020 to April 2021 which are obtained from the BPS Indonesia website.
2.Data preprocessing is done by transforming the raw data obtained from the BPS Indonesia website into structured data that can be processed as input data by the ARIMA and LSTM models. The data that is ready to use becomes input data, which will then be divided into training data and test data.
3.Training data is data that will be used as input data in the training phase. In the training phase, the training data will be trained using the ARIMA model and the LSTM model which consists of LSTM, dropout, and dense layer separately.
4.After the ARIMA and LSTM models are trained, the two models will be tested with test data in the testing phase separately. The result of this testing phase is the MSE value which is the benchmark for measuring the truth of the forecasting model results.
5.If the MSE value in the model has a value of less than 1 (one), then the model can be considered sufficient to predict. However, if the MSE value in the model approaches or exceeds one, the model needs to be retrained with different training or testing parameters to produce a low MSE value (less than one).
6.The model that has the lowest MSE value will be selected as the most suitable model to be used to predict the IT value in the next few months.
Method of Collecting data
The data used in this study were collected by downloading data in the form of the average price index value received by food crop farmers (IT) per month from the BPS Indonesia website. Because the research was conducted to analyze and predict the value of IT during the COVID-19 pandemic, the data collected came from data from 2020 to 2021 (to be precise from April 2020 to April 2021). The data, which consists of 12 months, will then be used as the time series dataset for the ARIMA and LSTM models after passing the preprocessing step. The preprocessing step taken on this dataset is to transform the raw data into data with a structure that can be accepted by ARIMA and LSTM models. This dataset will then be divided into training data and test data which will be used in the training phase and the testing phase of the ARIMA and LSTM models.
ARIMA Model
The first step in developing the ARIMA model is to determine whether the data to be used is stable. Data is said to be stable if there is no trend and seasonality. If the data to be used is stable, then differencing is not needed and one of the parameters in ARIMA is d=0. Data stability testing will be carried out in two ways. First, by observing the lines on the ACF (Auto-Correlation Function) plot of the data. The second test was carried out by the statistical method commonly used to check the stability of the data, namely, the ADF (Augmented Dickey-Fuller) test. The initial hypothesis (h0) of the ADF test is that the time series data is unstable. So, if the test p-value is smaller than the level of significance (α=0.05), then the null hypothesis can be ignored and concludes that the time series data is stable.
LSTM Model
The LSTM model is a sequential model that can run the process sequentially on the layers that have been arranged. The LSTM model used in this study is composed of 3 processes, namely LSTM, dropout, and dense layer. This dense layer functions to connect each neuron on a layer with neurons on another layer. Without a dense layer, the LSTM model will not be able to predict IT data for food crop farmers. In this study, the dense layer is useful for determining the loss value and MSE. Loss is a parameter containing a value that indicates poor forecasting results. Therefore, the lower the loss value, the better the prediction results. Meanwhile, the MSE value is determined based on the comparison between the prediction results in the form of the IT value of the food crop farmers with the original data. As with loss, the lower MSE value indicates a good prediction result.
Discussion
ARIMA Preprocessing
The data stability test was carried out before training the ARIMA model. The data stability test is carried out because the most optimal data to train ARIMA model is a stable data. First, by observing the lines on the ACF (Auto-Correlation Function) plot of the data. The second test was carried out by the statistical method commonly used to check the stability of the data, namely, the ADF (Augmented Dickey-Fuller) test.
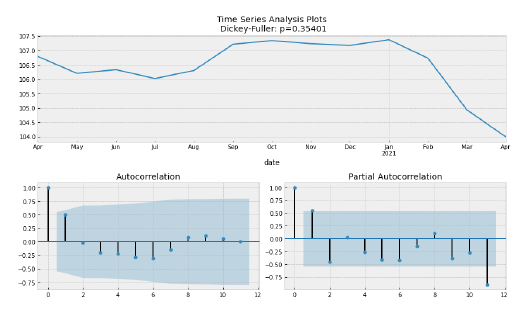
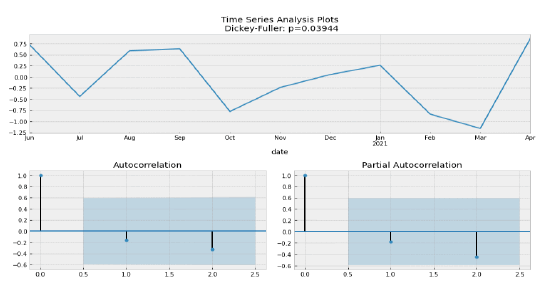
Figure 3 shows that the results of the ADF test as a p-value which is much greater than 0.05, it is 0.35401. This means that it is certain that the data is unstable. Therefore, to make the data stable, we have to differencing the data to transform the data to be stable. The graph of the results of differencing data can be seen in Figure 4.
After testing the stability of the data by looking at the original data diagram in Figure 4.2 and differencing the data in Figure 4, it can be concluded that the data is stable. This conclusion is obtained from the p-value after differencing the data which has a value of 0.03944. This p-value is smaller than the stability point (α = 0.05). Based on this, we can ignore the initial hypothesis (h0). Based on these results, we can determine one of the parameters that will be used to train the ARIMA model, which is the parameter d&D=1
ARIMA Parameter Determination
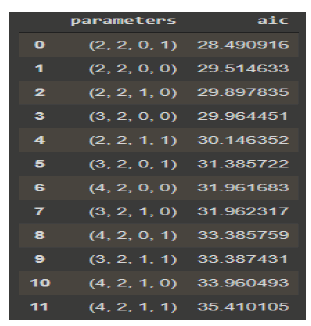
In this study, the parameters to be used have the format SARIMA{(p, d, q) x (P, D, Q, s)}. This parameter format is the basic parameter format of SARIMA. SARIMA is one of the functions of the ARIMA algorithm which has the ability to judge based on seasonality and determine parameters automatically. Based on Figure 3 and Figure 4, we already know the parameters (d) and (D) which is 1 because the data is stable. We specify parameter (s) as 1 because based on the original data we use, our data does not have seasonality. The parameters that need to be determined now are the parameters (p, q) and (P, Q).
Based on Figure 5, we can see if the best parameter of the test is parameter (2, 2, 0, 1). Based on these parameters, the parameters that will be used to train the model are obtained, which is SARIMA (2, 1, 2) x (0, 1, 1, 1)
ARIMA Model Output
The ARIMA model training is carried out using the parameters we have determined, namely SARIMA (2, 1, 2) x (0, 1, 1, 1). In training the ARIMA model, we need training data and ARIMA parameters. After training the ARIMA model, the next thing that needs to be done is to test the ARIMA model with test data at the testing stage using test data. In this study, the original data consisting of 13 months will be tested by forecasting data obtained from the ARIMA model that has been trained. The data generated by the ARIMA model consists of 13 months starting from June 2020 to July 2021.
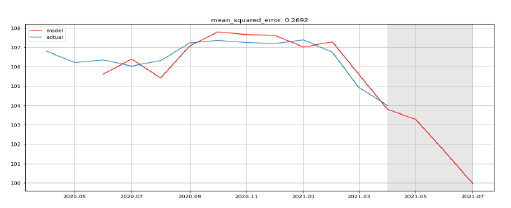
Tests applied to the trained model are carried out to determine the prediction results and the MSE value in the model. This MSE value is a value that tells the error value in forecasting data. The MSE value is obtained from comparing the forecasting results with the actual data. For more details, please see the graph of the forecasting results (forecasting) of the ARIMA model in Figure 6 below.
The blue line in the graph in Figure 6 is a line that shows the actual flow of IT data received by food farmers from April 2020 to April 2021. While the red line in the graph in Figure 5 is the line that shows the results of forecasting data with the ARIMA model that has been trained with training data. Based on Fig. 6, we also know the MSE value of the ARIMA model, which is 0.2692.
LSTM Parameter Determination
The parameters used by the LSTM model in this study are:
•n input: number of months to be forecast (forecast)
•LSTM: the value in the LSTM layer
•dropout: the value on the dropout
•epoch : number of model training
To train the LSTM model we need to determine the 4 most optimal parameters. In determining the optimal parameters, tests are carried out such as determining the parameters that have been carried out in the ARIMA model. We will test 4 different parameters by looking at the MSE value. To prevent underfit or conditions where the trained model is unable to forecast accurately, the selected parameter is a parameter with an MSE value that is not higher than 0.1 (MSE> 0.1). The following is a table of the results of the MSE test results to determine the parameters.
| Table 1 LSTM Model Parameter Testing |
|||||
|---|---|---|---|---|---|
| n_input | LSTM | dropout | epoch | MSE | loss |
| 12 | 200 | 0.2 | 100 | 0.000021453 | 0.000010727 |
| 11 | 200 | 0.1 | 200 | 0.0081 | 0.0162 |
| 10 | 100 | 0.2 | 100 | 0.1051 | 0.0525 |
Based on the test data obtained from table 1, it can be concluded that the LSTM model has the most optimal MSE value if it is trained with the parameters n input, LSTM, dropout, and epoch of 10, 100, 0.2, 100.
LSTM Model Output
The LSTM model was trained for 100 times (epoch) with LSTM parameters 100,
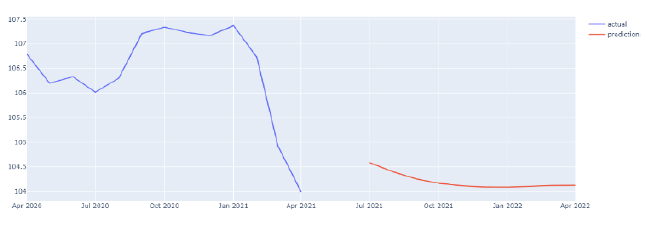
dropout 0.2. To train the LSTM model, 13 food crop farmer IT data were used during the COVID19 pandemic. After being trained, the LSTM model will be used to predict the IT value of food crop farmers in 10 months from July 2020. To see the prediction results (forecasting) in more detail, please see Figure 7.
In Figure 7, the blue line is the line flow that represents the real food crop farmer IT data flow, while the red line represents the predictive data in the form of the IT value of food crop farmers generated by the LSTM model starting from July 2021. The MSE value is obtained after training the LSTM model is 0.1051.
Analysis between ARIMA and LSTM Models
Based on the prediction (forecasting) of the ARIMA and LSTM models, it can be concluded that the LSTM model is the most appropriate model to predict the IT value received by food crop farmers during the COVID19 pandemic. This is concluded from the comparison of the MSE values that are owned by the two models. The MSE value in the ARIMA model is 5.4250 while the MSE value in the LSTM model is 0.1051.
Conclusions
The predictions (forecasting) obtained from the ARIMA and LSTM models have been able to carry out their functions properly. Based on the test results, this time series forecasting model can predict the IT data received by food crop farmers. The results produced by the ARIMA and LSTM models are MSE values and predictive data. The details of the results of this study can be seen in the following points: (1) The dataset used as training data and test data in the ARIMA and LSTM models consists of IT data received by food crop farmers from July 2020 to July 2021 (13 months). (2) The ARIMA model uses a dataset consisting of 11 months of training data and 3 months of test data, while the LSTM model uses a dataset consisting of 13 months of training data. (3) The ARIMA model has an MSE value of 0.2692, while the LSTM model has an MSE value of 0.1051. (3) The prediction generated by the ARIMA model is in the form of predicted IT values from July 2020 to July 2021, while the predictions generated by the LSTM model are predicted IT values for the next 10 months starting from July 2021. (4) The results of the predictive analysis (forecasting) of IT values received by food crop farmers during the COVID19 pandemic using the ARIMA and LSTM models show that the LSTM model has more accurate prediction results than the ARIMA model because the MSE value in the LSTM model is lower than the ARIMA model.
For future work, other researchers can improve the accuracy of the prediction results. The author recommends further research to use more data, pre-processing the data until the data becomes stable before becoming input data in the ARIMA model, and developing a different type of model architecture from the one used.
References
Badan, P.S. (2021). https://sirusa.bps.go.id/sirusa/index.php/indikator/65
Bustanul, A. (2004). Analisis Ekonomi Pertanian Indonesia.
Deepak, J., & Enda, B. (2017). CPU workload forecasting of machines in data centers using LSTM recurrent neural networks and ARIMA models.
Kementerian, P. (2018). https://www.pertanian.go.id/home/?show=news&act=view&id=2564. Accessed on : 17:42, 19/4/2021.
Kiran, K.P., & Arjun, B. (2019). Forecasting of rice cultivation in India – A comparative analysis with ARIMA and LSTM-NN models.
KOMPAS. (2020). https://nasional.kompas.com/read/2020/11/18/12080261/sektor-pertanian-tumbuh-di-masa-pandemi-dinilai-sumbang-pertumbuhan-ekonomi?page=all. Accessed on:186:48, 19/4/2021.
Xianghua, W., Jieqin, Z., Huaying, Y., Duanyang, L., Kang, X., Yiqi, C., … & Fengjuan, X. (2021). The development of a hybrid Wavelet-ARIMA-LSTM model for precipitation amounts and drought analysis.
Yiqing, H. (2020). Bitcoin price prediction using ARIMA and LSTM.
Zahara, S., Sugianto, & Ilmiddafiq, M.B. (2019). Consumer price index prediction using Long Short Term Memory (LSTM) method based on cloud computing. Rest, 357.
Received: 30-Dec-2021, Manuscript No. JMIDS-21-9315; Editor Assigned: 02-Jan-2022, Preqc No. JMIDS-21-9315 (PQ); Reviewed: 15-Jan-2022, QC No. JMIDS-21-9315; Revised: 23-Jan-2022, Manuscript No. JMIDS-21-9315 (R); Published: 30-Jan-2022
