Research Article: 2022 Vol: 21 Issue: 4S
Perceived Factors Affecting Students Academic Performance
M.I. Jawid Nazir, Manipal Academy of Higher Education
Sophia Rahaman, Manipal Academy of Higher Education
Smin Chunawala, Manipal Academy of Higher Education
Gouher Ahmed, Skyline University College
Haitham M. Alzoubi, Skyline University College
Mohammad Alshuride, The University of Jordan & University of Sharjah
Ahmad Qasim Mohammad AlHamad, University of Sharjah
Citation Information: Nazir, M.I.J., Rahaman, S., Chunawala, S., Ahmed, G., Alzoubi, H.M., Alshuride, M., & AlHamad, A.Q.M. (2022). Perceived Factors Affecting Students Academic Performance. Academy of Strategic Management Journal, 21(S4), 1-15.
Abstract
The aim of this study is to understand the possible elements that contribute towards and hinder a students’ academic performance. Upon research, these factors are broadly classified into personal and school factors. The focus of this paper will be on the personal factors among these factors few are more dominant than others. The research study identifies these factors based on their degree of impact. Datasets related to the study are collected, cleaned, and analyzed to prove the claims made earlier on in the paper. Post analysis solutions are drawn to devise methods to tackle the issues faced by students to maximize academic improvement.
Keywords
Behavioral Analysis, Personal Factors, School Factors, Domestic Factors, Data Mining (DM) Principal Component Analysis (PCA), Scree Plot, Confirmatory Factor Analysis (CFA), Exploratory Data Analysis (EDA), Student Academic Performance (SAP)
Introduction
Student Behavior
Student’s performance in academics and an institute’s rate of graduation have always been an important area of investigation for higher educational learning centers (Al-Hamad et al., 2021; Alshurideh et al., 2021; Shahzadi & Ahmad, 2011; Sultan et al., 2021). A research by Simmons, et al. deduced that a student’s family income level, mode of attending: full time/ part time, whether they have received grant aid, and completion advanced level classes in high school among other factors has a statistically important effect on college students (Al-Maroof, 2021; Shahzadi & Ahmad, 2011). According to previous research, a students’ performance can be affected due to social, psychological, economic, environmental, and personal factors (Alsharari & Alshurideh, 2021; Alshurideh, 2015; Mushtaq, 2012). It has been reported that a learner’s performance in school and higher institutes is influenced by various factors including a student’s learning ability, race, gender, etc.(Sumyea; Jiuyong; Lin; Esmaeil; Shane; Murray, 2019; Kurdi, Alshurideh, Salloum, Obeidat, & Al-dweeri, 2020). Additionally, motivation simulates energy and a sense of desire in students to stay committed to a subject, goal, field or job (Al-Maroof et al., 2021; Alshurideh, 2014; Gbollie & Keamu, 2017).
Data Mining
Virtually every educational organization is in the process of exploring and implementing data mining solutions to core problems some of which include the process of registering a new course, designing of new courses, student support, associations to alumina, etc. (Al Batayneh et al., 2021; Muley, Bhalchandra, Joshi, & Wasnik, 2016). Identification of factors that influence student academic performance is vital, so that timely and effective support can be provided to required candidates (Alameeri, Alshurideh, & Al Kurdi, 2021; Leo, Alsharari, Abbas, & Alshurideh, 2021). The data collected during enrolment and after the commencement of a course help provide an important information in assisting with the identification of potential risk indicators that is generally associated with poor academic performance (Amarneh, Alshurideh, Al Kurdi, & Obeidat, 2021; Sumyea et al., 2019). As a result of this insight, institutions can allocate resources and staff more effectively.
Motivation and Objective
Studies have been conducted to understand and analyze factors that affect a student’s academic performance, making the investigation process of factors a topic of exceptional interest in the research of education (Al Kurdi, 2021; Turki, 2021). Researchers have been conducting analysis and research on academic achievement since the 1960s, and it has guided various educational policies regarding the state of admissions and approaches concerning dropout prevention (BAl Kurdi, 2020; Kassarnig et al., 2018) There is still a lack of sufficient studies that have been conducted to analyze the factors that can affect the SAP and in turn assist in improving the learners’ performance (Abaidoo, 2018; Akour, 2021). As we know, students are at the center of the learning process, and so, a study tailored to understanding their motivations and strategies, and about factors that hinder their learning becomes imperative seeing as how students themselves play a pivotal role in shifting their own learning and in acquiring enhanced academic achievement (Al-Khayyal, 2017).
Factors Affecting SAP
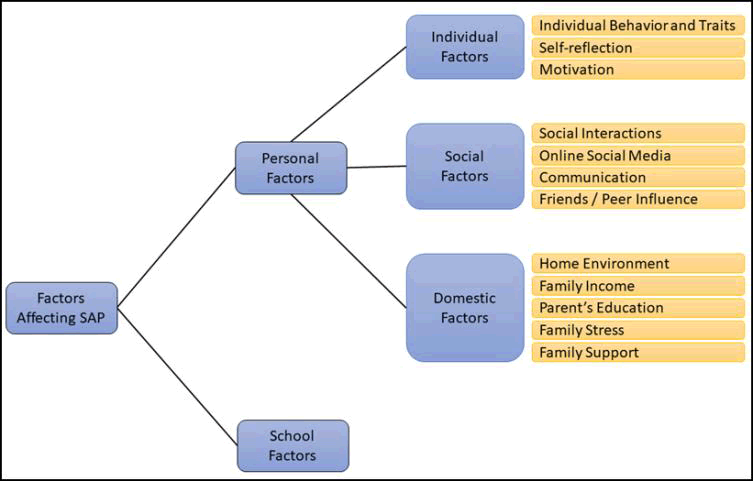
Personal Factors
- Individual Factors
A research conducted analysis on a wide spectrum of individual characteristics like personal history, perception, behavior, etc. (Alameeri, 2021; Alshamsi, 2021). Other studies used smartphones of students to collect data regarding student activity, mental health, social behavior, etc. (Alshurideh, 2019; Alshurideh, 2020; Bettayeb, 2020; Kassarnig et al., 2018). Both these research groups noticed a correlation the learner’s performance and all the feature categories, concluding that academic performance is not limited to a single aspect, rather multiple aspects of an individual’s life (Al Dmour, 2014; Alshurideh, 2019; Alshurideh, 2019). A large research department at the intersection of education and psychology investigated the relation between a learner’s personality and its impact on performance. A study conducted relays that when someone’s concept of self matches what they feel, think, and do then they are able to realize their maximum potential (Cavilla, 2017; Al Kurdi, 2021). Students having optimal motivation show a certain edge compared to the rest of their peers because they tend to have adaptive attitudes and keep modifying their strategies based on the workload, situation, (Alhamad et al., 2021; Alsuwaidi, 2021; Gbollie & Keamu, 2017).
- Social Factors
In regard to a learner’s “Social Interactions”, two approaches are dominant (Al Khasawneh et al., 2021; Ghazal et al., 2021; Kassarnig et al., 2018). The first focuses on the relation between a learner’s grades and other academic related measures and that of his/her peers based on a hypothesis specifying the similarity in learner and peer achievement, also known as the “peer effect” (Ali et al., 2021; Kassarnig et al., 2018). The second centers on the positive influence of having a central position in the student social network (Abu Zayyad et al., 2021; Almazrouei, Alshurideh, Al Kurdi, & Salloum, 2021). Majority of existing studies show that increased amount of time social media has a negative impact on a learner’s academic performance. Participating and communicating thoughts with others helps get clarity in certain aspects, especially as a student Communicating well in English also increases student confidence (Al Khasawneh et al., 2021; Alyammahi et al., 2021; Alzoubi & Aziz, 2021; Mushtaq, 2012). According to a study, it has been said that the influence of friends is more powerful than family seeing how they are the same age and in the same environment for long periods of (Aljumah, 2021; Alzoubi, 2021; Razak et al., 2019).
- Domestic Factors
Family background deeply affects a child’s response and reaction to real world situations and performance (AlShehhi et al., 2020; M. Alshurideh, Al Kurdi, Abu Hussien, & Alshaar, 2017; Alshurideh et al., 2016). A study showed that low achievers typically came from families where their biological father wasn’t present (ALnuaimi et al., 2020; Onatsu-Arvilommi & Nurmi, 1997). Studies have shown that great parenting style and active parental involvement have a positive correlation to academic outcomes (Alshurideh, Gasaymeh, Alzoubi, & Kurd, 2020; Shahzadi & Ahmad, 2011). A research conducted in Pakistan on university students showed that stress on a student from their home and family can have a negative impact on a student (Alzoubi, 2020; Mushtaq, 2012).
School/University Factors and Academic Behavior
This section discusses the school factors, which include academic behavior and student tendencies in and out of the classroom. Among these factors, unsurprisingly attendance is one of the factors considered in determining a student’s academic performance (Joghee, 2020; Rajab & Ramadhan, 2019). An ideal learning environment has the strongest aspects of blended learning and traditional learning (Alzoubi & Yanamandra, 2020; Ismail, Mahmood, & Abdelmaboud, 2018). Additionally, good infrastructure motivates students to perform better (Chowdhry, 2014; Mehmood et al., 2019; Nuseir et al., 2021).
Methodology
Focus and Approach of the Paper
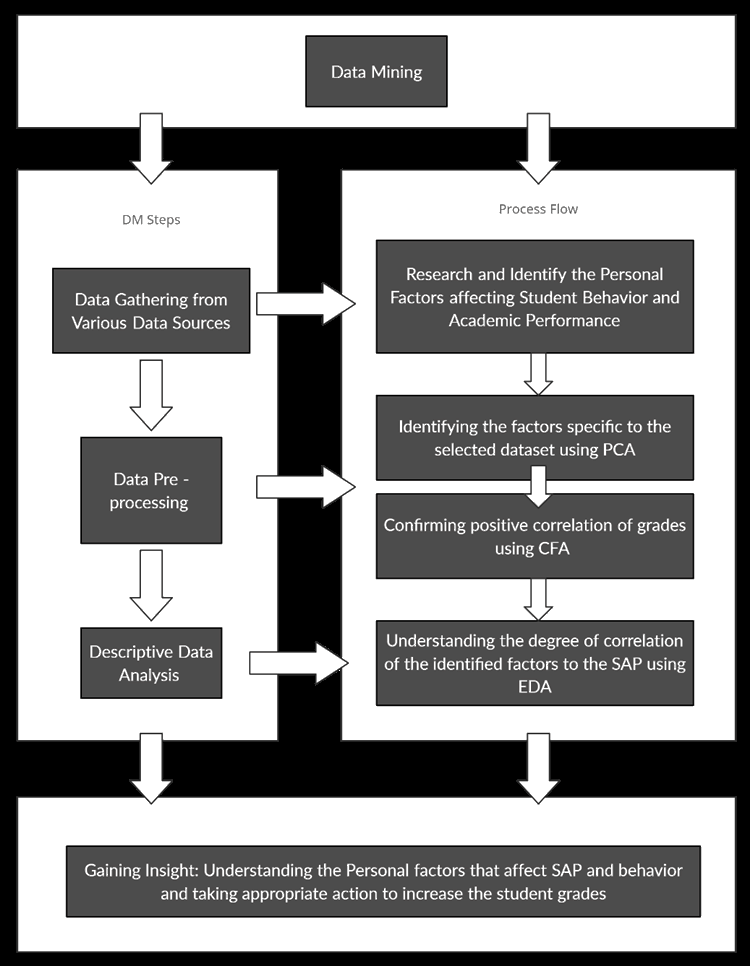
In this paper, a theoretical study is first conducted to understand the possible factors that may affect SAP. The paper then classifies these factors as personal and school factors, while focusing on the personal factors. A dataset is selected to conduct a practical investigation on the personal factors affecting the SAP (Alzoubi et al., 2019; Cortez & Silva, 2008). Basis the theoretical study, all the potential factors is chosen from the selected dataset. These attributes are then pre-processed using a data mining technique called PCA to understand if they do in fact affect the SAP. After this, the grades are pre-processed using CFA to check if they grades are strongly positively correlated. If so, the grades are combined as one and the rest of the factors are then compared to the grades using EDA to examine to what degree these factors affect the SAP. Depicted in Fig. 2 is the paper methodology adapted for this study.
Dataset
- Introduction to the Dataset
A sample dataset has been taken from an open source site ‘UCI Machine Learning Repository’ to identify which factors affect a student’s academic performance (Cortez, 2014). This dataset was published on the website on November 27, 2014. It contains data collected from the students in a school located in Portugal. It contains 32 attributes regarding factors that may affect a student’s academic performance. It contains the marks of 3 tests conducted in the subject of math (Haitham, 2019; Cortez & Silva, 2008). These attributes of this dataset have been described in the ‘data world’ open source site in detail (Alnazer, Alnuaimi, M. & Alzoubi, 2017; Cortez, 2017). Additionally, these pre-processed student attributes have also been explained in a data mining study (Cortez & Silva, 2008).
Computational Environment
PCA and CFA are conducted using RStudio. EDA is then conducted to verify the claims made from the PCA using Python 3 code in Jupyter notebook by importing the pandas and matplot libraries for plotting graph points to show the degree of effect that each of the identified factors have on a student’s class performance.
Discussion
The dataset is cleaned and then PCA and CFA are conducted on the dataset. The outputs of these analyses (PCA and CFA) are then used as the basis for the EDA that is conducted in the section 4.1 of this paper. PCA is a method used to identify important variables from a high dimensional dataset (Chaudhary, 2020). It is a statistical analysis method that allows variables to be regrouped into a smaller number of variables, called components. Variables are regrouped in such a way that the first, newly created, component (PC1 in this case as shown below) contains a maximum of variation (Hayden, 2018). The essence of CFA is to check how well the measured variables represent the number of constructs (Solutions, 2013). CFA was carried out on 3 variables: G1, G2, G3 to reduce their dimensions to a single new variable: ‘G’, indicating average grade. The outputs of these two analyses are then used as the basis for the EDA. This analysis is used to perform investigations on given data to discover patterns and to verify hypothesis made by generating visual graphical representations and with the help of summary statistics (Patil, 2018).
PCA using RStudio
Preliminary Stage: Since PCA in RStudio works only with numeric values, the dataset was processed, and certain changes were made to non-numeric entries which have been summarized below:
- Address - student's home address type (binary: 1 - urban; 0 - rural)
- Famsize - family size (binary: 0 - less or equal to 3; 1 - greater than 3)
- Pstatus - parent's cohabitation status (binary: 1 - living together; 0 - apart)
- Guardian - student's guardian (numeric: 0: 'father'; 1: 'mother'; 2: 'other')
- Schoolsup – extra school support (binary: 0 – no; 1 - yes)
- Famsup - family support (in education) (binary: 0 – no; 1 - yes)
- Paid - extra paid classes within the course subject (binary: 0 – no; 1 - yes)
- Activities - extra-curricular activities (binary: 0 – no; 1 - yes)
- Nursery - attended nursery school (binary: 0 – no; 1 - yes)
- Higher - wants to take higher education (binary: 0 – no; 1 - yes)
- Internet - Internet access at home (binary: 0 – no; 1 - yes)
- Romantic - with a romantic relationship (binary: 0 – no; 1 - yes)
Scree Plot
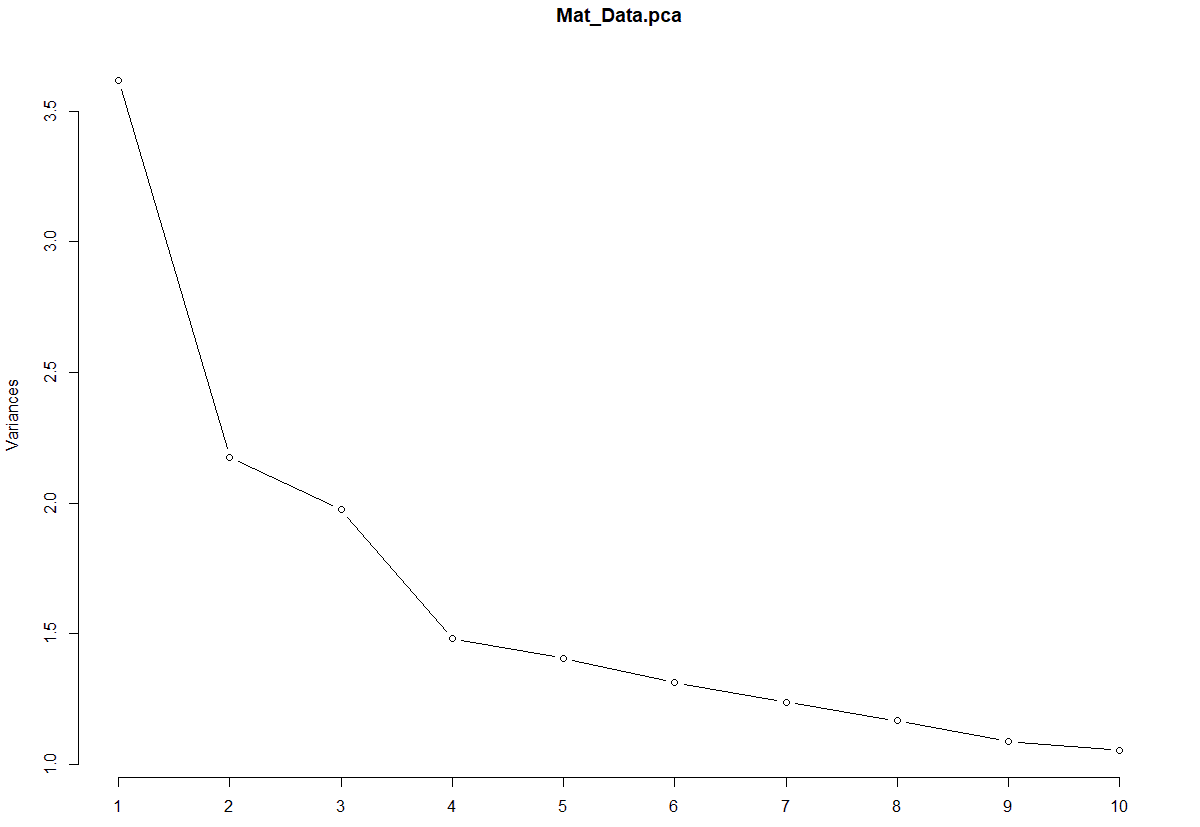
As shown in Fig. 3, we can observe that PC1 captures the most variation, PC2 captures the second most, and so on (Datavizpyr, 2020). The essence is that the first 2-3 PCs should suffice in describing the crux of the data and this becomes visible when the steep curve on the plot quickly flattens out after the first few initial PCs.
PCA Biplot
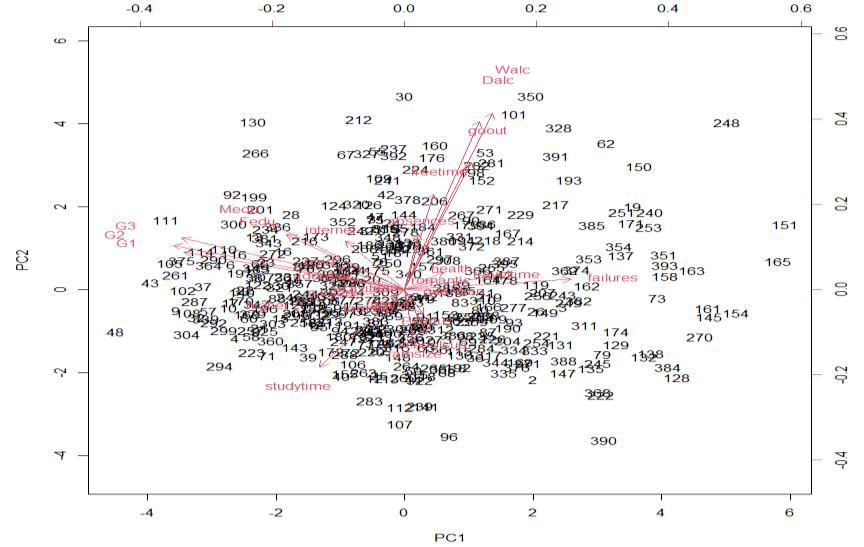
The plot in Fig. 4 shows the attributes as vectors. The bottom and the left axes of the plot are used to read the PCA scores of the samples i.e., the dots. The top and right axes are a part of the loading plot. They are used to read how strongly each characteristic, that is how strongly each vector influences the PCs (Ngo, 2018).
A PCA biplot represents:
- PC scores of data – dots
- Loadings of the variables’ vectors
The further the vectors are from a PC origin, the more the influence they have on that PC. One important thing to note about loading plots is how variables displayed in the plot correlate with one another (Ngo, 2018). The basic idea is that an acute angle implies positive correlation between the attributes and on the other hand a large or obtuse angle suggests negative correlation between the variables. In addition, a 90° angle implies that there is no correlation between two characteristics.
So, for example:
- G1, G2 and G3: The vectors are close, forming an acute angle between them, because of this we conclude that the variables they represent are positively correlated.
- Internet and health: As they meet each other at approximately 90°, hence we conclude that they are not likely to be correlated.
- Failures and study time: They form an obtuse angle, so we infer that they are negatively correlated.
Observations
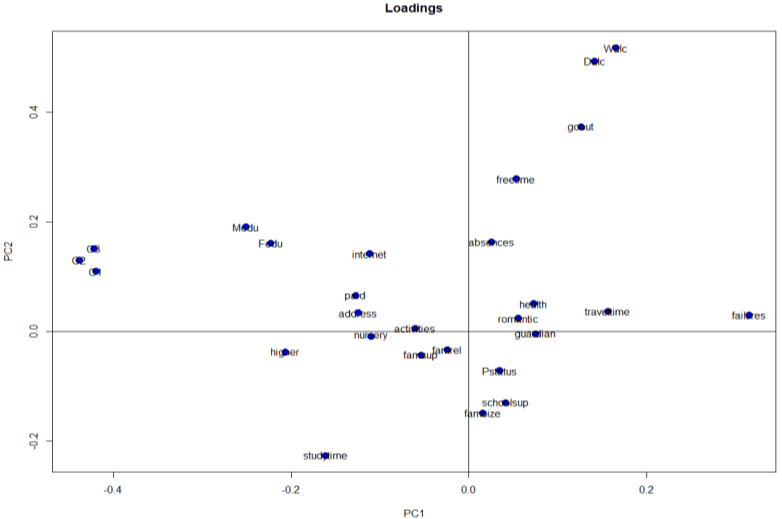
From the loading plot as shown in Fig. 5, we can select the attributes that are farthest away from the point of origin, so in descending order the key personal factors identified are as follows:
- G1, G2, G3
- Daily and weekend alcohol consumption
- Outings
- Free time
- Mother’s and Father’s education
Since the angle between the two vectors: Walc and G1/G2/G3 is > 90 we can conclude that there is a negative correlation between grades and alcohol consumption. There is an acute angle between the parents’ education and the student’s academic performance, but since the angle is not very close, we can conclude that there is a positive correlation between the two factors but not a very strong one.
CFA Using RStudio
Observations
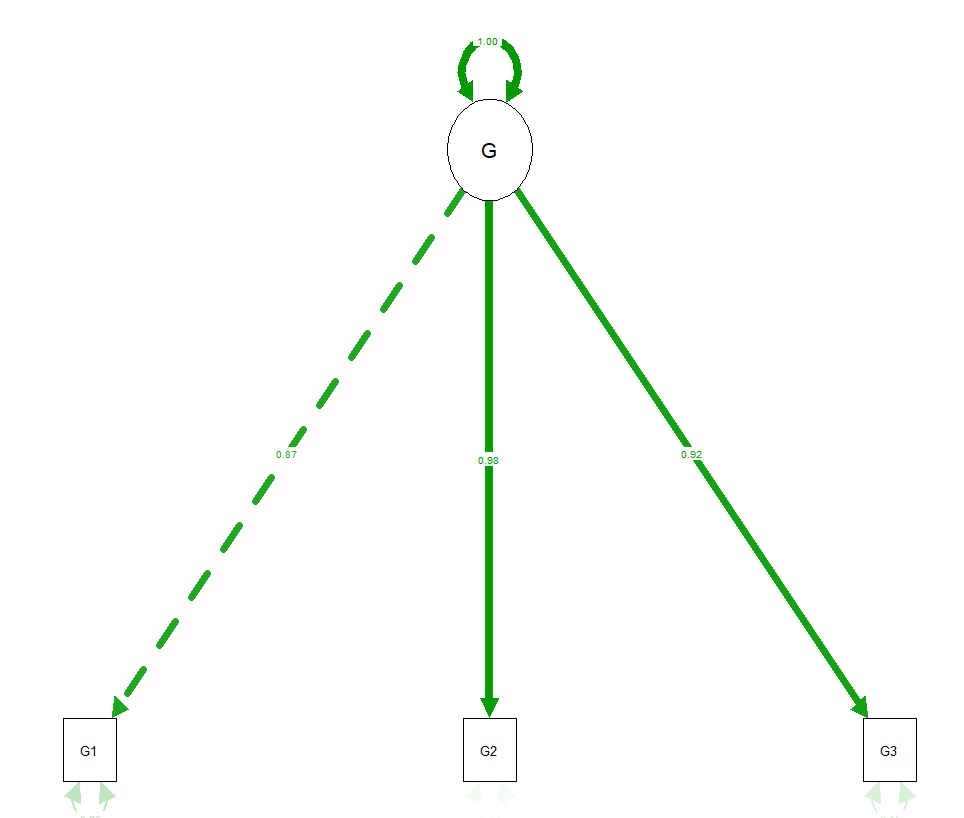
The strong green lines shown in Fig. 6 indicate that there is a strong positive relation between the variables.
G1 has a value of 0.87, G2 has a value of 0.98 and G3 has a value of 0.92.
CFA reduced the dimensions of G1, G2 and G3 to a single joined variable G hence reducing the dimensions of the data, further simplifying analysis.
Analysis and Results
Exploratory Data Analysis
This analysis was done to get a visual depiction of the extent of how each factor affects a student’s academic performance and prove the results and conclusions drawn from the principal component analysis. Bivariate analysis is conducted in the following section. The factors considered for this analysis are the factors identified from the PCA in section 3.4.2 of the paper. The following graphs are plotted:
| Table 1 Exploratory data analysis |
||
|---|---|---|
| Graph | x-Axis | y-Axis |
| A | Daily Alcohol Consumption (Dalc) | Average Grades (G) |
| B | Weekend Alcohol Consumption (Walc) | Average Grades (G) |
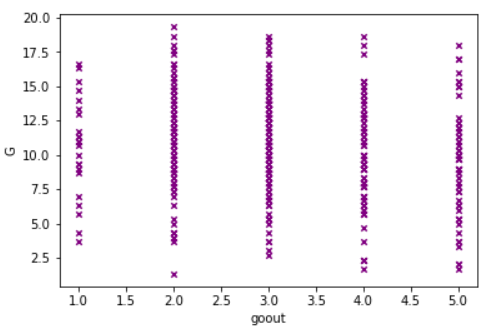
| C | Outings (goout) | Average Grades (G) |
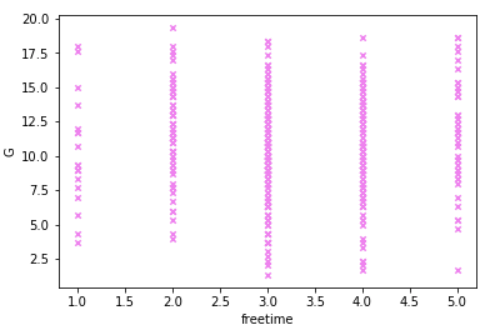
| D | Amount of Free Time (freetime) | Average Grades (G) |
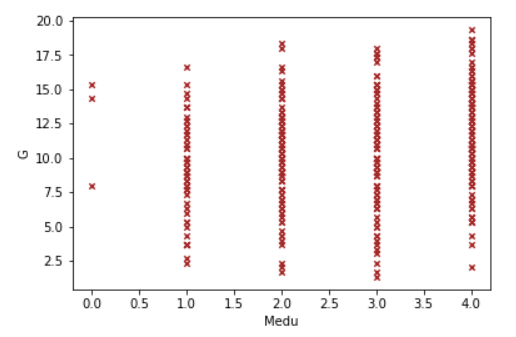
| E | Mother’s Education (Medu) | Average Grades (G) |
| F | Father’s Education (Fedu) | Average Grades (G) |
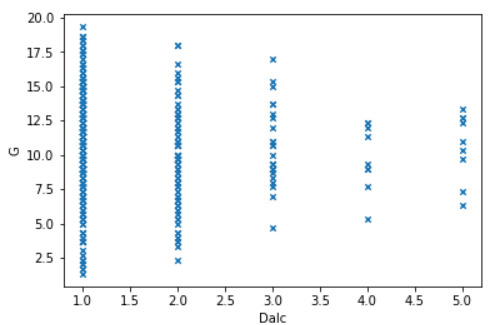
Figure 7 exhibits the graph where the grades are displayed on the x axis and the students having alcohol consumption daily is on the y axis. From the graph, the researchers observe there is a strong negative correlation between a student’s academic performance and the regularity of alcohol consumption.
B. Walc vs. G
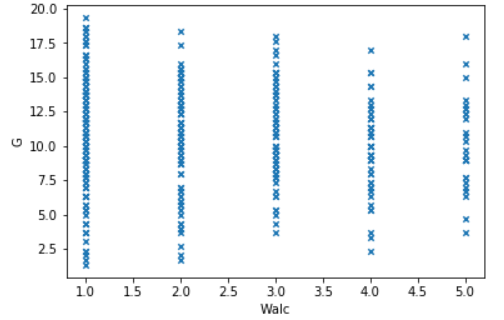
From the graph depicted in Fig. 8, it is evident that weekend alcohol consumption does not have a weak negative correlation to a student’s grades. So even though students consuming more alcohol on the weekends do not score as high as the student’s that consume less alcohol, they still do get affected.
C. Goout vs. G
The graph depicted in Fig. 9 shows that outings do not have a significant impact on grades. However, students that go out an average amount have scores higher than the ones that do not go out or go out too frequently.
D. Freetime vs. G
The graph depicted in Fig. 10 shows the effect of outings frequented on a student’s academic performance. The x axis represents the student’s free time and y axis depicts the grades. As evident, no clear pattern can be noted or drawn from the graph.
E. Medu vs. G
So, from the graph in Fig. 11 we can draw that even though the mother being less educated does not have a very significant impact on the grades, we can still see that some of the highest grades are of student’s whose mother has a comparatively high level of education.
F. Fedu vs. G
Lastly, from the graph in Fig. 12 we notice, like the mother’s education the father’s education level does not have a significant impact on the student’s academic performance. However, in both cases, the students whose parents are not educated do not perform exceptionally well. Showing that the parent’s education level has a loose positive correlation on the student’s performance.
Conclusion and Further Research
The above study was conducted to get an insight into the factors that affect a student’s academic performance and to what degree certain factors do. By understanding the reasons of good or bad performance the educators can come up with solutions on how to enhance the quality of learning for the students who really need it and continually motivate the ones who are already performing well to keep doing better as motivation has a positive impact on students. This study identified the key factors out of the multiple attributes presented in the dataset. The selection of these certain factors was made as these factors showed the highest level of variation. To prove the claims made in conclusion of the principal component analysis, exploratory data analysis was conducted on the processed data and depicted visually by plotting points using graphs. Looking into the results of the factors can help make a big change if these measures are investigated. Analysis can be conducted for individual schools independently as they may all have different key factors and steps can be taken accordingly. These analyses can be conducted at regular intervals to see how changes made have affected students and if the impact was positive or negative and then study can be modified according to the results generated.
Acknowledgement
The corresponding Author is Dr Muhammad Alshurideh, Associate Professor, The University of Jordan and University of Sharjah is the corresponding author for the paper.
References
Abaidoo, A. (2018). Factors contributing to academic performance of students in a Junior High School. GRIN Verlag, 99.
Abu Zayyad, H.M., Obeidat, Z.M., Alshurideh, M.T., Abuhashesh, M., Maqableh, M., & Masa’deh, R. (2021). Corporate social responsibility and patronage intentions: The mediating effect of brand credibility. Journal of Marketing Communications, 27(5), 510-533.
Crossref, GoogleScholar, Indexed at
Akour, I., Alshurideh, M., Al Kurdi, B., Al Ali, A., & Salloum, S. (2021). Using machine learning algorithms to predict people’s intention to use mobile learning platforms during the COVID-19 pandemic: Machine learning approach. JMIR Medical Education, 7(1), 1-17.
Crossref, GoogleScholar, Indexed at
Al-Hamad, M., Mbaidin, H., AlHamad, A., Alshurideh, M., Kurdi, B., & Al-Hamad, N. (2021). Investigating students’ behavioral intention to use mobile learning in higher education in UAE during Coronavirus-19 pandemic. International Journal of Data and Network Science, 5(3), 321-330.
Crossref, GoogleScholar, Indexed at
Al-Khayyal, A., Alshurideh, M., Al Kurdi, B., & Salloum, S. A. (2020). Factors influencing electronic service quality on electronic loyalty in online shopping context: Data analysis approach. In Enabling AI Applications in Data Science (pp. 367–378). Springer.
Crossref, GoogleScholar, Indexed at
Al-Maroof, R., Ayoubi, K., Alhumaid, K., Aburayya, A., Alshurideh, M., Alfaisal, R., & Salloum, S. (2021). The acceptance of social media video for knowledge acquisition, sharing and application: A comparative study among YouYube users and TikTok users’ for medical purposes. International Journal of Data and Network Science, 5(3), 197-214.
Crossref, GoogleScholar, Indexed at
Al-Maroof, R.S., Alshurideh, M.T., Salloum, S.A., AlHamad, A.Q.M., & Gaber, T. (2021). Acceptance of Google Meet during the spread of Coronavirus by Arab university students. Informatics, 8(2), 24, 1-17.
Crossref, GoogleScholar, Indexed at
Al Batayneh, R.M., Taleb, N., Said, R.A., Alshurideh, M.T., Ghazal, T.M., & Alzoubi, H.M. (2021). IT Governance framework and smart services integration for future development of Dubai infrastructure utilizing AI and big data, its reflection on the citizens standard of living. The International Conference on Artificial Intelligence and Computer Vision, 235–247.
Crossref, GoogleScholar, Indexed at
Al Dmour, H., Alshurideh, M., & Shishan, F. (2014). The influence of mobile application quality and attributes on the continuance intention of mobile shopping. Life Science Journal, 11(10), 172–181.
Al Khasawneh, M., Abuhashesh, M., Ahmad, A., Alshurideh, M.T., & Masa’deh, R. (2021). Determinants of e-word of mouth on social media during covid-19 outbreaks: an empirical study. Studies in Systems, Decision and Control, 334, 347-366.
Crossref, GoogleScholar, Indexed at
Al Khasawneh, M., Abuhashesh, M., Ahmad, A., Masa’deh, R., & Alshurideh, M. T. (2021). Customers online engagement with social media influencers’ content related to Covid 19. The Effect of Coronavirus Disease (COVID-19) on Business Intelligence, 334, 404–385.
Crossref, GoogleScholar, Indexed at
Al Kurdi, B., Alshurideh, M., Nuseir, M., Aburayya, A., & Salloum, S.A. (2021). The effects of subjective norm on the intention to use social media networks: An exploratory study using PLS-SEM and machine learning approach. Advanced Machine Learning Technologies and Applications: Proceedings of AMLTA 2021, 581–592. Springer International Publishing.
Crossref, GoogleScholar, Indexed at
Al Kurdi, B., Alshurideh, M., & Salloum, S. A. (2020). Investigating a theoretical framework for e-learning technology acceptance. International Journal of Electrical and Computer Engineering (IJECE), 10(6), 6484-6496.
Crossref, GoogleScholar, Indexed at
Alameeri, K.A., Alshurideh, M.T., & Al Kurdi, B. (2021). The effect of Covid-19 pandemic on business systems’ innovation and entrepreneurship and how to cope with it: A theatrical view. The Effect of Coronavirus Disease (COVID-19) on Business Intelligence, 334, 275-288.
Crossref, GoogleScholar, Indexed at
Alameeri, K., Alshurideh, M., Al Kurdi, B., & Salloum, S.A. (2021). The effect of work environment happiness on employee leadership. Advances in Intelligent Systems and Computing, 668-680.
Crossref, GoogleScholar, Indexed at
Alhamad, A.Q.M., Akour, I., Alshurideh, M., Al-Hamad, A.Q., Kurdi, B. Al, & Alzoubi, H. (2021). Predicting the intention to use google glass: A comparative approach using machine learning models and PLS-SEM. International Journal of Data and Network Science, 5(3), 311-320.
Crossref, GoogleScholar,, Indexed at
Ali, N., Ahmed, A., Anum, L., Ghazal, T.M., Abbas, S., Khan, M.A., Ahmad, M. (2021). Modelling supply chain information collaboration empowered with machine learning technique. Intelligent Automation and Soft Computing, 30(1), 243-257.
Crossref, GoogleScholar, Indexed at
Aljumah, A., Nuseir, M.T., & Alshurideh, M.T. (2021). The impact of social media marketing communications on consumer response during the Covid-19: Does the brand equity of a university matter. The Effect of Coronavirus Disease (COVID-19) on Business Intelligence, 334, 384-367.
Crossref, GoogleScholar, Indexed at
Almazrouei, F.A., Alshurideh, M., Al Kurdi, B., & Salloum, S.A. (2021). Social media impact on business: A systematic review. Advances in Intelligent Systems and Computing.
Crossref, GoogleScholar, Indexed at
Alnazer, N., Alnuaimi, M. & Alzoubi, H. (2017). Analyzing the appropriate cognitive styles and its effect on strategic innovation in Jordanian universities. International Journal of Business Excellence, 13(1), 127-140.
Crossref, GoogleScholar, Indexed at
ALnuaimi, M., Alzoubi, H., Dana Ajelat & Alzoubi, A. (2020). Toward intelligent organizations: An empirical investigation of learning orientation’s role in technical innovation. International Journal of Innovation and Learning, 29(2), 207–221.
Crossref, GoogleScholar, Indexed at
Alshamsi, A., Alshurideh, M., Kurdi, B.A., & Salloum, S.A. (2021). The influence of service quality on customer retention: A systematic review in the higher education. Advances in Intelligent Systems and Computing, 404-416.
Crossref, GoogleScholar, Indexed at
Alsharari, N.M., & Alshurideh, M.T. (2021). Student retention in higher education: the role of creativity, emotional intelligence and learner autonomy. International Journal of Educational Management, 35(1), 233-247.
Crossref, GoogleScholar, Indexed at
AlShehhi, H., Alshurideh, M., Al Kurdi, B., & Salloum, S.A. (2020). The impact of ethical leadership on employees performance: A systematic review. International Conference on Advanced Intelligent Systems and Informatics, 417-426.
Crossref, GoogleScholar, Indexed at
Alshurideh, M. (2014). The factors predicting students’ satisfaction with universities’ healthcare clinics’ services: A case-study from the Jordanian higher education sector. Dirasat: Administrative Sciences, 161(1524), 1-36.
Crossref, GoogleScholar, Indexed at
Alshurideh, M., Al Kurdi, B., Abu Hussien, A., & Alshaar, H. (2017). Determining the main factors affecting consumers’ acceptance of ethical advertising: A review of the Jordanian market. Journal of Marketing Communications, 23(5), 513–532.
Crossref, GoogleScholar, Indexed at
Alshurideh, M., Al Kurdi, B., & Salloum, S. (2019). Examining the main mobile learning system drivers’ effects: A mix empirical examination of both the Expectation-Confirmation Model (ECM) and the Technology Acceptance Model (TAM). International Conference on Advanced Intelligent Systems and Informatics, 406-417.
Crossref, GoogleScholar, Indexed at
Alshurideh, M., Salloum, S.A., Al Kurdi, B., & Al-Emran, M. (2019). Factors affecting the social networks acceptance: An empirical study using PLS-SEM approach. ACM International Conference Proceeding Series, Part F1479, 414-418.
Crossref, GoogleScholar, Indexed at
Alshurideh, M.T., Kurdi, B. Al, AlHamad, A.Q., Salloum, S.A., Alkurdi, S., Dehghan, A., Masa’deh, R. (2021). Factors affecting the use of smart mobile examination platforms by universities’ postgraduate students during the COVID 19 pandemic: an empirical study. Informatics, 8(2), 32, 1-21.
Crossref, GoogleScholar, Indexed at
Alshurideh, M, Al Kurdi, B., Vij, A., Obiedat, Z., & Naser, A. (2016). Marketing ethics and relationship marketing-An empirical study that measure the effect of ethics practices application on maintaining relationships with customers. International Business Research, 9(9), 78-90.
Crossref, GoogleScholar, Indexed at
Alshurideh, M, Bataineh, A., Al kurdi, B., & Alasmr, N. (2015). Factors affect mobile phone brand choices–Studying the case of Jordan universities students. International Business Research, 8(3), 141-155.
Crossref, GoogleScholar, Indexed at
Alshurideh, M, Salloum, S.A., Al Kurdi, B., Monem, A.A., & Shaalan, K. (2019). Understanding the quality determinants that influence the intention to use the mobile learning platforms: A practical study. International Journal of Interactive Mobile Technologies (IJIM), 13(11), 157-183.
Crossref, GoogleScholar, Indexed at
Alshurideh, M., Al Kurdi, B., Salloum, S.A., Arpaci, I., & Al-Emran, M. (2020). Predicting the actual use of m-learning systems: a comparative approach using PLS-SEM and machine learning algorithms. Interactive Learning Environments, 1–15.
Crossref, GoogleScholar, Indexed at
Alshurideh, M., Gasaymeh, A., Ahmed, G., Alzoubi, H., & Kurd, B. Al. (2020). Loyalty program effectiveness: Theoretical reviews and practical proofs. Uncertain Supply Chain Management, 8(3), 599-612.
Crossref, GoogleScholar, Indexed at
Alsuwaidi, M., Alshurideh, M., Al Kurdi, B., & Salloum, S.A. (2021). Performance Appraisal on Employees’ Motivation: A Comprehensive Analysis. Retrieved from https://doi.org/10.1007/978-3-030-58669-0_61.
Crossref, GoogleScholar, Indexed at
Alyammahi, A., Alshurideh, M., Kurdi, B.A., & Salloum, S.A. (2021). The Impacts of Communication Ethics on Workplace Decision Making and Productivity. Advances in Intelligent Systems and Computing, 488-500.
Crossref, GoogleScholar, Indexed at
Alzoubi, H., Ahmed, G., Al-Gasaymeh, A., & Alkurdi, B. (2019). Empirical study on Sustainable Supply Chain Strategies and its impact on Competitive Priorities: The mediating role of Supply Chain Collaboration. Management Science Letters, 10(3), 703-708.
Crossref, GoogleScholar, Indexed at
Alzoubi, H.M., & Aziz, R. (2021). Does emotional intelligence contribute to quality of strategic decisions? The mediating role of open innovation. Journal of Open Innovation: Technology, Market, and Complexity, 7(2), 130, 1-20.
Crossref, GoogleScholar, Indexed at
Alzoubi, H.M., Vij, M., Vij, A., & Hanaysha, J.R. (2021). What leads guests to satisfaction and loyalty in UAE five-star hotels? AHP analysis to service quality dimensions. Enlightening Tourism, 11(1), 102-135.
Crossref, GoogleScholar, Indexed at
Alzoubi, H.M., & Yanamandra, R. (2020). Investigating the mediating role of information sharing strategy on agile supply chain in supply chain performance. Uncertain Supply Chain Management, 8(2), 273–284.
Crossref, GoogleScholar, Indexed at
Alzoubi, Haitham, & Ahmed, G. (2019). Do TQM practices improve organisational success? A case study of electronics industry in the UAE. International Journal of Economics and Business Research, 17(4), 459-472.
Crossref, GoogleScholar, Indexed at
Alzoubi, H., Alshurideh, M., Kurdi, B. Al, & Inairat, M. (2020). Do perceived service value, quality, price fairness and service recovery shape customer satisfaction and delight? A practical study in the service telecommunication context. Uncertain Supply Chain Management, 8(3), 579-588.
Crossref, GoogleScholar, Indexed at
Amarneh, B.M., Alshurideh, M.T., Al Kurdi, B.H., & Obeidat, Z. (2021). The impact of COVID-19 on E-learning: Advantages and challenges. The International Conference on Artificial Intelligence and Computer Vision, 75-89.
Crossref, GoogleScholar, Indexed at
Bettayeb, H., Alshurideh, M.T., & Al Kurdi, B. (2020). The effectiveness of Mobile Learning in UAE Universities: A systematic review of Motivation, Self-efficacy, Usability and Usefulness. International Journal of Control and Automation, 13(2), 1558-1579.
Cavilla, D. (2017). The effects of student reflection on academic performance and motivation. SAGE Open, 7(3), 1-13.
Crossref, GoogleScholar, Indexed at
Chaudhary, M. (2020). Importance of principal component analysis.
Chowdhry, S., Sieler, K., & Alwis, L. (2014). A study of the impact of technology-enhanced learning on student academic performance. Journal of Perspectives in Applied Academic Practice, 2(3), 2-15.
Crossref, GoogleScholar, Indexed at
Cortez, P. (2014). Student Performance Data Set.
Cortez, P. (2017). Student Performance. Retrieved from https://doi.org/uci/student-performance.
Cortez, P., & Silva, A. (2008). Using data mining to predict secondary school student performance. 15th European Concurrent Engineering Conference 2008, ECEC 2008 - 5th Future Business Technology Conference, FUBUTEC 2008, 2003(2000), 5–12.
Datavizpyr. (2020). How to Make Scree Plot in R with ggplot2.
Gbollie, C., & Keamu, H.P. (2017). Student academic performance: The role of motivation, strategies, and perceived factors hindering liberian junior and senior high school students learning. Education Research International, 2017, 1-11.
Crossref, GoogleScholar, Indexed at
Ghazal, T.M., Hasan, M.K., Alshurideh, M.T., Alzoubi, H.M., Ahmad, M., Akbar, S.S., Akour, I.A. (2021). IoT for Smart Cities: Machine Learning Approaches in Smart Healthcare—A Review. Future Internet, 13(8), 218.
Crossref, GoogleScholar, Indexed at
Hayden, L. (2018). Principal Component Analysis in R.
Helal, S., Li, J., Liu, L., & Ebrahimie, E. (2019). Identifying key factors of student academic performance by subgroup discovery. International Journal of Data Science and Analytics, 7(3), 227-245.
Crossref, GoogleScholar, Indexed at
Ismail, A.O.A., Mahmood, A.K., & Abdelmaboud, A. (2018). Factors influencing academic performance of students in blended and traditional domains. International Journal of Emerging Technologies in Learning, 13(2), 170-187.
Crossref, GoogleScholar, Indexed at
Joghee, S., Alzoubi, H.M., & Dubey, A.R. (2020). Decisions effectiveness of FDI investment biases at real estate industry: Empirical evidence from Dubai smart city projects. International Journal of Scientific and Technology Research, 9(3), 3499-3503.
Kassarnig, V., Mones, E., Bjerre-Nielsen, A., Sapiezynski, P., Lassen, D.D., & Lehmann, S. (2018). Academic performance and behavioral patterns. EPJ Data Science, 7(1), 1-16.
Crossref, GoogleScholar, Indexed at
Kurdi, B. Al, Elrehail, H., Alzoubi, H. M., Alshurideh, M., & Al-adaileh, R. (2021). The interplay among HRM practices, job satisfaction and intention to leave : An empirical agenda. 24(1), 1–14.
Kurdi, B. A., Alshurideh, M., Salloum, S. A., Obeidat, Z. M., & Al-dweeri, R. M. (2020). An empirical investigation into examination of factors influencing university students’ behavior towards elearning acceptance using SEM approach. International Journal of Interactive Mobile Technologies, 14(2), 19-41.
Crossref, GoogleScholar, Indexed at
Leo, S., Alsharari, N. M., Abbas, J., & Alshurideh, M.T. (2021). From offline to online learning: A qualitative study of challenges and opportunities as a response to the covid-19 pandemic in the UAE higher education context. The Effect of Coronavirus Disease (COVID-19) on Business Intelligence, 334, 203–217.
Crossref, GoogleScholar, Indexed at
Mehmood, T., Alzoubi, H.M., Alshurideh, M., Al-Gasaymeh, A., & Ahmed, G. (2019). Schumpeterian entrepreneurship theory: evolution and relevance. Academy of Entrepreneurship Journal, 25(4), 1–10.
Muley, A., Bhalchandra, P., Joshi, M., & Wasnik, P. (2016). FA-02: Prognostication of student’s performance : Factor analysis strategy for educational dataset. India, 4(1), 12-21.
Mushtaq, K. (2012). Factors affecting students’ academic performance. Global Journal of Management and Business Research, 12(9), 7. GoogleScholar, Indexed at
Ngo, L. (2018). How to read PCA biplots and scree plots.
Nuseir, M.T., Al Kurdi, B.H., Alshurideh, M.T., & Alzoubi, H.M. (2021). Gender Discrimination at Workplace: Do Artificial Intelligence (AI) and Machine Learning (ML) Have Opinions About It. The International Conference on Artificial Intelligence and Computer Vision, 301–316. Springer.
Crossref, GoogleScholar, Indexed at
Onatsu-Arvilommi, T.P., & Nurmi, J.E. (1997). Family background and problems at school and in society: The role of family composition, emotional atmosphere and parental education. European Journal of Psychology of Education, 12(3), 16.
Crossref, GoogleScholar, Indexed at
Patil, P. (2018). What is exploratory data analysis?
Rajab, A.M., & Ramadhan, M.R. (2019). Application of Data Mining Techniques in Students’ Performance Prediction and Analysis. International Journal of Academic Information Systems Research (IJAISR), 3(March), 23–36.
Razak, W.M.W.A., Baharom, S.A.S., Abdullah, Z., Hamdan, H., Aziz, N.U.A., & Anuar, A.I.M. (2019). Academic performance of university students: A case in a higher learning institution.
Crossref, GoogleScholar, Indexed at
Shahzadi, E., & Ahmad, Z. (2011). A study on academic performance of university students. 8th International Conference on Recent Advances in Statistics, (October), 255-268.
Crossref, GoogleScholar, Indexed at
Solutions, S. (2013). Confirmatory factor analysis.
Sultan, R.A., Alqallaf, A.K., Alzarooni, S.A., Alrahma, N.H., AlAli, M.A., & Alshurideh, M.T. (2021). How students influence faculty satisfaction with online courses and do the age of faculty matter. The International Conference on Artificial Intelligence and Computer Vision, 823-837.
Crossref, GoogleScholar, Indexed at
Turki, A.M., Barween, A.K., Ra’ed, M., & A., S.S. (2021). The moderation effect of gender on accepting electronic payment technology: A study on United Arab Emirates consumers. Review of International Business and Strategy.
Crossref, GoogleScholar, Indexed at
Received: 08-Jan-2021, Manuscript No. ASMJ-22-10810; Editor assigned: 10- Jan -2021, PreQC No. ASMJ-22-10810 (PQ); Reviewed: 23- Jan -2021, QC No. ASMJ-22-10810; Revised: 29-Jan-2021, Manuscript No. ASMJ-22-10810 (R); Published: 08-Feb-2022.
