Research Article: 2022 Vol: 26 Issue: 1
Optimization of honey value added model using dynamic systems approach (Case study: pt. Kembang joyo sriwijaya)
Dewi Masyithoh, University of Islam Malang
Budi Hartono, Brawijaya University
Lilik Eka Radiati, Brawijaya University
Suyadi, Brawijaya University
Citation Information: Masyithoh D., Hartono B., Radiati L. E., Suyadi. (2022). Optimization of honey value added model using dynamic systems approach (Case study: pt. Kembang joyo sriwijaya). International Journal of Entrepreneurship, 26(1), 1-13.
Abstract
The research objective is to optimize the model to increase added value and cost efficiency of honey production at PT. Kembang Joyo Sriwijaya. The research was conducted at PT. Kembang Joyo Sriwijaya on October 2020 - February 2021. The research method used a survey with a quantitative approach. Data analysis used a dynamic system model with vensim P.82.1 software. The results showed that an increase did not follow a significant increase in profit in the added value obtained by the three honeymooners of PT. Kembang Joyo Sriwijaya. Labour efficiency can increase significant profits and increase the production capacity of 10% honey has not provided significant company income.
Keywords
Honey, Value Added, Model, Dynamic System
Introduction
PT. Kembang Joyo Sriwijaya is a company engaged in the honey agro-industry. The agro-industrial activities of PT. Kembang Joyo Sriwijaya sells various kinds of honey products, the most sold honey products are SI honey, Ipomoea honey, and NTT honey. SI honey has a high selling price compared to other honey of 222,500 IDR/kg, while the cost of ipomoea honey is 188,000 IDR/kg, and the price of NTT honey is 145,000 IDR/kg. The difference in honey prices is influenced by honey raw materials, processing methods, and product quality (Jain et al., 2020). In addition, production costs also cause differences in the selling price (Fan et al., 2020). The difference in the price of each honey product provides different advantages and added value to the company (Yukesh Kannah et al., 2020). Added value is an added value of a product because the product undergoes processing, product transfer, and storage (Nurhayati, 2016).
The added value of the product obtained by the company is influenced by the profits and production costs incurred (Saputra et al., 2019). The higher the added value of the product, the higher the benefits. On the other hand, if the profit is high, it does not mean that the product's added value is also higher. This also depends on the production costs incurred by the company (Dalal et al., 2019). The amount of added value for the honey products of PT. Kembang Joyo Sriwijaya is currently unknown, so the contribution of added value per product is not identified. The calculation of added value is helpful for companies to find out how effective the product's performance is in generating profits (Long & Mohan, 2021). In addition, the calculation of added value can be used to describe how efficient the production cost per product must be (Ma et al., 2021). Increasing the added value of these products can be done through efficiency in production costs and maximizing profits. Therefore, in terms of efficiency and profit maximization, value- added modeling simulations can be carried out. We are modeling the added value of honey products at PT. Kembang Joyo Sriwijaya can be done using a dynamic systems approach. Modeling is a technique to help simplify a system from a more complex system, where the modeling results are also called models (Wicaksono, 2016).
A dynamic system is a system that changes according to time, intending to explain a phenomenon that occurs and provide feedback on information affecting the behaviour of the system (Wu et al., 2021). The dynamic system in this study was used to model the added value of SI honey, Ipaa honey, and NTT honey. Dynamic systems can also be used to find the efficiency of production costs and profit maximization through modeling simulations (Kaliush et al., 2021). In addition, this dynamic system can also forecast the modelled factors. This research aims to optimize the model to increase the added value and cost efficiency of honey production at PT. Kembang Joyo Sriwijaya.
Literature Review
Value Added
The concept of added value in business is part of the supply chain because the activities carried out in adding product value to date are also carried out by supply chains in downstream companies(Parajuli et al., 2019). The addition of value to agricultural products by exemplifying someone who buys raw materials and then that person produces an item and sells the item at a higher price (Vaz et al., 2016). Calculation of added value at the industrial level, according to him there are two types of added value, namely gross value added and net value added (Saputra et al., 2019). Gross value added is the value of output minus the value of intermediate consumption produced by goods and services, while net value-added is the value of output minus the intermediate value and consumption of fixed capital.
Increasing added value in primary products of agricultural commodities is one step in order to increase farmers' income, especially in rural areas (Parajuli et al., 2019). Added value to a commodity will undergo several processes including processing, transportation or storage in production. Value-added processing as the difference between the value of the product and the value of the cost of raw materials and other inputs, excluding labour. While the margin in value added is the difference between the value of the product and the price of the raw materials. Margin will include several components in the production factors that will be used such as labour, other inputs and remuneration for processing entrepreneurs (Ruauw, 2012). Furthermore, increasing the added value of primary products of agricultural commodities is one of the steps to increase farmers' income, especially in rural areas. According to Marimin and Maghfiroh (2013), the concept of added value is a change in value that occurs due to the treatment of an input in a production process. The flow of increasing value-added agricultural commodities occurs in every supply chain from upstream to downstream, starting from farmers and ending with final consumers. The added value of each member of the supply chain varies depending on the input and treatment by each member of the supply chain. The added value of agricultural commodities in the upstream sector can be done by providing quality and sustainable raw materials involving actors including farmers, providers of agricultural facilities and infrastructure, and technology providers. Quantitative added value is calculated from increasing productivity, while qualitative added value is added value from increasing job opportunities, knowledge, and human resource skills.
System Dynamic Model Approach
Modelling is a technique to help simplify a system from a more complex system, where the results of the modelling are also known as models. The model is defined as a representation or abstraction of an object or actual situation (Márquez, 2020). The model shows direct and indirect relationships as well as reciprocal relationships or can be termed a cause-and-effect relationship. Because a model is an abstraction of reality, it is less complex than reality itself. The model can be said to be complete if it can represent various aspects of the reality being tested. The system is a business unit consisting of parts that are related to each other trying to achieve a goal in a complex environment. When viewed from the input components, processes and outputs of a system can be divided into three categories, believe the analysis system, design system and control system. The systems approach is an organizational analysis approach that uses the characteristics of the system as a starting point for the analysis (Morcillo et al., 2018).
System dynamics is a problem analysis method that involves time as an important factor. This method studies the extent to which a system can be maintained or benefit from shocks from the outside world that hit the system. System dynamics relate to the behaviour of a system that changes over time intending to explain and understand how feedback information affects the behaviour of the system, and designing the structure of information feedback and appropriate control policies through simulation and optimization of the system using qualitative and quantitative models (Liu et al., 2020).
System dynamics is focused on determining policies and how these policies determine the behaviour of problems that can be modelled using dynamic systems. Problems from dynamic systems are not caused by external influences but are caused by the internal structure of the system. The purpose of the system dynamics methodology based on the causal philosophy (cause and effect) is to gain a deep understanding of the workings of a system (Buzhdygan et al., 2012).
System dynamic modelling assumes that the behaviour of the system is mainly determined by the feedback mechanism. Therefore, after defining the system boundaries (which are distinguished between internal and external variables), descriptive feedback loops are the next step in dynamic system modelling. There are five elements used in describing a dynamic system; two elements are the building blocks of feedback loops: the level variable and the flow variable. The others are complementary variables in the form of parameters, exogenous variables and intermediate variables (Mordjaoui et al., 2017).
Dynamic System Model Using Vensim Software
The stages of the dynamic system modeling process using vensim are as follows (Honti et al., 2019):
1. Problem Identification and Definition 2. System Conceptualization 3. Model Formulation 4. Simulation and Validation 5. Policy Analysis and Improvement 6. Policy Implementation
Making a dynamic system model using the Vensim software, there are symbols, and variables that are interconnected. The following is a dynamic system symbol in the vensim software (Márquez, 2020):
a. Stock/Level
Stock (Level) and Flow (Rate), in representing activity in a feedback loop, two types of variables are used, known as stock (level) and flow (rate) (Shiddekh & Suryani, 2018). The level represents the state of the system at any time. Level is an accumulation in the system. The equation of a rate variable is a policy structure that explains why and how a decision is made based on the information available in the system. The stock/level symbol on the Vensim software can be seen in Figure 1.
b. Rate/Flow
Rate is the only variable in the model that can affect the level. The symbol rate on the vensim software can be seen in Figure 2.
c. Arrow
Arrow is a connecting symbol between variable and level, or variable with variable. Arrow is described as an arrow in the vensim software. The arrow symbol can be seen in Figure 3.
Materials and Methods
This research was conducted at PT. Kembang Joyo Sriwijaya on October 2020 - February 2021. The research method is a survey method. While the sample of this study was 47 people/outlets owned by PT. KembangJoyo Sriwijaya. Data analysis uses a dynamic system model with vensim P.82.1 software. The stages of making analysis and simulation of dynamic models in this study refer to opinions (Purnomo, 2012; Tifani et al., 2015) with the following steps:
a. Causal Loop Diagram (CLD) Modeling b. Model Formulation c. Model Testing d. Scenario Arrangement and Analysis
Results
Causal Loop Diagram
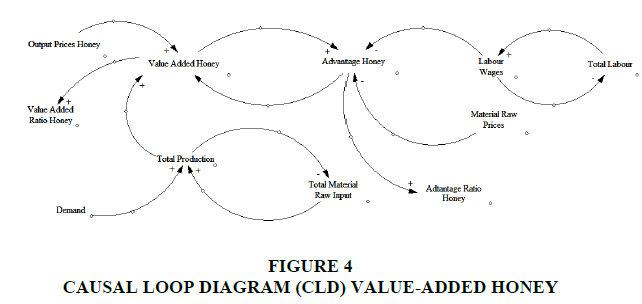
The added value system in the honey supply chain of PT. Kembang Joyo Sriwijaya consists of three types of honey which have different characteristics. Three types of honey owned by Pt. The flowers of Joyo Sriwijaya are SI honey, Ipomoea honey and NTT honey. A dynamic system is used to describe the added value obtained from each of the honey products. The causal loop diagram of added value provides a model that describes the causal relationship of the added value of SI honey, Ipomoea honey and NTT honey. Causal loop diagram of the added value of the honey supply chain at PT. Kembang Joyo Sriwijaya can be seen in Figure 4.
Causal Loop the supply chain value-added diagram consists of the amount of honey production, the raw material input for honey, honey profit, labour costs, raw material prices, and the number of workers of PT. Kembang Joyo Sriwijaya. Causal Loop Diagram is a qualitative tool used to map the causal relationship (cause-effect) between variables in a value-added system of the honey supply chain (Wu et al., 2021). The variable relationship in the causal loop diagram can be in the form of a positive or negative relationship expressed by the + and - symbols at the end of the hot child, and the causal relationship is formed (Barsuk & Paladi, 2021). Suppose changes in a variable affect other variables with the same direction of change. In that case, the nature of causality is + and if one variable affects other variables with the guidance of change in the opposite direction, the nature of the causality relationship - (Effendi et al., 2017).
Added value is the value created from changing the input with various treatments to increase the resulting output value, which includes changing the shape, time, and place (Sorga et al, 2014). The added value in terms of output is reduced by some part of the input in raw materials, semi-finished materials and finished goods that enter the production process plus all supplies and purchases of services from other companies (Kadariah, 2011). Non-technical factors can affect conversion factors and production costs, including the selling price of output, work wages, raw material prices, information, and so on (Mutmaini, 2015). Based on the causal loop diagram in Figure 1, the added value of honey from PT. Kembang Joyo Sriwijaya is influenced by the amount of honey produced, the price of honey raw materials, and other production costs. The higher the output had and the lower the price of raw materials and production costs, the added value of Pt. Joyo Sriwijaya's flower will be even higher. The value-added relationship with the profit of Pt. Kembang Joyo Sriwijaya is directly proportional, which means that the greater the added value obtained, the greater the benefits.
Model Formulation
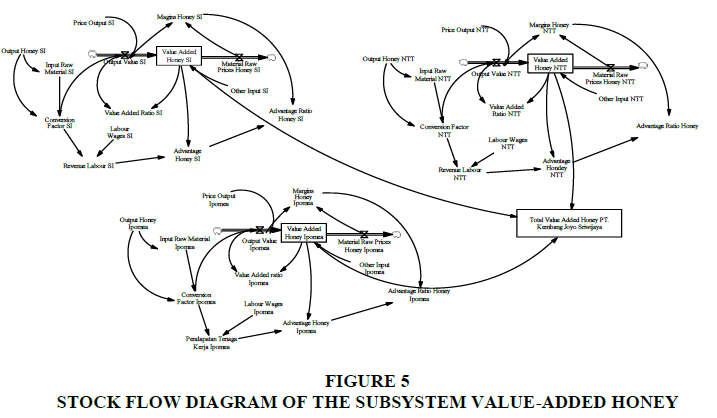
Causal loop diagram (CLD), the next stage in the development of a dynamic system model for the added value of the honey supply chain, is to formulate the model. The model formulation is done by converting it into mathematical construction based on logical logic as shown by subsystem diagrams, causal diagrams and stock-flow diagrams, which are then performed computer simulations using Vemsim software. Stock flow diagrams aim to represent a natural system in the form of a simulation model whose main elements consist of level, rate, and auxiliary variables (Barsuk & Paladi, 2021). The following sections describe the mathematical equations and the values of the critical parameters contained in the model. Meanwhile, stock-flow diagrams and equations for the value-added model of the honey supply chain at PT. Kembang Joyo Sriwijaya Can are seen in Figure 5.
Simulation Results
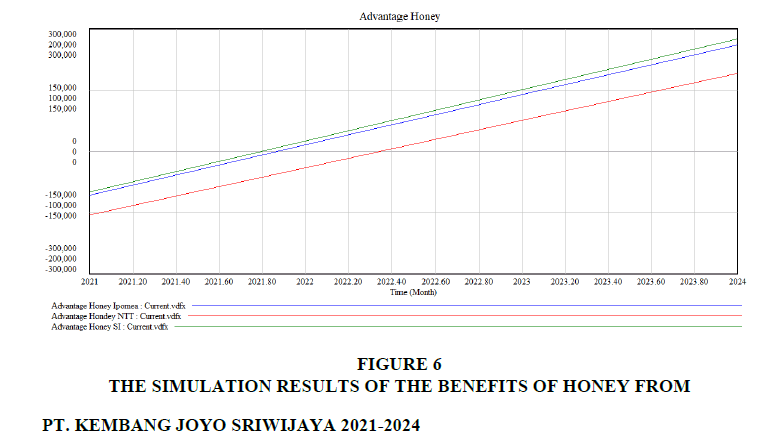
The value-added model in the honey supply chain ofPT. Kembang Joyo Sriwijaya for the next three years is analyzed in several scenarios according to the possible conditions and situations that may occur during that time. The scenario selection is adjusted to the relevant stakeholder targets that affect the system during the simulation period. The simulation of each scenario shows different results. There are three outputs that are simulated, namely the simulation of the benefits of each honey, the simulation of added value, and the total added value obtained by PT. Kembang Joyo Sriwijaya. The scenarios are simulated in the next three years, from 2021 to 2024 can see in Figure 6.
Based on the profit scenario simulation, Figure 3 shows that the profit of PT. Kembang Joyo Sriwijaya from the three honeys from 2021 to 2024 has increased profits every year. SI honey has the highest profit, ipomoea honey has the second-highest profit, and NTT honey has the lowest profit. The difference in profit occurs due to the higher selling price of SI honey compared to other honey. The selling price, production costs influence the profit level of a product and the determination of the profit margin desired by the company (Fitranto et al., 2020). Labour costs and production costs to produce the three honey are the same, namely 108,617 IDR/kg. The profit rate for each honey from PT. Kembang Joyo Sriwijaya has a significant relationship to the added value obtained. The calculation of the added value obtained by each honey product is simulated in the next four years, starting from 2021 to 2024.
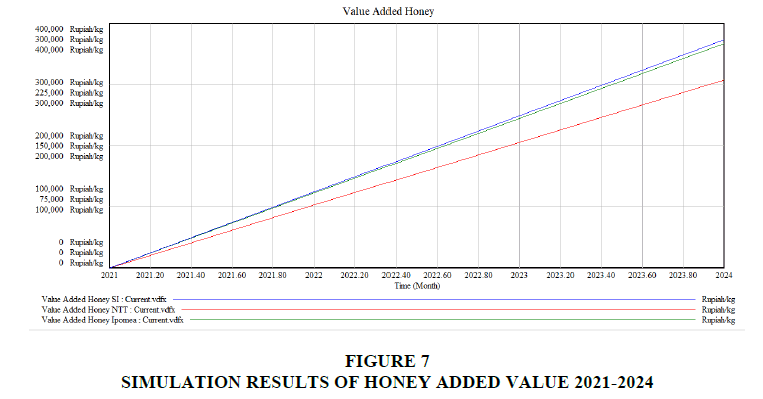
Figure 4 shows that the highest added value is produced by SI honey, then ipomoea honey, and finally, the lowest added value is created by NTT honey. The trend of added value changes every year has a consistent increase. An increase influences the increase in added value in product prices and decreased production costs (Kralj, 2021). In the value-added scenario, each year, the selling price of honey increases and the production cost also increases. However, the high selling price compared to the production cost makes the added value of honey at PT KJS increase consistently. The simulation results of honey added value at PT KJS can be seen in Figure 7.
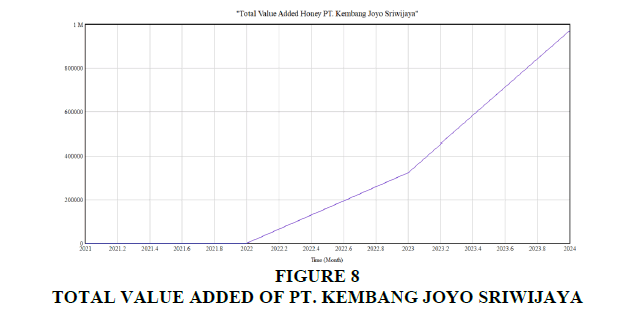
The total added value obtained from all Pt. Kembang Joyo Sriwijaya can be seen in Figure 8. The total added value of PT. Kembang Joyo Sriwijaya is calculated from 2021 to 2024. The simulation results show that from 2021 to 2022, the added value of PT. Kembang Joyo Sriwijaya has neither increased nor decreased. Then from 2022 to 2023, the total added value obtained by PT. Kembang Joyo Sriwijaya has increased but not significantly. A significant increase in real value-added will occur from 2023 to 2024. This is because in 2023, the profits obtained by PT. Kembang Joyo Sriwijaya also increased significantly, causing the added value brought by PT. Joyo Sriwijaya flower also increased. The added value of honey at PT. Kembang Joyo Sriwijaya is directly influenced by honey production and the profit from selling honey per product.
Simulation of the dynamic value-added system of the honey supply chain at PT. Kembang Joyo Sriwijaya in this study is simulated into 5 types of simulations, namely:
1. Simulation of an increase in the production of 10% SI Honey
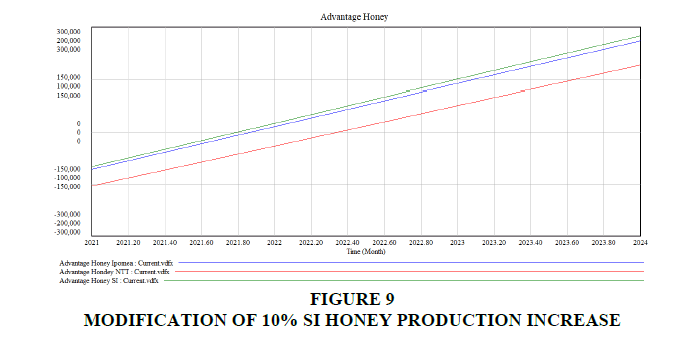
10% increase in SI honey production capacity at PT. Kembang Joyo Sriwijaya causes an increase in profits from SI honey, but its nature is not significant. Comparison of the advantages of the three honeys at PT. Kembang Joyo Sriwijaya, after modification, an increase of 10% in SI honey production can be seen in Figure 9. When compared with the figure before modification, there is no difference in the three graphs. This is due to the slight increase in increased production not to provide a significant change in profits.
2. Simulation of 10% increase in Ipomoea Honey Production
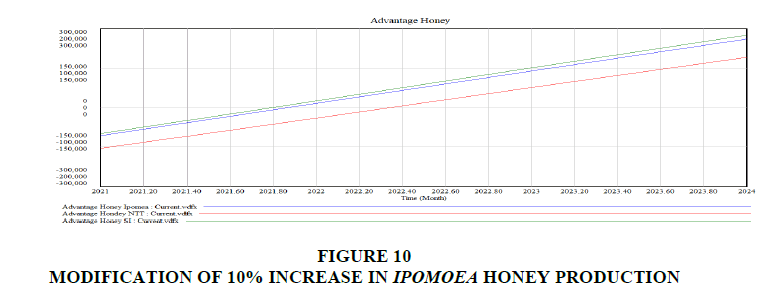
Modification of increasing production of 10% ipomoea honey did not lead to a significant increase in profits. This is because the modification of the 10% increase is deemed not providing a large income to PT. KJ from ipomoea honey sales. A large increase in production capacity will also cause a significant increase in revenue so that when payment is large, and production costs are fixed, it will increase company profits (Colledani & Battaïa, 2016). The results of the modification of the increase in the production of 10% ipomoea honey can be seen in Figure 10.
3. Simulation of 10% NTT Honey Production Increase
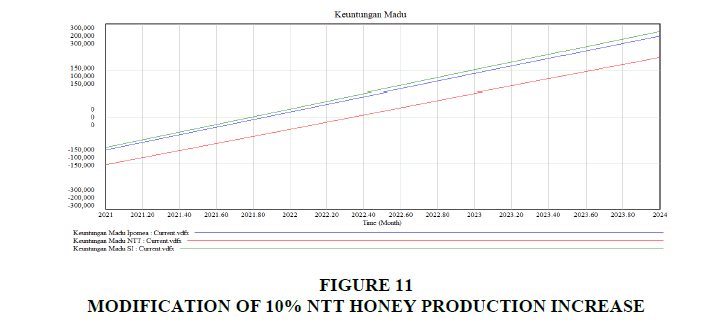
The third modification was made to increase the production of 10% honey in NTT. The 10% increase in NTT honey production from only 5856 to 6088 did not because significant changes in NTT honey profits. Likewise, SI and Ipomoea honey, the increase in production capacity of 10% of NTT honey, is deemed unable to provide large company income. The benefits obtained by Ipomoea honey also do not have a significant impact. This is reflected in the graph of the simulation results of the increase in honey production capacity in NTT in Figure 11.
4. Simulation of Ipomoea Honey Workforce Efficiency
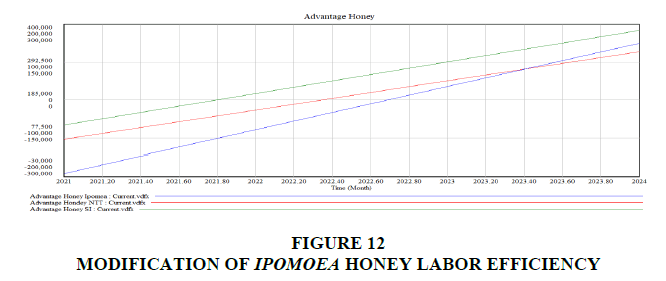
The fourth simulation is a modification in the labour efficiency of ipomoea honey. Labour efficiency by reducing the cost of labour wages which were originally 108,617 IDR to 21,723 IDR. The simulation results show that the benefits of ipomoea honey have increased significantly. When compared with before modification and modification of production 10%. The efficiency of this workforce greatly affects the increase in profits of PT. Kembang Joyo Sriwijaya because it can reduce the cost of producing ipomoea honey. The results of the labor efficiency simulation of ipomoea honey can be seen in Figure 12.
5. Efficiency Simulation of NTT Honey Workers
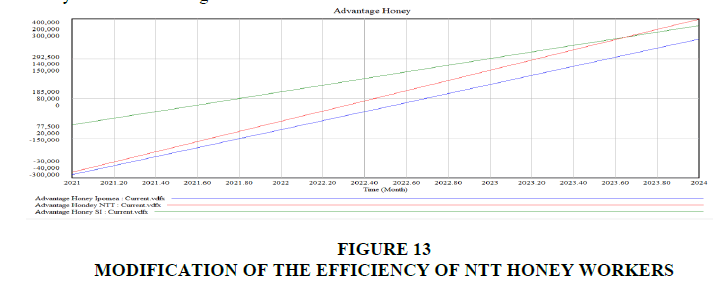
The fifth simulation that was conducted was the efficiency of the NTT honey workforce. The simulation results show that the benefits obtained by NTT honey have increased significantly. The benefits of NTT honey exceed the benefits obtained from SI honey. This condition occurs from 2023 to 2023. The existence of labour efficiency reduces the cost of honey production in NTT, and an increase in production capacity of 10% also increases the income from honey in NTT. So that the two modification conditions provide a significant change in profits to PT. Kembang Joyo Sriwijaya. More clearly, the modified labour efficiency of NTT honey can be seen in Figure 13.
6. Simulation of Value Added Honey PT. KembangJoyo Sriwijaya
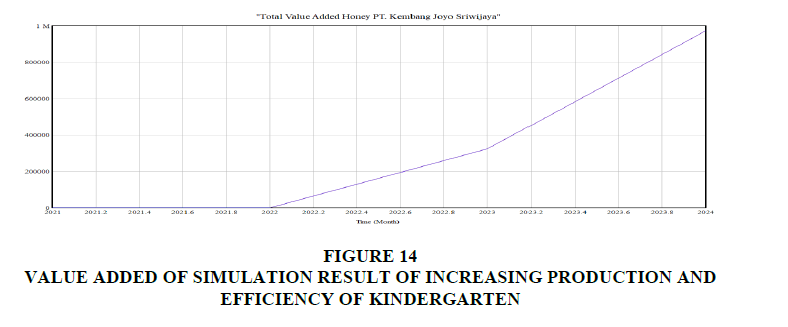
Based on the simulation results, there is a change in added value after modifying the 10% increase in production and labour efficiency. The simulation results of the total added value obtained can be seen in Figure 14. Compared with the real added value before modification, there is a difference, namely a significant increase in added value in 2023. In 2023 there is a decrease in production costs, which causes an increase in added value, on honey at PT. Kembang Joyo Sriwijaya.
Conclusions
Labour efficiency will increase significant profits and increase the production capacity of 10% honey has not provided a considerable company income. The benefits obtained by honey also do not have a considerable impact.
References
Dalal, N., raj, N., & Bisht, V. (2019). Value Added Products from Ber. International Journal of Current Microbiology and Applied Sciences, 8(01), 1603–1615.
Effendi, U., Astuti, R., & Candra Melati, D. (2017). Development Strategies of Chocolate Business Using Quantitative Strategic Planning Matrix (QSPM) and Multi Attribute Utility Theory (MAUT) at “Kampung Coklat”, Blitar. Industria: Jurnal Teknologi Dan Manajemen Agroindustri, 6(1), 31–40.
Marimin dan Magfiroh. 2013. Teknik dan analisis pengambilan keputusan fuzzy. Dalam: Manajemen Rantai Pasok. Bogor: IPB Press
Márquez, C. (2020). Integrating artificial intelligent techniques and continuous time simulation modelling. Practical predictive analytics for energy efficiency and failure detection. Computers in Industry, 115, 103164.
Nurhayati. (2016). Kinerja rantai pasok dan nilai tambah dengan internalisasi aspek lingkungan pada agroindustri ayam ras pedaging.
Wicaksono, B.A.R.I. (2016). Fixed Time Period Modelling For Inventory Control System In PT X Regional Warehouse Declaration Of Originality. Bogor Agricultural University Bogor.
Yukesh Kannah, R., Merrylin, J., Poornima Devi, T., Kavitha, S., Sivashanmugam, P., Kumar, G., & Rajesh Banu, J. (2020). Food waste valorization: Biofuels and value added product recovery. Bioresource Technology Reports, 11, 100524.
