Research Article: 2025 Vol: 29 Issue: 2S
Modeling the Dynamic Decision of a Contractual Adoption of a Continuous Innovation in B2B Markets
Yingge Qu, University of North Alabama, Florence
Kumar V, St. John's University
Yi Zhao, Georgia State University, Atlanta
Citation Information: Qu, Y., Kumar, V., & Zhao, Y. (2025). Modeling the dynamic decision of a contractual adoption of a continuous innovation in b2b markets. Academy of Marketing Studies Journal, 29(S2), 1-29.
Keywords
Continuous Innovation, B2B Hi-Tech Service Markets, Dynamic Programming, Bellman Equation, Learning Process, Structural Model.
Summary Statement of Contribution
This study develops a dynamic structural model that jointly examines customers' adoption and contract length decisions in high-tech markets. By integrating a customer’s forward-looking behavior and the effects of technology evolution, we provide insights into how firms can tailor their innovation strategies. Our findings suggest that continuous updates drive market penetration, while substantial updates enhance profitability, contributing to both marketing theory and practice in B2B contexts.
Introduction
We are currently in an era of rapid innovation which significantly affecting daily life and the global business landscape. In this competitive environment, organizations find it increasingly difficult to thrive or survive without integrating the latest technologies into their operations. This relentless pace of innovation places a growing burden on IT departments, forcing companies to allocate more resources to maintain and advance their technological capabilities.
In response to these challenges, leading firms have begun offering high-tech services like cloud computing to their B2B clients, allowing businesses to redirect resources traditionally spent on internal IT departments to cloud providers that offer specialized expertise, flexible services, and enable cost savings. Today, 94% of all worldwide companies have embraced theses services across various sectors with the global market projected to reach $1 trillion by 2027 (Precedence Research, 2024). As demand for high-tech cloud services grows, many organizations remain concerned about security, privacy, and data integrity (Abadi, 2009; Sadavarte et al., 2020). Addressing these requires ongoing technological innovation to enhance processing speed, data storage, and security measures, such as more secure data centers and improved encryption protocols. We define this iterative improvement as "continuous innovation" or "sustaining technology improvement."
The success of continuous innovation services hinges on customer adoption decisions. From a customer perspective, decision-making involves not only the choice to adopt but also determining the contract length, which requires balancing the desire for the latest technology with concerns about potential obsolescence. Customers must consider both immediate benefits and long-term implications, leading to a forward-looking approach to decision-making. Conversely, service providers aim to understand how technological advancements influence these decisions and how strategic planning can best support different business objectives. Given the unique and novel phenomena in the continuous innovation high-tech B2B service market, we highlight our research questions as below:
1. Modeling the customer’s dynamic decision process: How do customers make simultaneous decisions on adoption and contract length in a continuously innovating market? how to design a holistic model to consider multiple aspects in a customer’s decision process, such as a customer’s forward-looking behavior, influences of technology evolution and the balance between benefit and cost in a customer’s decisions?
2. Evaluating the impact of technology evolution: How does technological progress, including the rate and quality of advancements, affect customer decisions?
3. Strategic communication of technological improvements: how should a firm strategically communicate their technology innovation to its customers? Should firms release updates incrementally or in larger batches to maximize customer engagement and value perception?
4. Appraising customer decision-making effort: In the B2B market, decision-making often requires substantial effort. How can firms optimize these efforts to enhance customer decisions?
In order to answer these questions, we propose a dynamic structural model that jointly models a customer’s dual decision: the discrete choice of whether to buy and the continuous decision of for how long to buy, e.g., the contract length. Our research builds upon our previous work (Qu et al., 2023) by structuring the model of customer contractual decisions with forward-looking behavior in marketing. Notably, we enhance this framework by incorporating outside resources to capture technology innovation and integrating consumer learning, addressing critical aspects previously overlooked. We highlight our methodological contributions as follows: we model a customer’s contract length decision by integrating it into the dynamic programming process through a structural modeling approach. Specifically, the contract length involves the determination of the customer’s transition states in the value function in the dynamic programming approach. Moreover, our modeling approach can automatically capture the contract lock-in effect, e.g., once the customer signs the contract, they are bonded with the technology level at the decision occasion; therefore, the customers cannot capitalize on the technology update within the contract duration. Our model leverages three years of service contract data from a global high-tech company providing continuous innovation services, yielding actionable insights for decision-makers.
Our empirical findings reveal substantive implications to aid managerial decision making. Our findings show that while an increase in the overall technology level encourages adoption, higher speeds of technological improvement lead customers to prefer shorter contract durations. Policy simulations further suggest that providers should tailor their innovation strategies based on their business goals. For market penetration, continuous updates are recommended, whereas for profitability, fewer but more substantial updates may be more effective. While our research focuses on B2B high-tech markets, the framework can be extended to other sectors where contractual decisions involve forward-looking considerations, including warranty services, post-purchase support, and telecommunications.
The remainder of this article is structured as follows: we first review relevant literature on structural modeling of forward-looking customer decisions and technology evolution. We then describe the data and institutional context that inform our model setup, followed by detailed methodology and results. Finally, we conclude with contributions and directions for future research.
Literature Review
Our study focus is modeling a customer’s contractual decision in a continuous innovation high-tech B2B service market, and our modeling approach fundamentally inherits from the research stream of modeling the customer’s dynamic decision process with a forward-looking behavior. Therefore, we will review the literature in the areas of both forward-looking structural model and technology innovation. Specifically, we will address three aspects when reviewing forward-looking structural models: 1) Types of decisions; 2) triggers of forward-looking behavior, and 3) model application contexts.
Types of Decisions
A large number of forward-looking studies focus on modeling the discrete choices, e.g., whether the customer will buy or not buy a product (Sriram et al., 2010). Recently, researchers introduce a customer’s continuous decision into the forward-looking structural model, such as a subscription plan for grocery store (Goettler et al., 2011), mobile phone usage (Yao et al., 2012) and bank account consumption. In the existing literature, the continuous decision is usually considered as a covariate or control variable in the utility function. An effective method to structurally model the continuous decision by integrating it into the dynamic programming approach is still lacking.
Triggers of Forward-Looking Behavior
Monetary factors, such as price (Song et al., 2003) and promotion (Gönül et al., 1996), are frequently considered as the trigger of a customer’s forward-looking behavior. However, more recent studies show that a customer’s forward-looking behavior is not necessarily the “patent” of price or cost of the product. For example, (Ryan et al., 2012) brings in the idea that the network evolution can play an important role in determining the customer’s dynamic decision process. Gordon addressed that, in product replacement (e.g., PC processor) purchases, a customer’s dynamic decision process can be triggered by the obsolescence status of the product due to both the quality elevation and price reduction. Lewis claimed that the loyalty program can also incite a customer’s forward-looking behavior. Yang and Ching identify the impact of a customer’s age on their forward-looking zones. There is no doubt that the technology improvement should also be considered as a trigger of a customer’s forward-looking behavior. However, few studies focus on investigating how the technology improvement will influence a customer’s dynamic decision through a structural modeling approach.
Model Application Contexts
Forward-looking structural models have been applied in a variety of marketing contexts, including Consumer Packaged Goods (Erdem et al., 1996), durable goods, PC processor industry (Gordon, 2009), online grocery and drug items (Lewis, 2004), ATM card (Yang & Cheng, 2014), sales-force compensation plan (Chung et al., 2014), content contribution on social media (Tang et al., 2012), bank account (Liu et al., 2014) and mobile phone usage (Xu et al., 2015) etc. However, few studies pay attention to the B2B high-tech service market. The possible reasons could be both the complexity of a customer’s decision process and the difficulty of obtaining quality data in the B2B context.
It is worth mentioning that, in the domain of a forward-looking structural model, Erdem and Keane’s study has the most similar modeling structure to ours. Both models consider forward-looking and a customer’s learning in order to structurally model a customer’s dynamic decision process. However, because of the unique features in our B2B context, our study is different from Erdem and Keane’s study. First, in our context, customers need to simultaneously decide on whether to buy and for how long to buy. Therefore, the decision variables in the dynamic process include both discrete choice and continuous decision (e.g., contract length). Second, because of the technology improvement, customers make decisions in a turbulent market and will form beliefs on the speed of the technology improvement according to the technology improvement related official news released by the service provider. Specifically, we will investigate the multi-dimensional effects of technology improvement on a customer’s dynamic decisions.
Technology Innovation
Since a focus of this research is to identify the influence of technology improvement on a customer’s decision process, our study also reviews the research stream of “technology innovation”. In the marketing literature, a large body of the “technology innovation” studies focus on improving the theories in technology innovation. For example, (Ettlie & Rubenstein, 1987) pointed out the necessity of differentiation between radical and incremental technology when investigating the relationship between firm size and successfulness of innovation. (Chandy et al., 1998) found that, given the possibility of cannibalization, today’s high-tech firms, especially large firms, are still willing to invest on radical innovation. Although technological innovation brings remarkable growth to the firms (Sood et al., 2005), the actual performance of an innovation is tied to many factors, such as the firm’s strategic orientation resource base creative idea in the innovation (Im and Workman, 2004), etc. Another group of studies aim at discovering the pattern of technology improvement. Exponential shape (Moore, 2003; Walter, 2005), S-curve (Foster, 1986), Bass diffusion model (Bass, 1969; Young, 1993), SAW shape (Sood et al., 2012) and step function etc. have been proposed in the existing literature to simulate the technology improvement. Although some researchers evaluate the influences of innovation from a firm’s perspective, such as the relationship between innovation and the firm’s financial reward (Sorescu et al., 2003) or performance (Zhou et.al, 2005), etc., few studies consider the effects of technology innovation, especially the continuous innovation, from a customer’s perspective, e.g., how the continuous technology innovation plays a role in a customer’s decision process.
In sum, there is no study aiming at utilizing a structural modeling approach to evaluate the impact of technology improvement on a customer’s contract decision in the B2B high-tech service market. Our proposed study fills the following research gaps: 1) we provide a structural way to model a customer’s continuous decision by integrating the contract length decision into the dynamic programming approach; 2) we identify the multi-dimensional effects of continuous innovation (technology level and technology speed of updates) on a customer’s dynamic decision process; and 3) we extend the forward-looking structural model into the B2B high-tech service market.
Empirical Context
Our data comes from a leading global high-tech company (service provider). Its products include almost all kinds of high-tech products and infrastructures, such as hardware, software, and personal computers, and covers both B2B and B2C settings. Around the second half of the previous decade, they began to offer a cloud service for their B2B customers. Managers are interested in understanding how their business customers decide on adopting the cloud service and what would be a good strategy to manage the technology improvement. There are distinct characteristics in our study context which make our research unique and guide our modeling approach.
1. The price of the service has no demonstrable variation in the long-term, but firms can offer random promotion, such as occasional price discount or additional services to the customers: Due to confidentiality, we are not revealing the price of the service in our data. But from observations of the data and discussions with the managers in this firm, e.g., the unit price of the service is almost constant but the technology keeps on updating. Therefore, in our study context, technology improvement, instead of monetary factors (such as price, cost, fees etc.) is the primary trigger of a customer’s forward-looking behavior. To effectively evaluate how the technology improvement will influence a customer’s decision process, we integrate both the technology improvement and the contract length decision into the dynamic programming
2. For each step of technology update, the firm releases relevant news to announce the update to the customers: This suggests that, in our context, the quantity of the officially released news is related to the degree of technology improvement. Thus, we can observe the current technology update by collecting and reviewing the official news. We obtain how many news are released, but we have no information to quantify the relative importance of the technology update captured by the individual news. As per the industry norms, on average, the more news released, the faster the technology improvement is.
3. The business customer’s purchasing decision is not an easy process but associated with a remarkable one-time effort: The one-time effort can include learning the technology, training employees, cooperation with multiple internal departments, negotiating with service providers and sending a budget application to the top manager for approval, etc. This one-time effort is associated with each contract. Each time the business customers decide to sign the contract, they will have to put forth such effort. However, once the decision is made and the contract is signed, within the contract length, there is no additional effort required. This effort, from a modeling perspective, will influence a customer’s decision but is latent to the researchers. Obviously, if the customers have already spent greater energy and resources to finalize a contract, they will intend to sign a relatively longer contract to avoid another input. Therefore, an effective modeling approach should also consider the latent one-time effort.
4. Once the customers sign a contract, they are bonded with the on-site technology level at the decision occasion – we define it as a “lock-in” effect in our context: In principle, the customers can’t break the contract. In B2B contexts, it is rare that the customers would break a contract as signing a contract is associated with remarkable effort from both the firm and customer sides. In our data, we do not observe any customers breaking their contract. Once the customers sign the contract, within the contract duration, service is provided based on the technology level at the decision occasion. Consequently, customers are not able to enjoy the technology update within the duration of the contract. Our model automatically considers the lock-in effect in our dynamic programming approach.
5. The cloud service is a “brand-new” offer in the industry: The high-tech firm is one of the pioneers of the cloud service in the industry. During our data collection period, both the firm and the business customers have little experience with making strategic decisions. From a customer’s perspective, his/her knowledge about the cloud service is obviously unclear. When the service was just publicized, customers possessed little knowledge about it; as time elapses and more information is released, customers accumulate knowledge about the service through the process of learning. From the firm’s perspective, it provides the service and hence does not have a strategic way to announce the technology-related news to the customers. Therefore, in our study context, we do not encounter endogeneity issues.
Data Description
Our data includes 218 business customers. All of them have had at least one historical purchase with the service provider before purchasing the new service. This characteristic suggests that the 218 buyers should consider the service provider in our study as the first choice over other competitors when adopting the high-tech service, not only because the service provider holds the superior power in the market, but also because the buyers are existing business customers who retain better knowledge about the service provider, and a relationship with the service provider.
Our data includes both the service transaction and the technology-related news. As we stated previously, the service provider releases news corresponding to each step of the technology update. We researched all of the news (more than 500) on service provider’s official website. Each step of service-related technology update is reflected on the news platform although not all of the news we researched are related. If the news is related to the technology update, there always are clear statements in the news content, such as building new data center, new cloud-based software, technology breakthroughs, adding new computing capabilities etc. Therefore, the process of identifying the technology-related news is manageable. Finally, with the help from the professionals in the firm, we collected 154 relevant news. The time frame of technology-related news ranges from October 2008 to December 2011 and the data were recorded as the number of technology-related news per month. And the time frame of service transaction data ranges from January 2009 to September 2011 and the data includes both the customer purchase decision time (year & month) and the decision of the contract length (in unit of months). Both transaction and news data were available at the monthly level.
We present both a graphical illustration (Figure 1) and summary statistics of a customer’s contract length decision and officially released news-counts (Table 1). On average, customers purchase the service for 18 months, which is about one and a half years, but the range can be from 1 month to 60 months, e.g., 5 years (Table 1). Additionally, the average number of official news-counts that the service provider released every month is 3.95, with the minimum of 1 and maximum of 11 (Table 1). Moreover, the patterns of the contract length and the news-counts (Figure 1) suggest that, in general when the news-count is high, the contract length tends to be low. Recall that news-count is used to capture the improvement of technology. We previously mentioned that when customers consider the tech improvement to be fast, they may either postpone their adoption decision or sign a shorter contract; our data pattern shows this concept to be empirically true.

Figure 1 Graphical Illustration of the Monthly basis Contract Length and News-Count Per Month
| Table 1 Distribution of News-Count and the Customers’ Contract Length Decisions | |||||
| mean | std | median | min | max | |
| News_count | 3.95 | 2.42 | 3 | 1 | 11 |
| Contract Length | 18.05 | 19.42 | 12 | 1 | 60 |
Modeling Framework
Given the empirical setting and the research objectives in our study, we aim at building a holistic structural model to account for the following aspects in a consumer’s decision process. First, customers have to decide whether to adopt and for how long to adopt (contract length) at each decision occasion t. Therefore, we will simultaneously model both decisions of the customer. Second, because of the technology improvement, customers exhibit both forward-looking and learning behaviors in their decision processes. Customers will have to consider both current utility and discounted future utility to make an optimal current purchase decision. We will employ a dynamic programming approach to account for customers’ forward looking behavior. Being in a turbulent environment, customers will have to continuously learn from the existing information related to the technology improvement in order to update their beliefs about the technology level. We will integrate this learning behavior in our model as well. Last, to better evaluate how the technology improvement influences a customer’s decision process, we define two states related to technology improvement: overall technology level and technology improvement pace. We assume that: the overall technology capability level will encourage buyers to purchase. Only if the technology level meets or exceeds a customer’s needs, the adoption decision will be invoked. The technology improvement pace will produce two effects: one is postponing customers’ adoption decision; the other is to encourage a short term contract. The intuition is that, if the customers consider the technology improvement to be very fast and expect a more advanced technology to appear in the near future, then, the customers may either hold their current adoption decision to wait for the future better offer, or at most try a service with a shorter contract. To test our modeling assumptions, we will separately quantify the effects of both technology improvement states on a customer’s decisions in our model.
In the conceptual framework (Figure 2), we first start with modeling a customer’s period utility. We build the customer’s period utility as a function of the overall technology level. Next, we show how we account for a customer’s forward-looking behavior and learning behavior in our model. Finally, we explain the process of integrating both a customer’s contract length decision and the two states of technology improvement into the dynamic programming approach. This process is the essence of our model setup that allows us to separately quantify the impacts of the two technology improvement states on a customer’s decision process.

Figure 2 Modeling Framework of Consumers’ Dynamic Adoption Decision Process
Timing
There are fundamentally two steps in customer’s decision process. First, they will need to learn about the technology improvement. Then, customers will make decisions on whether to buy and how long to buy. We illustrate the timing of our model follows: on each decision occasion (t)
1. Customers observe the official news released by the service provider
2. Customer update their belief about the technology improvement
3. Optimal contract length decision (CL): Customers make the contract length decision by maximizing the total discounted utility V: optimal CL = CL/max(V)
4. If the customer’s decision is “no purchase”, e.g., CL = 0, then we move to the next decision occasion (t+1) and the customer can make another decision.
5. If the customer’s decision is to “purchase a contract”, e.g., CL > 0, then within the contract duration, e.g. from to t + CL-1, customer is locked with the purchased contract and is temporarily not available for making decision. Starting from occasion t+CL, customers can make decision again.
Empirical Evidence from a Simple Reduced Form Model
In this section, we use Regression and Logit models to show the empirical evidence of the impact of technology improvement on a customer’s decision. Although both models are basic model approaches, it is widely acknowledged that they provide solid proof of the relationship between focal variables.
Based on the technology-related news, we are able to derive the overall technology level and the technology improvement pace at each decision occasion (t): we use the cumulative number of news to represent overall technology level and the number of news at prior occasion (t-1) to represent the technology improvement pace. Since we have both “whether to buy” and “for how long to buy” decisions, we have both the discrete choices for Logit model and the continuous decision for Regression model. The parameter estimates (Table 2) indicate that the overall technology level has a positive impact on both P (buy)t and CL(buy)t, while technology improvement pace has a negative impact on both P (buy)t and CL(buy)t. Except for the coefficient of technology improvement pace for P (buy)t, all the other coefficients are significant at 0.1 significance level. The results match with our prior expectation that, 1) the overall technology level determines the customer’s decision of whether to buy and therefore it should positively impact the customer’s purchase probability; 2) both overall technology level and the technology improvement pace influences the customer’s decision of how long to buy. If the technology improvement is fast, customers are more likely to sign a shorter contract. Therefore, the technology improvement speed negatively influences the contract length decision. In summary, the data pattern is consistent with our intuition and modeling assumption, and the empirical evidence from the simple model can help us recover our parameters.
| Table 2 OLS Parameter Estimation for Impacts of Technology Evolution on Customer’s Decision | ||||
| A: Purchase Probability P(buy) | ||||
| Coefficients | Standard Error | t Stat | P-value | |
| Intercept | -0.0039 | 0.1321 | -0.0293 | 0.9768 |
| overall tech level | 0.0025 | 0.0013 | 1.9908 | 0.0557 |
| tech update pace | -0.0133 | 0.0515 | -0.259 | 0.7974 |
| B: Contract Length CL(buy) | ||||
| Coefficients | Standard Error | t Stat | P-value | |
| Intercept | 2.68 | 1.009 | 2.657 | 0.013 |
| overall tech level | 0.024 | 0.01 | 2.467 | 0.02 |
| tech update pace | -0.669 | 0.393 | -1.701 | 0.099 |
Model Setup
Period Utility Function (ui)
We define the customer’s period utility as follows:
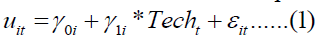
Where  represents the customer i-specific expected net-utility when the actual overall technology level equals zero. As we described earlier, the price of the service has no demonstrable variation in the long-term. In our model setup, we are not able to separately identify the effect of price and the customer’s intrinsic preference toward the technology. Therefore , indicates the difference between the baseline benefit from the cloud computing service and the period cost, e.g., price of the service.
  is the customer i-specific coefficient of the actual overall technology level. It captures the customer’s utility sensitivity of the overall technology level, e.g., the extent to which the change of overall technology level will impact customers’ period utility. Techt indicates the actual overall technology level at purchase occasion t.
  is the net-utility error for customer i at purchase time t. It captures all unobserved factors that influence the utility, such as the random promotion offered by the firm and the demand shock by the customers. We assume a normal distribution for the random component
 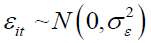 . And we fix the variance term at 1, e.g.
  for identification purpose. We represent the customer utility for the outside (or no adoption/purchase) option as
  e.g. set the corresponding period utility level to zero. Finally, to account for the customer heterogeneity, we assume that the
  will follow a normal distribution, e.g.
 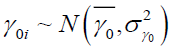 , and the
  will follow a log-normal distribution, e.g.
 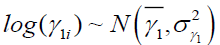 . Intuitively, customers should gain benefit from the technology improvement so that a positive number of makes more sense to describe the relationship between customers’ net utility and overall technology level. Therefore, we choose a log-normal distribution for .
Customer Learning about Technology Level (Techt)
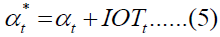
Considering that the current technology is updated based on the previous level, we assume the pattern of technology update as follow:
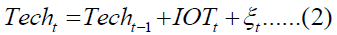
Where Techt is the actual overall technology level at current purchase occasion t; this is the same as the Techt in the period utility function in Equation 1. Techt-1 is the actual overall technology level at previous purchase occasion t-1. IOTt is defined as the “improvement of technology” at current purchase occasion t. In our context, once there is a service-related technology update, the service provider releases relevant news to announce the innovation to the customers. The number of news releases is correlated to the degree of innovation. Therefore, we use IOTt, which is the number of technology related official news released by the high-tech service provider at current purchase occasion t, to capture the improvement of technology. Considering that the number of news is still a general indicator of the technology improvement and we do not have a measurement to quantify the relative importance of each individual news, we introduce an error term “  ”, which follows a normal distribution of
 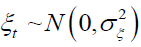 , to capture the unobserved technology improvement.
The estimation of  can inform us about the capability of officially released news on capturing the improvement of technology.
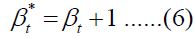
Customer Learning on News Releasing Frequency (IOTt)
In our learning model, customers believe “news” produced at time (t) following a Poisson distribution with parameter of λ. The reasons of choosing Poisson distribution are described as follows: First, customers learn on the future technology-related news which is a count-data. Therefore, we cannot utilize the normal distribution as the common learning model does. Poisson distribution has been widely accepted for modeling count data (Allenby et al., 1999; Gupta, 1991). Second, Poisson distribution is flexible and possesses analytical advantages. It belongs to the exponential family hence we could reach close form solution in Bayesian update.
Where λ represents the true mean level of the IOTt, which is unknown to the customers. This equation suggests that the news release frequency provides imperfect information about the true mean level of the IOTt.
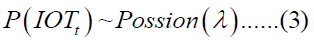
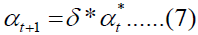
Next we define that, customers will learn this λ from the previous information set Iit. Given the existing information set Iit, a customer has formed a prior opinion about the true mean level of IOTt, e.g. λ, which follows a gamma distribution:
In Equation 4, Iit is defined as customer i’s existing information set at time t. Several sources can contribute to the customer information set Iit -- 1) customers’ prior knowledge about the high-tech  , e.g., the prior knowledge level before observing any technology improvement. 2) the officially released online news IOTt, which is considered as the representative of the improvement of technology. 3) customers’ intrinsic information process, which demonstrates how customers continuously evaluate the periodically released news. Each source will contribute to updating the customer beliefs about the technology improvement described in the following equations.
Note that in the later estimation approach, we fix the both the initial parameter of belief updating, e.g. 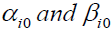 at zero for two reasons. First, the cloud service is a novel technology in the market thus it is reasonable to assume that customers do not possess knowledge about the specification of the technology at the beginning time. Second, from our empirical findings, the absolute values of these two initial parameters do not contribute significantly to the parameter estimation but add a computation burden. Therefore, we fix at zero for all customers. Consequently, the parameters of
  dimension reduces from both i- and t-specific to only t-specific
After observing the actual technology related news at time (t), customers begin to update their beliefs on the true mean level of news, e.g. λ through updating the two parameters of gamma distribution .
Where are the parameters of the prior distribution before observing the historical technology related news before time t and  are the parameters of posterior distribution of λt after the customers are exposed to the technology related news at time t.
Although customers can learn about the current technology level based on all the historical news, information far from the decision occasion may not be easily remembered or accessible to the customers. On the other hand, customers intuitively may consider the more recent information as more relevant because of both the easier accessibility and fresher memory. Moreover, according to the information process theory, it is highly possible that the customers will place more weight on the more recent information. Therefore, to account for such possibility in our model, we posit that customers recall their prior evaluation on the technology related news with noise. We capture such noise in the information updating model by keeping the mean level of the news perception constant and allow the variances to increase over time (Zhao, et al. 2011) δ. is the parameter that accounts for the information discount process and takes the value between 0 and 1. δ = 1 means there is no information discount.
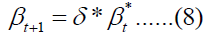
This setting ensures that the information discount process only impacts the variance of news perception while keeping the mean level constant, e.g.
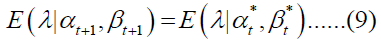
Our model is very flexible because the discount factor can vary between 0 and 1. Our estimation will tell us whether the discount equals 1 or not. If it equals 1, this means there is no discount, meaning that customers treat all historical information equally. The smaller the discount factor is, the heavier the historical information will be discounted.
Customer Dynamic Optimization on the Contract Length (CL)
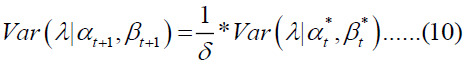
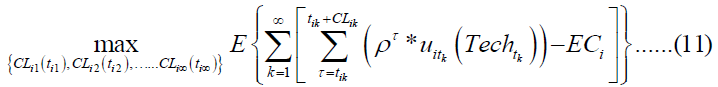
We model the customers’ decisions of whether to adopt the high-tech service and how long to sign a specific length of contract CL as a dynamic programming process. Specifically, as we illustrated previously, in order to quantify the impacts of technology improvement on customer’ decision process, we integrate both customer’s contract length decision and the two states of technology improvement into the dynamic programing approach. The customers’ objective is to make an infinite sequential decision. This corresponds to the method of using infinite-horizon dynamic programming to solve a customer’s Markov decision process (Rust, 1994). Basically, the optimal decisions of whether to buy and how long to buy for each customer i at any purchase occasion t is the solution to the following problem:
With the constraint of

Where  indicates that customer i make the kth adoption decision at time kik with a contract length of
  is the “current net-utility” that customer i possessed from making the kth adoption decision at purchase occasion tik . For customer i, as shown in Equation 1,
  is defined as follows:

Both Equation 1 and Equation 12 define the customer’s period utility associated with the current decision. The only difference is that: Equation 1 in general defines the net-utility at any given purchase occasion t; while Equation 12 specifically indicates the net-utility at any kth adoption decision occasion tk. Therefore, we use tk in Equation 12 instead of . Recalled that there is a “lock-in” effect in our empirical context, e.g., customers are bonded with the on-site technology level once they sign a contract. Reflected in our model, once customers sign a contract, the period-utility that customers can receive within the contract duration will be the same as the utility at the decision occasion.  is the utility discount factor, which is used to discount all the future utilities to the current purchase occasion.
  is the customer i-specific unobserved one-time effort associated with signing a contract. EC is associated with each individual contract. Considering that customer’s efforts on signing a new contract can be diversified because the customer’s needs are unique, we assume that the unobserved effort will follow a log-normal distribution, e.g.,
  . The reason of choosing a log-normal distribution for is that customers’ effort is equivalent to a cost measure, which should be non-negative.
Derive Bellman Equation
To solve the optimal decision shown in Equation 11, we derive the bellman optimality equation. We define the major components in the Markov decision process in our study as follows:
1. Decision variable(s)  : the decision variables indicate customers’ decisions at each decision occasion. In our study, the decision variable is customer’s “contract length” decision e.g.
  , which is a continuous variable. When contract length equals zero, it represents customer’s no-purchase decision.
2. State variables  :
:  represents the current state variables that customer face at the current decision occasion . The state variables determine the value that the customer can obtain from the contract length decision. In our study, we have four state variables, e.g.,
  .
.
3. The transition probabilities for all state variables 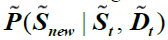 : Given a contract length decision CL, the
  . Note that the structure of transition probability is novel in our study. In existing studies, the state variables usually transit to the next period, e.g.
 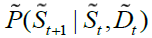 . However, in our study, the new states are determined by the contract length decision. In order to optimize a current purchase decision, customers need to combine both the utility at the decision occasion and all future discounted utilities. When customers evaluate the all future utilities, they do not know the corresponding level of the state variables. Therefore, we will have to take the expectation, which requires the transition probability. We compute the expectation through simulation and we define that the state variables update in the following manner:

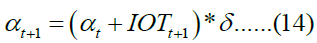
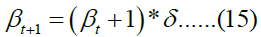
Where  ; and
; and 
Following the theory defined in dynamic programming, we derive the Bellman Equation, e.g., the value function specifically for our study as follows:
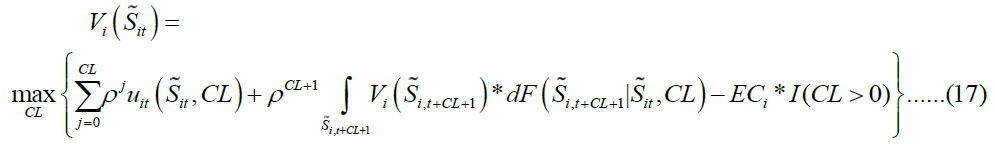
Where  is the maximum value customer i can obtain at a decision occasion t conditional on a set of states
  . At the decision occasion t, customers are available for making any contract length decision. Only at the optimal contract length decision, customers can receive this maximum value
  , which is larger than the values that the customers can obtain from any other contract length decisions.
  is an indicator function.
 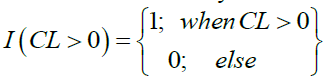 . The derivation and simulation of value function are in detail described in Appendix A.
Likelihood Function
In our model setup, we can categorize the parameters into four groups: 1) the parameters in the period utility function:  ; 2) the parameters in the technology improvement function:
  ; 3) the parameters in the customer learning model: δ; and 4) efforts of signing the contract: .
To derive the likelihood function, we need the expression of the stochastic term as a function of the decision variable  . However, it is difficult to extrapolate the likelihood function with all the parameters involved in the relationship between
  and . Therefore, we employ the following logic to find the likelihood function. First, we derive the relationship between and conditional on all the parameters; second, we show how we deal with customers’ two decisions, e.g. and
  ; last, we integrate out all the parameters to obtain the likelihood function.
Combining the value function (Equation 17), technology improvement function (Equation 2) and customer learning function (Equation 5 to Equation 8), we can obtain the relationship between and given all the parameters as follows:
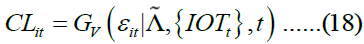
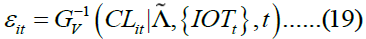
Where “GV” is the solution of as a function of εit given all the parameters  and data of
  . Obviously,
  is the inverse function of GV and gives the solution of as a function of . is the parameter space and
 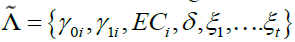 . Since we do not have the close-form solution for , we will numerically find ε at a given "CL".
Recall that, in our context, there is a lock-in effect when customers sign a contract. Within the contract duration, customers are temporarily unavailable for decision making. To illustrate the likelihood function more straightforwardly, we define that  is the set of all decision occasions t for customers i. For all the decision occasion t within the , customers i is available for making decision, e.g. they are not locked with a contract. Within the decision occasion space of , the customer’s decisions has two circumstances. One is the “no-purchase decision” meaning that the customer i do not purchase the service. We define
  as the set of “no-purchase occasions”. The other is the “purchase decision” meaning that the customer i purchases the service and signs a contract. We define
  as the set of “purchase occasions”.
Next we can define the two parts of the Likelihood function corresponding to the two types of decision:


Where  is the pdf of normal distribution and is the cdf of normal distribution.
  is the Jacobian of the transformation from the random utility error to the likelihood of observed data
  .
.
Finally, we are able to derive the Likelihood function:

Where  is the i-specific parameter space and
 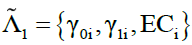 whose location parameters space is
 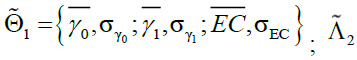 ; is the t-specific parameter space and .
Model Estimation
We estimate the model parameters using a “Simulated Maximum Likelihood Estimation” approach. And we use the “Simplex Method” to identify the optimal parameter estimation result (Nelder et al., 1965). Although Simplex is not as efficient as Newton-Raphson method, it is more stable and robust because it does not need the numerical solutions of Hessian Matrix and Gradients in the process of maximization 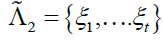 .
.
Empirical Identification
As shown in the Equation 22, the parameters in our forward-looking structural model include: 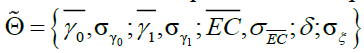 . Major concern may exist on whether we can separately identify the parameters taking into account the customer heterogeneity, e.g.,
 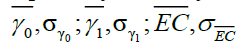 . We address that, given the information in our data, we can successfully identify them.
First of all, both γ0 and γ1 exist in the period net-utility function (Equation 1) and the period net-utility is a major component in the value function (Equation 8) that determines both “whether to buy” and “how long to buy” decisions. Therefore, both decisions involve in the identification of γ0 and γ1. Further, in the period net-utility function (Equation 1) γ0, represents the customer’s mean-level net-utility toward the technology and γ1 captures customer’s utility sensitivity of the overall technology level. It is obvious that they can be separately identified because we can observe the current technology level through identifying the number of news.
Second, the identification of EC, e.g., efforts of signing a contract, depends on both the “whether to buy” and “for how long to buy” decisions. In our setting, EC does not exist in the period net-utility function. Thus, it has no effect on the period utility. However, it affects the customer’s contract length decision through influencing customer’s overall value. Specifically, a higher EC means that the customers will have to input heavier one-time effort, such as learning the technique, training employees and negotiating with the firm, etc. in order to finalize the contract. Consequently, the customers tend to sign a longer contract to avoid another input. When EC are too high, customers can delay the purchase decision. Therefore, EC can also influence the “whether to buy” decision.
Further, we conducted a simulation study to empirically demonstrate that both our estimation algorithm is valid and all our parameters are identifiable. We generated customers’ contractual decision data based on the value function we derived in Equation 17. Our simulated data contains 100 customers each making purchase decisions in a 36 time periods window. According to our simulation result, we are able to recover all the true parameters within 95% confidence interval, which justify the validity of our model estimation on real data. For details on the simulation process.
RESULTS
In this section, we first discuss the estimation results of the proposed model. Based on the parameter estimation results, we will show how customer’s value is shaped, e.g., the value function structure.
Parameter Estimation
The parameter estimation appears in Table 3. We take into account the customer heterogeneity for three parameters in the model, e.g., γ0, which is the mean-level net-utility; γ1, which is the coefficient of technology in the utility function (Equation 1), and EC, which is the parameter to capture the effort of signing a contract. Therefore, their parameter estimations include both the mean-level and the standard deviation.
| Table 3 Dynamic Structural Model Parameter Estimations | |||||
| γ0 | γ1 | EC | δ | σξ | |
| mean | -1.741 | -5.747 | -0.0734 | 0.821 | 0.988 |
| -0.096 | -0.337 | -0.506 | -0.072 | -0.814 | |
| Standard deviation | 2.041 | 0.542 | 4.086 | ||
| -0.291 | -0.278 | -0.799 | |||
Standard error (Table 3) of the estimation suggests that all estimated parameters (except for  ,
,  and
and  ) are significant at the 95% significance level. It is worth mentioning that parameters γ1 and EC are estimated as log-normal distribution. The significance of the estimation results for , does not have a physical meaning.
From Table 3, we can see that, all three variance-term, e.g., 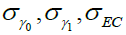 are statistically significant. This confirms the existence of customer heterogeneity in their decision process.
Next, we observe that the estimated absolute value of appears to be small ( = -5.747 implies that mean-level of γ1 is approximately 0.0032). γ1 captures the extent to which the change of overall technology level (e.g. Techt) will impact customers’ period utility (Equation 1). Shown in Equation 2, the overall technology level has two major components: the cumulative technology-related news (e.g. Newst) and unobserved technology improvement (e.g.  ). From our data, we observe that the cumulative news can range from 3 to 137 within our transaction data time frame (e.g., from Jan. 2009 to Sep. 2011). Adding in the term will make the overall variation even larger. Therefore, given the fix variance of the net-utility error
  , the term of
  still plays an important role in determining the customer’s period utility due to the large variation of the Techt. Our policy simulation also show that the overall technology level significantly impact the customer’s net-utility.
The estimated information discount δ is 0.821 suggesting a relatively heavy information discount. With a discount factor of 0.821 at the monthly level, information that is more than two years old is no longer considered in a customer’s evaluation of future technology level. These results suggest that in the fast developing high-tech B2B market, customers’ beliefs about the technology improvement significantly discounted over time.
Table 3 indicates that the estimation result of is not significant at 95% level. This result implies that the news-count provides a reasonable estimation of the technology improvement.
Value Function under Parameter Estimation Results
Based on the estimated parameters, it will be interesting to know how a cloud adopter’s value is shaped in our study. Recall that in our model, we have four state variables, e.g.,  and the decision variable is the contract length CLit. We will show the structure of value function through different angles.
Firstly, we show how customers’ value  will change with the two technology improvement states, e.g. Tech and
  (Figure 3). By optimizing the contract length decision CL and integrating out the (Equation A1), we are able to derive the customers’ value only as a function of the two focal state variables of technology improvement, e.g. the technology improvement pace and the overall technology level Tech. Figure 3 shows that, the customer’s value is positively related to both overall technology "Tech" and technology improvement pace . This result confirms that customers should be beneficial from both the elevation of overall technology level and the increase of technology improvement pace.

Figure 3 Relationship between Cloud Adopter’s Value and Two Focal State Variables
Next, we present the customers’ value as a function of the other two focal states: contract length decision CL and error term ε (Figure 4). Since there is no way to derive a marginal function, the relationship between  (Equation A2), CL and ε shown in Figure 4 is given conditional on a combination of Tech and states. We have several observations from Figure 4. First, a customer’s value has a clear positive relationship with the error term ε. Recall that ε captured the unobserved factors impacting customer’s net-utility. It is obvious that the customers should receive more value if there is a larger positive impact in the business environment. For example, the service provider gives a temporary price discount or offers some additional services. Next, we observe that, there is a monotonic relationship between ε and optimal contract length decision CL ,e.g. ε increase, the
  also increase and vice versa. This monotonic relationship ensure the one-to-one mapping between ε and CL optimal thus the feasibility of maximum likelihood estimation.

Figure 4 Relationship between Cloud Adopter’s Value and Contract Length Decision
Finally, we compare the patterns of customers’ value  (Equation A2) between different levels of Tech and (Figure 5). We extract the relationship between and CL given all state variables in order to demonstrate how the technology improvement will influence the optimal contract length decisions. From Figure 5, we firstly observe that, when the overall technology level is low, no matter whether the technology improvement pace is low (Figure 5A) or high (Figure 5C), the shape of a customer’s value indicates that the
 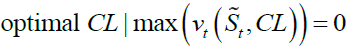 . This result suggests that, when the technology level is low, customers do not purchase the service. When the overall technology level is high enough (Figures 5B and 5D), the optimal CL is greater than zero, meaning customers purchase the service. Next, by comparing Figures 5B and 5D, we find that given the same technology level, a lower improvement speed is associated with a longer optimal CL. This result indicates that, when the technology improvement pace is low, if the customer decides to buy, he/she is more likely to buy with a longer contract. In contrast, customers are more likely to buy a shorter service contract when expecting a fast technology innovation pace.

Figure 5 Compare the Patterns of Consumer’s value between Different Levels of Overall Technology and Technology Evolution Pace
Policy Simulation
Given the parameter estimation results, we conduct two policy simulations to answer our research questions. First, we examine the effect of changing technology improvement structure on a customer’s decisions. This experiment demonstrates how the technology improvement influence a customer’s decision processes and how managers could strategically manage the technology improvement. Second, we investigate how the effort of signing a contract impacts a customer’s decision. This analysis provides insights on how managers can influence a customer’s decision through adjusting a B2B customer’s efforts of signing a contract.
Technology Improvement Structure
As we all know that in a hi-tech market, both releasing new technology and updating existing technology are very strategic. It is a very common phenomenon in a hi-tech market that firms may research and develop a new tech this year, but release it 5 years later. For example, Apple releasing a new version of Iphone every year is a strategic way to announce technology improvement to its B2C customers. Our policy simulation of how customers respond to different structures of technology improvement sheds light on how the firm could strategically adjust the technology improvement in a B2B service market.
We define two schemes of technology improvement: “jogging pace” and “leaping pace” in our policy simulation. In the “jogging pace” improvement, the technology update happens more frequently but the degree of each update is smaller. The “jogging pace” improvement is represented by an evenly distributed technology update every month. In the “leaping pace” improvement, the technology update happens less frequently but the degree of each update is larger. The “leaping” pace is represented by a remarkable technology update in one month after no update for several months.
There are two types of the “leaping pace” improvement: 6 month leaping pace and 12 month leaping pace. In the first one, the technology update happens only in months 6, 12, 18, 24, 30 and 36; and in the latter, the technology update happens only in months 12, 24, 36. To make the two paces of improvement comparable, we will keep the cumulative updates consistent between the “jogging” and “leaping” paces. For example, if cumulative updates is 12 in month 6 (evenly distribute 2 updates per month) under “jogging pace”; then in month 6, 12 updates are simultaneously released (no updates from month 1 to 5) under “leaping pace”.
In our results, we firstly compare, on average, the customer’s purchase probability and contract length decision between jogging pace and leaping pace (Figure 6). We can see that, over a 36 months window, on average, changing from jogging pace to leaping pace results in a systematic decrease in purchase probability (Figure 6A) and an increase in contract length decision (Figure 6B). Specifically, from jogging pace to 6 months leaping pace, the purchase probability reduce 8.01% and contract length increase 8.34% (Figure 6A); from jogging pace to 12 months leaping pace, the purchase probability reduce 21.07% and contract length increase 20.68% (Figure 6B). This suggests that, when facing leaping pace technology improvement, customers are less interested in adopting the service; but if they decide to purchase, they tend to sign a longer contract.

Figure 6 Relationship between the Technology Evolution Structure and Average-Level Customer’s Decision
Second, we illustrate how a customer’s purchase decision will change over time (Figures 7A and 7B). We are interested to know how the technology improvement influences the customer’s timely decision. We find that, under jogging pace, a customer’s purchase probability shows a slightly upward trend over time (Figure 7A, Blue line), while his/her contract length decision shows no systematic trend (Figure 7B, Blue line). When the technology update is evenly distributed every month, the overall technology level will gradually increase over time, but the speed of technology improvement is relatively stable. Reflected in customers’ decisions, over time, customers will become more willing to buy, but their decisions on the contract length do not have a systematical change. Next, under leaping pace, both customers’ purchase probability and contract length decision clearly respond to the technology update occasion. For example, a customer’s purchase probability remarkably peaks at the technology update months (Figure 7A); while the customer’s contract length significantly drops at the technology update months (Figure 7B) for both leaping paces. This result indicates that, a remarkable technology update can also create an instant effect on customers’ purchase decisions. Specifically, a customer’s willingness to buy significantly increases due to the abrupt elevation of overall technology level. The high speed of technology improvement incites customers to form higher expectation on the future technology update. Consequently, customers tend to sign a much shorter contract to capture future benefits.

Figure 7 Relationship between the Technology Evolution Structure and Customer’s Timely Decision
Last, we show the policy simulation results of three derivations of customers’ decisions: the purchase frequency, the total months of service used by the customer and the customer’s first purchase time (Figure 8). All three items are calculated within a 36-month decision time window. The reasons of selecting these three items are as follows: First, in our data, we do not observe the customers’ cost and value to the firm. But, we could use customers’ decisions to infer their potential cost and value and show the possible changes with the technology improvement structure, which can be especially interesting to the firm. It is widely acknowledged that the business buying process is a complicated one and each contract is associated with remarkable cost (Marketing Charts staff, 2014). From the firm’s perspective, it can save more cost if the customers sign the contract less frequently. Therefore, we use the purchase frequency to infer the firm’s cost on the customers. Next, it is obvious that the more months the customers use the service, the more revenue the firm can earn from the customers. And the earlier the customers begin to make the purchase, the quicker the service provider can start to reap profits from the customers. Therefore, we use the total months of service and the customer’s first purchase time to infer the potential value of the customers to the firm.

Figure 8 Relationships between the Technology Evolution and Derivations of Customers’ Decision
From the policy simulation, we find that changing from jogging to leaping pace technology improvement systematically reduces the customer’s purchase frequency (Figure 8A). Specifically, from jogging pace to 6-month and 12 month leaping paces, customers’ purchase frequency, on average, reduce 15.86% and 21.65%, respectively. Next, we observe that the total months of service slightly decreases from jogging to leaping pace (<1%) (Figure 8B). Recall that we use purchase frequency and total months of service to infer the customer’s potential cost and revenue to the firm respectively. These results imply that, comparing with jogging pace, customers contribute similar level of revenue (<1% decrease) but save more than 15% cost to the firm in leaping pace. Consequently, firms could seize more profit from the customers by utilizing leaping pace strategy to announce technology evolution. Further, the first purchase time increase about 3% when changing from jogging pace to leaping pace (Figure 8C). This implies that, the firm waits longer in leaping pace for a customer to adopt the service.
Efforts of Signing a Contract
In this section, we will show how a customer’s decision is changed with the “efforts of signing a contract.” Again, the “efforts of signing a contract” is a customer’s one-time effort associated with each contract, such as training employees and negotiating with the firm etc. Although this one-time effort is primarily under the control of the business customer, firms can still implement some plans to partially alter it. For example, to reduce this effort, the firm could proactively offer some help to the customers, such as collaborating with the customers to train their internal IT employees or providing some extra support to help customers learn the service technique, etc. On the contrary, the firm can also increase the customer’s effort of signing a contract by acting less friendly toward the customers. Therefore, the policy simulation on efforts of signing a contract can also provide valuable strategic implications.
We compare the customers’ decisions at three levels of the “effort of signing a contract”: benchmark effort; half of the benchmark effort and twice of the benchmark effort. Similar as the policy simulation for technology improvement structure, we will show results in the following two fields: 1) on average the customers’ purchase probability and contract length; and 2) the three derivations of customers’ decisions inferring the cost and value of the customers to the firm. Changing the efforts does not alter the pattern of a customer’s decision over time. Thus, we omit the results of it here.
First, on average, a customer’s purchase probability shows a negative relationship with the effort (Figure 9A); and a customer’s contract length has a positive relationship with the effort (Figure 9B). Specifically, reducing 50% of the effort can increase 10.12% of customers’ purchase probability, while doubling the efforts can reduce about 11.94% of the purchase probability. On the contrary, reducing 50% of the efforts deducts the contract length by 5.56%, while doubling the efforts can boost it up by 6.08%. The results indicate that, reducing customers’ efforts does incite customers to buy the service; however, when signing a contract becomes easier (less effort), customers tend to sign shorter contract to better capture future benefit from the technology improvement. On the other hand, when the efforts of signing a contract are increased, customers are less likely to buy; but if they decide to buy, they tend to buy with a longer contract to avoid another bulky input.

Figure 9 Relationship between the Efforts of Signing a Contract and Average-Level Customer’s Decision
Next, Figure 10 illustrates the relationship between the effort and the three derivations of customers’ decisions: purchase frequency, total months of service, and the first purchase time. From Figure 10, we observe that, when we reduce 50% of the efforts, customers sign the contract more frequently (7.40% increase), use slightly more months of service (0.14% increase), and adopt the service earlier (3.09% decrease in first purchase time). The findings suggest that reducing the efforts can incite customers to buy earlier and earn slightly higher revenue. However, customers tend to sign contracts more frequently thus consuming more cost from the firm. In comparison, doubling the efforts reduces both customers’ purchase frequency (6.46% decrease) and total months of service (0.52% decrease), and elevates the customers’ adoption time (1.73% increase). The results suggest that increasing the efforts can help the firm save cost on the customers, but both the revenue slightly decreases and customers tend to adopt later.

Figure 10 Relationship between the Efforts of Signing a Contract and Derivations of Customers’ Decision
Managerial Implication
We provide the high-tech firms the following managerial insight relevant to the main focus of our study. From our modeling framework, we address that: first of all, when customers make contractual decisions in a continuous innovation environment, customers’ decisions are forward-looking, which requires a structural way to model their decisions process. Second, the continuous technology evolution significantly influences customers’ decisions of both whether to buy and how long to buy (e.g., contract length decision). The influences of technology evolution are multi-dimensional. Therefore, managers should separate the effects of overall technology level and the technology evolution speed in order to make an accurate inference on the how the evolution of technology changes the customer’s decisions. Third, with our model, given the historical technology evolution information, the respective service provider is able to estimate, on average, a customer’s purchase probability and contract length decisions at each decision occasion. Managers can use the results for evaluating the performance of current technology improvement and making the strategic plan for future innovation. Last, the results of parameter estimations show that a customer’s period utility, e.g., his/her purchase decisions, is significantly tied to the overall technology level. Therefore, managers should continue to improve the technology level of the service to increase a customer’s purchase intention. Moreover, significant customer heterogeneity is observed in parameters of customer’s expected net-utility, e.g., γ0 ; customer’s utility sensitivity of the overall technology level, e.g., γ1 and a customer’s efforts of signing a contract, e.g., EC. This suggests that, even though the business customers should prefer the focal firm as their first choice of adopting the high-tech service, both a customer’s intrinsic preference or attitude toward the service-related technology and his/her internal process of finalizing a purchase decision are diversified. The service provider could potentially build customer profiles for the high preference or/and low effort customers and attempt to gain higher share-of-wallet from them. Our counterfactual experiments also offer substantive insights. First, managers can strategically update the continuous innovation according to their business goals. If the managers are interested in market penetration, e.g., inciting customers to buy and expecting an earlier purchase time, they should frequently update the innovation to the customers with a mild improvement in each step. On the other hand, if they aim at gaining profits from the customers, they should update the innovation less frequently with remarkable improvement in each step. Second, managers can shift a customer’s decision by adjusting a customer’s efforts of signing a contract. Similarly, managers should make a strategical decision on how to adjust such efforts based on their business goals. In general, if the managers are concerned about whether a customer will buy, they could initiate some tactics to reduce the efforts, which will boost the customer’s purchase probability. On the other hand, if the managers want to receive more value from each contract, they can intentionally create barriers to elevate a customer’s efforts. According to our results, although customers are less inclined to make the purchase decision, once they decide to buy, they tend to sign a longer contract, which is more valuable to the firm and sign the contract less frequently which save the firm’s cost. Finally, since our policy simulation also provides a quantitative evaluation of the customers’ decision changes under different scenarios, the firm can combine our results with their internal profit function to design the optimal strategy for profit maximization.
Conclusion and Future Directions
In this study, we develop a structural modeling approach to understand the impact of technology evolution on a customer’s dynamic decision process in a continuous innovation B2B high-tech market. In the model, we account for a customer’s forward-looking and learning behaviors. We contribute to the forward-looking dynamic models by integrating the customer’s continuous decision (e.g., contract length) into the dynamic programming process. Specifically, the contract length involves in the determination of the customer’s transition states in the value function in the dynamic programming approach. Moreover, our forward-looking framework can automatically capture the contract lock-in effect and extend the model application into the B2B service market. Our study also provides substantive insights to aid a manager’s strategic decision making. We address that, in this novel and fast developing high-tech service market, customers make decisions in a turbulent environment thus exhibiting both forward-looking and learning behaviors in their decision process. We enrich the existing knowledge by separately quantifying the multi-dimensional effects of technology evolution on customers’ decisions. Through policy simulation, we empirically demonstrate that, managers can implement strategical plans on how to communicate the innovation to the customers and how to manipulate a customer’s efforts of signing a contract according to their business goals.
Finally, our study still has several development spaces for future research. First of all, our study only focuses on US market. However, in emerging markets such as China and India, people show a stronger thirst for technology innovation. It will be very interesting and unique to discover how technology improvement impacts customers’ decisions in emerging markets. Therefore, future research could extend our model setup into emerging market to demonstrate how the customers in emerging market would respond to the technology evolution in their decision process. Second, we do not consider competition in our model due to our data limitation. If data is available, our model can be extended to show influences of competitors’ information on customers’ decision process. Last, we only test and apply our model framework in the high-tech service market. But a customer’s contractual decision is not limited to the context in our study but appears in many areas, such as mobile phone, TV service, internet etc. Future research may consider apply the model to other situation where a customer needs to make a continuous decision in a turbulent market.
Appendix
Modeling the Dynamic Decision of a Contractual Adoption of a Continuous Innovation in B2B Markets
Web Appendix
Appendix A – Computation of the value function
In this section, we describe the details of how we empirically solve the value function. To simplify the expression, we neglect the consumer (i) subscripts. Ideally, we should iteratively compute the value function until it converges at all decision time points. However, to reduce the computation burden, we follow the “backsolving” method introduced by Erdem and Keane (2003). We select a terminal period T and assume that: when the transit period beyond the terminal period T, consumer’s value become zero at all state points (Erdem and Keane, 2003), e.g.  . We follow the criteria specified in Erdem and Keane’s study (1996) to find the terminal period T, e.g. if we fix the utility discount factor at 0.9, a terminal period
  is enough for finding a converged value function. In our study, we select a terminal period T = 150 with the utility discount factor fixed at 0.9 Appendix Table 1.
| Appendix Table 1 Simulation Study Results | ||||
| Parameter | Estimated Values | True Values | ||
| Mean | SD | |||
| Expected net-utility |  |
-1.027 | 0.044 | -1 |
 |
 |
1.327 | 0.173 | 1.649 |
| coefficient of overall technology level |  |
-5.714 | 0.119 | -5.5 |
 |
 |
0.635 | 0.118 | 0.607 |
| Effort of signing contract |  |
0.117 | 0.127 | 0 |
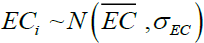 |
 |
0.534 | 0.103 | 0.607 |
| Information Discount |  |
0.883 | 0.019 | 0.881 |
| Error term for Unobserved technology improvement |
 |
0.869 | 0.682 | 1 |
In our dynamic programming model, we have in total four state variables  and all of the state variables are continuous. Therefore, we cannot solve value function for all potential state points but need to use approximation method (Erdem and Keane, 2003). We first define “region” and “grid” for each state variable. We can compute the exact result of value function at each “grid” points (Note: the grid points are defined for all state variables). If the states of the value function that we need do not fall on the “grid” points, we will use the Kernel non-parametric regression (Altman, 1992) to find the approximate solution.
Next, we want to reduce the dimension of the state variables so that we can both simplify the value function computation process and ease the computation burden. We can reduce the dimension of state variables to 2-dimension as follows:
First, we integrate out the state variable of "ε" in the value function because it is "iid" an random component. The value function shown in Equation 10 can be re-defined as follows:

Where  and
and  ;
;
Second, the parameter "βt" is a deterministic term and can be exactly computed by time hence we can create a new state variable by combining both "αt" and "βt", e.g.  . This new state variable is not a pure mathematical expression but have physical meaning: suggests consumer’s perception on the mean-level of the technology evolution pace. Although we reduce the state space by introducing as the state variable, we lose control on the . Consequently, our value function becomes non-stationary, e.g. it becomes t-specific (A2).

Please note that the 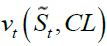 in Equation A2 is the customer’s value before maximization, thus it is a function of both state variables of
 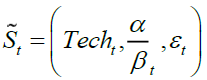 and decision variable of contract length,
  . Now, we can simulate the value function as follows:
Step 1: Define the “region” and “grid” for the state variables. We only need to define “region” and “grid” for  as ε can be separately integrated out. We define the “region” of state variables based on the actual data.
Step 2: For terminal period t=150, and 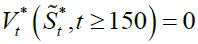 .
.
Step 3: At t=149, use Equation A2, we can compute the  at all from 0 to 60.
Step 4: Compute the customer’s maximized value and optimal contract decision as follows:
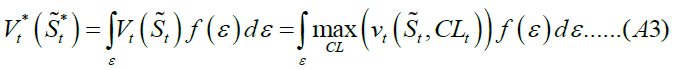
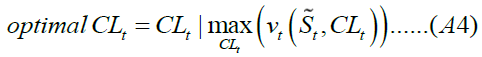
Step 5: Redo step 3 and 4 to t=1.
Appendix B – Numerical Finding "ε" at a Given "CL"
This appendix describes how we numerically compute the "ε" at a given "CL". We prove that there is a monotonic increasing relationship between "ε" and "CL" for CL >0. Therefore, we will use the bisection method to iteratively find the solution of at a given "CL". The detailed steps are described as follows:
Step 1: We compute the Value Function, e.g.  following the steps shown in Appendix (A).
Step 2: Select initial upper and lower bound of "ε", e.g. "εl and εu" and find the corresponding , e.g. for .  .
.
Step 3: We can use the bisection method to find the exact for  . If , we can find the upper limit of
  , meaning
  for all values of
  .
.
Appendix C – Simulation Study
We conducted a simulation study in order to empirically prove that we can successfully identify and recover all the parameters in the proposed model. In our simulation study, we used pre-defined parameters to create customers’ adoption decisions and then attempt to estimate the parameters using the synthetic data. As specified in the model, we capture the customer heterogeneity by generating the parameters of with a true population mean and variance. Our simulated data contains 100 individual customers who make the service contractual decisions in 36 time periods windows. Customers made a contractual decision at each time period. However, once the customers signed a contract, they are not available for making another decision within the contract duration. Customers’ purchase decisions were determined by the value function as we described in Appendix A and we relied on maximum likelihood method for parameter estimation. We reported both the true and estimated parameters. Our simulation results suggested that we were able to recover the parameter within a 95% confidence interval.
References
Abadi, D. J. (2009), “Data Management in the Cloud: Limitations and Opportunities,” IEEE Data Eng. Bull., 32(1), 3-12.
Allenby, Greg M., Robert P. Leone, and Lichung Jen. (1999), "A dynamic model of purchase timing with application to direct marketing." Journal of the American Statistical Association, 94(446), 365-374.
Indexed at, Google Scholar, Cross Ref
Altman, N. S. (1992), “An introduction to kernel and nearest-neighbor nonparametric regression,” The American Statistician, 46(3), 175–185.
Indexed at, Google Scholar, Cross Ref
Bass F. M. (1969), “A New Product Growth for Model Consumer Durables,” Management Science, 15(5), 215–227.
Indexed at, Google Scholar, Cross Ref
Chandy, Rajesh K. and Gerard J. Tellis (1998), “Organizing for Radical Product Innovation: The Overlooked Role of Willingness to Cannibalize,” Journal of Marketing Research, 35 (November), 474–87.
Indexed at, Google Scholar, Cross Ref
Chung, Doug J., Thomas Steenburgh, K. Sudhir. (2014), “Do Bonuses Enhance Sales Productivity? A Dynamic Structural Analysis of Bonus-Based Compensation Plans,” Marketing Science, 33(2) 165-187.
Indexed at, Google Scholar, Cross Ref
Erdem, Tülin and Michael P. Keane (1996), “Decision-Making Under Uncertainty: Capturing Dynamic Brand Choice Processes in Turbulent Consumer Goods Markets,” Marketing Science, 15(1), 1-20.
Indexed at, Google Scholar, Cross Ref
Ettlie, J. and A.H. Rubenstein (1987), “Firm Size and Product Innovation,” Journal of Product Innovation Management, 4 (2), 89–108.
Indexed at, Google Scholar, Cross Ref
Foster, Richard (1986), “Innovation: The Attacker's Advantage,” Journal of Product Innovation Management, 4 (3), 239–240.
Goettler, Ronald L. and Karen Clay (2011), “Tariff choice with consumer learning and switching costs,” Journal of Marketing Research, 48(4), 633-652.
Indexed at, Google Scholar, Cross Ref
Gönül, Füsun and Kannan Srinivasan (1996), “Estimating the Impact of Consumer Expectations of Coupons on Purchase Behavior: A Dynamic Structural Model,” Marketing Science, 15(3), 262-279.
Indexed at, Google Scholar, Cross Ref
Gordon, BR (2009), “A Dynamic Model of Consumer Replacement Cycles in the PC Processor Industry,” Marketing Science, 28(5), 846–867.
Indexed at, Google Scholar, Cross Ref
Gupta, Sunil (1991), “Stochastic Models of Interpurchase Time with Time-Dependent Covariates”, Journal of Marketing Research, 28(1), 1-15.
Indexed at, Google Scholar, Cross Ref
Lewis, Michael (2004), “The Influence of Loyalty Programs and Short-Term Promotions on Customer Retention,” Journal of Marketing Research, 41(3), 281-292.
Indexed at, Google Scholar, Cross Ref
Liu, X., Montgomery A., and Srinivasan, K. (2014). “Overhaul Overdraft Fees: Creating Pricing and Product Design Strategies with Big Data,” Working paper.
Nelder, John A., and Roger Mead (1965), "A simplex method for function minimization," The computer journal, 7(4), 308-313.
Indexed at, Google Scholar, Cross Ref
Qu Yingge, V. Kumar and Yi Zhao (2023), “A dynamic model of the contract length and early termination: The roles of technology evolution and pricing strategy”, Journal of Business Research, 167 (2023), 114141.
Indexed at, Google Scholar, Cross Ref
Rust, John (1994), “Structural Estimation of Markov Decision Processes,” Handbook of Econometrics, 4, 3081-3143.
Indexed at, Google Scholar, Cross Ref
Ryan, Stephen P. and Catherine Tucker (2012), “Heterogeneity and the Dynamics of Technology Adoption,” Quantitative Marketing and Economics, 10, 63–109.
Indexed at, Google Scholar, Cross Ref
Sadavarte, R. K., Kurundkar, G. D., & Parbhani, D. (2020). Data security and integrity in cloud computing: Threats and Solutions. International Journal of Scientific Research in Computer Science, Engineering and Information Technology, 356-363.
Indexed at, Google Scholar, Cross Ref
Song, Inseong and Pradeep K. Chintagunta (2003), “A Micromodel of New Product Adoption with Heterogeneous and Forward-Looking Consumers: Application to the Digital Camera Category,” Quantitative Marketing and Economics, 1, 371-407.
Indexed at, Google Scholar, Cross Ref
Sood, Ashish and Gerard J. Tellis (2005), “Technological Evolution and Radical Innovation,” Journal of Marketing, 69 (3), 152-168.
Indexed at, Google Scholar, Cross Ref
Sood, Ashish, Gareth M. James, Gerard J. Tellis and Ji Zhu (2012), “Predicting the Path of Technological Innovation: SAW vs. Moore, Bass, Gompertz, and Kryder,” Marketing Science, 31 (6), 964-979.
Indexed at, Google Scholar, Cross Ref
Sorescu, A. B., Chandy, R. K., & Prabhu, J. C. (2003). Sources and financial consequences of radical innovation: Insights from pharmaceuticals. Journal of marketing, 67(4), 82-102.
Indexed at, Google Scholar, Cross Ref
Sriram, S., Pradeep K. Chintagunta and Manoj K. Agarwal (2010), “Investigating Consumer Purchase Behavior in Related Technology Product Categories,” Marketing Science, 29(2), 291-314
Indexed at, Google Scholar, Cross Ref
Tang, Q., Gu, B., & Whinston, A. B. (2012). Content contribution for revenue sharing and reputation in social media: A dynamic structural model. Journal of Management Information Systems, 29(2), 41-76.
Indexed at, Google Scholar, Cross Ref
Walter, C (2005), “Kryder’s law,” Scientific American, 293(2):32–33.
Indexed at, Google Scholar, Cross Ref
Xu, L., Duan, J. A., Hu, Y. J., Cheng, Y., & Zhu, Y. (2015). A dynamic structural model for heterogeneous mobile data consumption and promotion design. SSRN Scholarly Paper ID, 2687203.
Indexed at, Google Scholar, Cross Ref
Yang, B., & Ching, A. T. (2014). Dynamics of consumer adoption of financial innovation: The case of ATM cards. Management Science, 60(4), 903-922.
Indexed at, Google Scholar, Cross Ref
Yao, S., Mela, C. F., Chiang, J., and Chen, Y. (2012), “Determining consumers' discount rates with field studies,” Journal of Marketing Research, 49(6), 822-841.
Indexed at, Google Scholar, Cross Ref
Young, P. (1993), “Technological Growth Curves: A Competition of Forecasting Models,” Technological Forecasting and Social Change, 44 (4), 375–389.
Indexed at, Google Scholar, Cross Ref
Zhao, Y., Zhao, Y., & Helsen, K. (2011). Consumer learning in a turbulent market environment: Modeling consumer choice dynamics after a product-harm crisis. Journal of Marketing Research, 48(2), 255-267.
Indexed at, Google Scholar, Cross Ref
Zhou, K. Z., Yim, C. K., & Tse, D. K. (2005). The effects of strategic orientations on technology-and market-based breakthrough innovations. Journal of marketing, 69(2), 42-60.
Indexed at, Google Scholar, Cross Ref
Received: 11-Nov-2024, Manuscript No. AMSJ-24-15437; Editor assigned: 12-Nov-2024, PreQC No. AMSJ-24-15437(PQ); Reviewed: 20-Dec-2024, QC No. AMSJ-24-15437; Revised: 26-Dec-2024, Manuscript No. AMSJ-24-15437(R); Published: 30-Dec-2024