Research Article: 2021 Vol: 25 Issue: 5S
Merchants' Intentions and Emotions for Introducing Mobile Payment System - Cases of Japan and Thailand
Ponnapa Musikapun, Muroran Institute of Technology
Tanapun Srichanthamit, Muroran Institute of Technology
Xue Song, Muroran Institute of Technology
Zijie Zhang, Muroran Institute of Technology
and Hidetsugu Suto, Muroran Institute of Technology
Abstract
In this paper, effects of Japanese and Thai merchants' intentions and emotions on introducing mobile payment system are discussed. Because of the different of cultural characteristic may impact to the acceptance technology, we conducted and compared two cases of Thailand and Japan. First, UTAUT was extended by introducing emotions as constructs, and compared Thai cases and Japanese cases. Then we compared the emotions of merchants of Japanese and Thai. The results show (1) Japanese merchants’ decisions about introducing mobile payment systems are affected by only positive social influences, but Thai merchants’ decisions are affected by positive social influences and negative social influences as well as facilitating condition, (2) In Thai, participants who are using mobile payment systems have more positive emotions than participants who are not suing them. Meanwhile, most Japanese participants have neutral emotions for introducing mobile payment systems. Moreover, we found the emotion between the group of merchants who use and do not use mobile payment systems in shops has a significant difference in Japan and Thailand.
Keywords
Mobile Payment, Unified Theory of Acceptance & Technology, Plutchick’s Emotion Model
Introduction
Mobile payment is the activity to payments for goods, services, and bills by using mobile device with the benefit of wireless and other communication technology (Dahlberg, Guo & Ondrus, 2015). In the process of mobile payment, a customer transfers money to a merchant by using the mobile payment system of a service provider. Then, three main actors, i.e., customers, merchants, and service providers are there in the mobile payment system.
For the popularity of using mobile payment, almost 2 million merchants in Thailand used the standardized QR Code (Quick Response Code) in 2018 (Bank of Thailand, 2018). In 2017, the value treated by mobile payment was around 9,014.19 billion THB (around 2,704 billion JPY) (Bank of Thailand, 2017). While, in 2017, the mobile payment market size in Japan was around 1,025 billion JPY (Yano Research Institute., 2018). It is only about 1/3 of Thailand despite many promotions of the Japan.
Generally, the acceptance of technology in each country is different, for example, MP3 and internet banking in Korea and U.S (Im, Hong & Kang, 2011) mobile shopping apps in India and USA (Chopdar, Korfiatis, Sivakumar & Lytras, 2018). The interestingness is what are the key factors of acceptance new technology in each country. For the one reasons of acceptance the mobile payment system (Karsen, Chandra & Juwitasary, 2019) reviewed fifty-four literature research. They found forty-four in the design and development of mobile payments for human use. One of top five in these critical factors is social influence. However, social influence can be divided into positive and negative social influences, such as the study of Muchnik, Aral & Taylor (2013), who found positive and negative social influence on a social news aggregation website. Moreover, Verkijika (2020) studied the affected and responses of acceptance of mobile payment systems. The result of respondents showed that the emotional also effect of mobile payment acceptance.
In this paper, effects of Japanese and Thai merchants’ intentions and emotions on introducing mobile payment system are discussed. In order to analyze the feelings of merchants, we employed two strategies; (1) extending a traditional model for analyzing new technology adaptions by introducing emotions, (2) comparing emotions between Japanese cases and Thai cases. Questionnaire surveys were conducted in Japan and Thailand, and the results were used for the analyses.
Literature Review
Acceptance of New Technologies
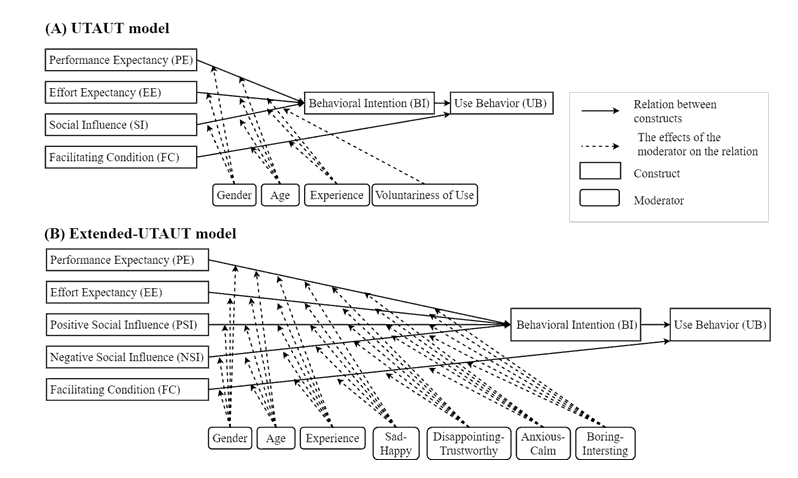
Venkatesh, Morris, Davis & Davis (2003) proposed the Unified Theory of Acceptance and Use of Technology Model (UTAUT model) for presenting factors of new technology acceptance based on eight previous models such as the Theory of Reasoned Action (TRA), the Technology Acceptance Model (TAM), and the Theory Of Planned Behavior (TPB). The results of experiments show that R-square, a goodness of fit index of the UTAUT model is 69% while the R-squares of the traditional models are from 17% to 53% (Venkatesh et al., 2003). Figure 1 (A) shows the structure of the UTAUT model. In these figures, each box stands for a construct, and each solid arrow stands for a relation between two constructs. And each solid arrow stands for a relation between two constructs. Each rounded box stands for a moderator and each dashed line stands for the effects of the moderator on the relation.
The model has four core constructs, Performance Expectancy (PE), Effort Expectancy (EE), Social Influence (SI) and Facilitating Conditions (FC) which affect the Behavioral Intention (BI) and Use Behavior (UB). In the model, PE means the degree to which a person believes that using the systems can help them to improve his/her work performances. EE means the degree to which a person thinks that using the system is easy. SI means the degree to which a person believes that the dominant others think he/she should use the system. FC means the degree to which a person believes that there are some support frameworks to use the systems. Gender, age, experience and voluntariness of use are the moderators regulating the relations between the four main constructs, behavioral intention and use behavior.
Emotions and Acceptance of New Technologies
Liébana-Cabanillas, Sánchez-Fernández & Muñoz-Leiva (2014) analyzed the relationships between several factors and intention to use a payment system called Zong, which is used in virtual social network systems. Then they created mathematical models based on the Theory of Reasoned Action (TRA) and Technology Acceptance Model (TAM), and compared the experts’ case and the others’ case. The model involves an emotion of “trust” as a component, and found that external influences effect trust and it effects on ease of use in the case of inexperienced users. They also focused on an emotional factor but they used only one kind of emotion, “trust”.
Jung, Kwon & Kim (2020) also focused on the relation between emotion of “trust” and mobile payments acceptance. They surveyed the motivations and obstacles of accepting mobile payment services in the U.S. They created a model based on UTAUT model, and added emotion of “trust” as a factor, and analyzed the model. As a result, they found that “trust” effects on behavioral intention.
Partala & Saari (2015) used emotions to investigate user experiences that affect technology adoptions. The participants of the study were given an electronic device, e.g. tablet and e-reader, and were observed the adaptions. Then the participants were divided into two groups: success to adapt and the other is failing to adapt. The two groups were compared by using a model developed based on TAM. The model involves emotions, ten positive ones, and ten negative ones, as components for understanding the users’ feelings in technology adoptions. They found that the group of success to adapt has positive emotions and another group has negative emotions. The results suggest that emotions affect the decision to continue to use new technologies.
From the Partala & Saari's study, we can assume that emotions are important factors for understanding new technologies’ acceptances. Thus, the authors also focus on emotions. However, Partala & Saari’s study studied about the new device for the personal. In this study, the introducing mobile payment system in shop that mean the introducing new system of mobile payment for the business in their shop. In order to make the decision to use new system in term of personal or business, the factors and emotions can effect to choosing the system to use.
In this study, merchants’ internal emotions are discussed, meanwhile, images of others were discussed in Partala & Saari’s study. Moreover, for the previous studies, the emotions was used for considered as independent variable effect to dependent variable (Partala & Saari, 2015). But in this study, we had concern about the effect of emotion on the relationship between independent variable and dependent variable.
Model of Emotion
Generally, a human has various emotions. In order to classify an emotion, Plutchik & Kellerman (2013) established the model for representing the nature of emotions. The model included positive and negative emotions. All emotions were grouped into eight sectors. The eight sectors are corresponding to eight basic emotions: joy, trust, fear, surprise, sadness, disgust, anger, anticipation. All emotions arrange in the circle as the wheel of emotions and indicate as four pairs of opposites. In this way, the whole space of emotions is represented. In this paper, four evaluation axes consisted of the eight emotions are used for representing users’ emotions for using mobile payment systems.
Research Methodology
The goal of this study is to investigate effects of merchants’ emotions on the decision of introducing mobile payment systems. First, the UTAUT model is extended to represent the merchants’ emotions for introducing mobile payment systems. Then, questionnaire items are designed based on the extended UTAUT model and the surveys are conducted. Finally, the effects are represented by using the extended UTAUT model for each country and discussed.
Extended-UTAUT Model
UTAUT model is a kind of model created by using Structural Equation Modelling (SEM). SEM is a statistic method that used to test the relationships between variables. By using the models, we can analyze relationships between observed variables and phenomena (Civelek, 2018). SEM can show the correlation between the independent variable and dependent variable. In this research, the relationships between ideas for mobile payment system and the introducing are analyzed by using SEM.
To represent acceptances of mobile payment systems, we have proposed a model based on the UTAUT model. We named it as Extended-UTAUT model (Song, Lian, & Suto, 2019). Figure. 1 (B) shows the structure of the Extended-UTAUT model. In the original UTAUT model, SI stands for how people around the subject expect that he/she should use the new technology; usually, it affects positively.
The social influence is included the positive and negative social influence. The positive social influence can affect to the positive results. While the negative social influence can effect to the negative results. From previous studies, Subaramaniam, Kolandaisamy, Jalil & Kolandaisamy (2020) analyzed the positive and negative impacts of using E-wallets to users. E-wallet is a software application for managing money on mobile. The convenience, access to new rewards, help to control the budget, can apply to pay money for other services and high availability for the positive impact results. For the negative impact results are technical problems, some of the E-wallet cannot worldwide, security risks and reckless spending habits. Akram & Kumar (2017) studied about the positive and negative effects of social media on society. For the positive influence, social networks have an invaluable. While the negative social influence can effect to a number of risks associated with the online communities.
In the case of introducing mobile payment systems, negative influences also exist. For example, if a problem happens in the mobile payment system, we get negative images for the system. Therefore, the SI is divided into two categories: positive social influence and negative social influence. Then, the Positive Social Influence (PSI) and Negative Social Influence (NSI) were added as in the core construct of the Extended-UTAUT model. In order to understand the effects of emotions on the relationships between two factors, emotion factors are added to the model as moderator variables. Plutchik’s wheel of emotions (Plutchik & Kellerman, 2013) is used for the space of emotions, and four pairs of emotions, Sad-Happy, Disappointing-Trustworthy, Anxious-Calm, and Boring-Interesting are used. The construct of “Voluntariness of use” is eliminated because usually merchants use mobile payments voluntary rather than mandatory (Morris & Venkatesh, 2000) and we use it for measured as an “Experience” by considering the activity of use and do not use mobile payment system in shop. In our model, we measured the experience by considering the activity of use and do not use mobile payment system in shop.
Design Questionnaire and Survey
In order to obtain data for representing the effects the of emotions on merchants’ decisions by using the model, a questionnaire survey was conducted. Informed consents were conducted followed by the surveys. In the informed consents, the purposes of the survey were given to the participants. Then we explained that the data are handled anonymously and used only for academic research. Furthermore, we explained that they can stop the survey anytime if they want. Then only the participants who can agree to the instructions have joined the survey by their own decisions. The questionnaire items can be divided into three groups; demographic information, ideas for mobile payment system, and emotions for mobile payments.
(1) Demographic information: The items of questionnaires for asking demographic information are (1) Gender (Male or Female), (2) Age, and (3) Are any mobile payment systems introduced? If you introduced it, how long have you been using it? (Yes or No, ...year ...month).
(2) Ideas for mobile payment system: Question items in this group are designed based on the study of the original UTAUT model (Viswanath. 2003). There are nineteen questionnaire items for asking ideas for mobile payment systems. Participants answered by using five points Likert scale from strongly disagree to strongly agree.
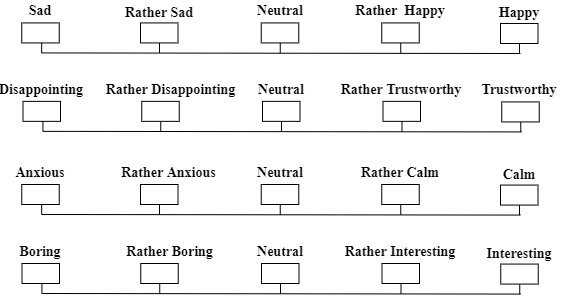
(3) Emotions for mobile payments: The four items in Fig. 2 were used for asking merchants’ emotions to introduce mobile payment in the shops. These items are decided based on Plutchik’s wheel of emotions (Plutchik, & Kellerman, 2013). The participants answered the items by using a five-point Likert scale. Figure 2 shows an example of the part of sheet of questionnaire sheet.
| Table 1 Question Items |
|||
|---|---|---|---|
| Observed Variable | Item No. | Question | |
| UTAUT | Extended-UTAUT | ||
| PE | 1 | I think the introduction of mobile payments in the shop will make work more convenient. | |
| 2 | I think the introduction of mobile payments will help to finish the job quickly. | ||
| 3 | Introducing mobile payments can save the time of changing cash. | ||
| 4 | Introducing mobile payments can reduce my tasks. | ||
| EE | 5 | It’s easy for me to become skillful of using mobile payment. | |
| 6 | Learning to operate mobile payments is easy for me. | ||
| SI | PSI | 7 | People who influence my behavior recommend that you should use mobile payments. |
| 8 | I want to be a leader in introducing mobile payments. | ||
| 9 | I will use mobile payment if my competitors use it. | ||
| NSI | 10 | Providing personal information to mobile payment systems is dangerous. | |
| 11 | Mobile payment systems are likely high problems. | ||
| FC | 12 | I have the necessary equipment to introduce mobile payments. | |
| 13 | I have the necessary knowledge to introduce mobile payment. | ||
| 14 | I have taken guidance to start a mobile payment service. | ||
| 15 | Mobile payments can be used in combination with other payment services. | ||
| BI | 16 | I want to use mobile payments. | |
| 17 | I plan to use mobile payments in the near future. Or, continue to use it in the future. | ||
| UB | 18 | I want customers to use mobile payments. | |
| 19 | I would recommend mobile payments to the people around me. | ||
Research Results
The questionnaires survey was conducted by the method described as show in Table 2. In this survey, the targets are owners of permanent and non-permanent small shops in Japan and Thailand. Questionnaire items were translated into Japanese and Thai, and used in the surveys in each country. The questionnaire was first developed in Japanese before being translated into Thai. In order to confirm the equivalence of meaning of items in questionnaire between Thailand and Japan, the translation was reviewed by a third party (Japanese and Thai). The survey was conducted from 1 August, 2020 to 30 March, 2021. 269 Japanese and 273 Thai data were obtained. The total number of collecting data in Japan of the paper questionnaire, post mail, facsimile and online questionnaire are 202, 51, 14 and 2, respectively. For Thailand, we collected all 273 data by using a paper questionnaire.
Table 3 shows the results of questions about demographic profile. In Japan, 48.33% of shops had used a mobile payment system. The terms of using it are from 10 years 5 months to 1 month, and the average is 9.78 months. In Thailand, 78.75% of shops had used a mobile payment system. The terms of using it are from 7 years to 3 months, and the average is 19.01 months.
| Table 2 Demographic Information |
||||
|---|---|---|---|---|
| Demographic Information | Japan (n=269) | Thailand (n=273) | ||
| Total number | Percentage | Total number | Percentage | |
| Gender | ||||
| Male | 165 | 61.34% | 119 | 43.59% |
| Female | 104 | 38.66% | 154 | 56.41% |
| Generation (Ting, Lim, de Run, Koh & Sahdan, 2018) | ||||
| Post-war cohort (75-94 years old) | 13 | 4.83% | 0 | 0.00% |
| Baby boomers (56-74 years old) | 109 | 40.52% | 8 | 2.93% |
| Generation X (44-55 years old) | 79 | 29.37% | 28 | 10.26% |
| Generation Y(26-43 years old) | 65 | 24.16% | 217 | 79.49% |
| Age below than 26 years old | 3 | 1.12% | 20 | 7.33% |
| Are any mobile payment systems introduced? | ||||
| Yes | 130 | 48.33% | 215 | 78.75% |
| Maximum | 125 months | .84 months | ||
| Minimum | 1 months | 3 months | ||
| Average | 9.78 months | 19.01 months | ||
| Use around 1 year | 48 | 36.92% | 130 | 60.47% |
| Use around 1 - 2 year | 47 | 36.15% | 48 | 22.33% |
| Use over 2 years | 35 | 26.92% | 37 | 17.21% |
| No | 139 | 51.67% | 58 | 21.25% |
| Introducing mobile payment in each generation | ||||
| Yes | ||||
| Post-war cohort (75-94 years old) | 5 | 38.46% | 0 | 0.00% |
| Baby boomers (56-74 years old) | 36 | 33.03% | 7 | 87.50% |
| Generation X (44-55 years old) | 47 | 59.49% | 20 | 71.43% |
| Generation Y(26-43 years old) | 40 | 61.54% | 168 | 77.42% |
| Age below than 26 years old | 2 | 66.67% | 20 | 100.00% |
| No | ||||
| Post-war cohort (75-94 years old) | 8 | 61.54% | 0 | 0.00% |
| Baby boomers (56-74 years old) | 73 | 66.97% | 1 | 12.50% |
| Generation X (44-55 years old) | 32 | 40.51% | 8 | 28.57% |
| Generation Y(26-43 years old) | 25 | 38.46% | 49 | 22.58% |
| Age below than 26 years old | 1 | 33.33% | 0 | 0.00% |
Validity of Extended-UTAUT Model
The goodness of fit indices are used for checking the validity of UTAUT and Extended-UTAUT model. The Extended-UTAUT model is better to analyze the intention of using a mobile payment system than the UTAUT model because every factor has better value than internal consistency criteria, as shown in Table 3. The UTAUT and Extended-UTAUT model have the same Cronbach alpha value of PE, EE, FC, BI, and UB; the values are 0.913, 0.921, 0.875, 0.919, and 0.929. Cronbach alpha of SI for the UTAUT model is 0.817. And Cronbach alpha of PSI and NSI for the extended model are 0.886 and 0.847, respectively.
| Table 3 The Comparison of Goodness of Fit Indices |
|||
|---|---|---|---|
| Goodness of Fit Index | Criteria | UTAUT | Extended-UTAUT |
| x2 | 931.116 | 547.554 | |
| df | 141 | 136 | |
| x2/df | 2-5 | 6.60 | 4.03 |
| Root Mean Squared Residuals (RMR) | <0.05 | 0.056 | 0.04 |
| Standard Root Mean Square Residual (SRMR) | <0.05 | 0.55 | 0.031 |
| Tucker-Lewis index (TLI) | >0.9 | 0.903 | 0.948 |
| Normal Fit Index (NFI) | >0.9 | 0.908 | 0.946 |
| Comparative Fit Index (CFI) | >0.9 | 0.920 | 0.958 |
| Parsimonious Normed Fit Index (PNFI) | >0.5 | 0.748 | 0.752 |
| Parsimonious Goodness-of-Fit Index (PGFI) | >0.5 | 0.635 | 0.644 |
Analysis with Extended-UTAUT
The Extended-UTAUT models shown in Fig 3 were analyzed to investigate the relationship between four independent constructs (PE, EE, PSI, NSI, and FC) and two dependent constructs (BI and UB). Moreover, we find the relationship between two variables depending on the moderator variables (gender, age, experience, sad-happy, disappointing-trustworthy, anxious-calm, and boring-interesting) by using the moderator analysis.
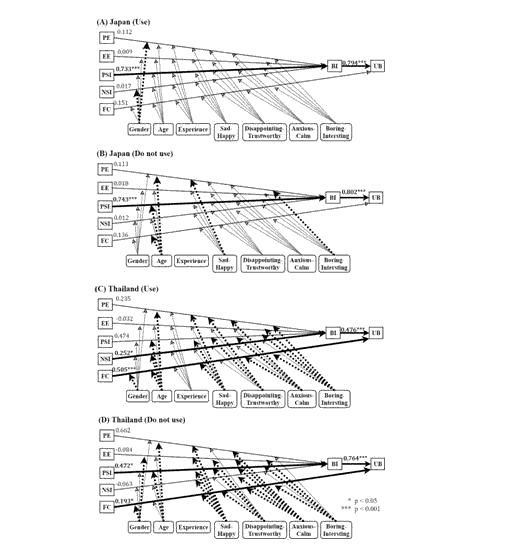
Figure 3 shows the Extended-UTAUT models of Japanese and Thai which are created by using obtained data from the surveys. Each number on an arrow stands for the path coefficient. The bold arrows stand for significant paths. Each path coefficient was calculated by using R (version 1.3.1056), a numerical analysis software with packages, “lavvan” (version lavvan 0.6-7). We consider four cases as follows:
Case A: Japanese merchants who use mobile payment in the shop
Case B: Japanese merchants who do not use mobile payment in the shop
Case C: Thai merchants who use mobile payment in the shop
Case D: Japanese merchants who do not use mobile payment in the shop
The Extended-UTAUT’s results of these four cases are shown in Fig. 3. Figure 3 (A), Fig. 3 (B), Fig. 3 (C), and Fig. 3 (D) show the Extended-UTAUT results of case 1, case 2, case 3, and case 4, respectively. As we can see in Fig. 3 (A), Fig. 3 (B), and Fig. 3 (D), the PSI affects BI in case A, case B, and case D. Both cases C and D show that the FC affects BI for Thai merchants, as shown in Fig 3 (C) and Fig 3 (D). And the NSI affects BI for case C, as shown in Fig. 3 (C).
For the results of Thailand, positive relationship between the NSI and BI, they feel that providing personal information to mobile payment systems is dangerous and they feel mobile payment systems are likely high problem. From the NSI, then the behavior intention of merchant is they need to check more carefully about their information and every time when they transfer money. In order to test the moderator effect, the gender, age, experience, sad-happy, disappointing-trustworthy, anxious-calm and boring-interesting are used to determine the variable that affects the relationship between variables.
Gender effects on the relationship between PE effects on BI for case A. And the relationship between EE effects on BI is affected by gender for case D. Moreover, the gender effects on the relationship between NSI effects on BI is found in case A. And gender also affects the relationship between FC effects on UB in case C and case D. Age affects the relationship between PE effects on BI and PSI effects on BI for cases B, C, and D. The relationship between NSI effects on BI is affected by age for case C. Moreover, age affects the relationship between FC effects on UB for case B and case C. For the experience, case A and case C are considered the effect of experience on the relationship between factors because the merchant already has experience. The results of these two cases show the experience do not affect them.
The emotion of sad-happy, case D shows the results that sad-happy affects every relationship. Only the relationship between PE effects on BI is affected by sad-happy for case B. For case C, sad-happy effect on the relationship between PE effects on BI, PSI effects on BI, and FC effects on UB. Disappointing-Trustworthy affects the relationship between PE effects on BI in case C. The relationship between EE is affected on BI by Disappointing-Trustworthy in case D. While the disappointing-trustworthy affects the relationship between PSI effects on BI in both case C and case D. And the relationship between FC effects on UB is affected by disappointing-trustworthy for case D. The emotion of anxious-calm, case D show the results that anxious-calm affects every relationship. For case C, anxious-calm affects the relationship between PE effects on BI, PSI effects on BI, and FC effects on UB. Case B and case C show that the relationship between PE effects on BI is affected by boring-interesting. For cases C and D, the boring-interesting effects to the relationship between EE effects on BI, PSI effects on BI, and FC effects on UB.
Analysis of Emotions
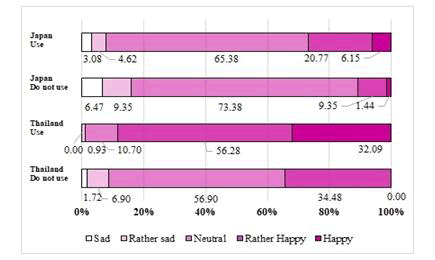
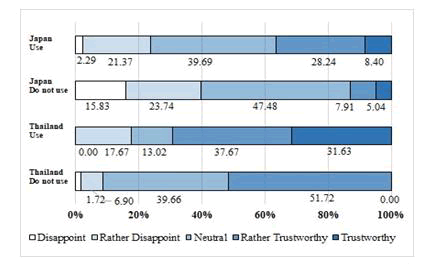
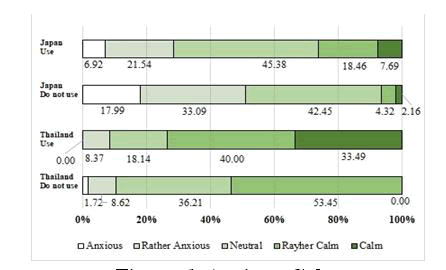
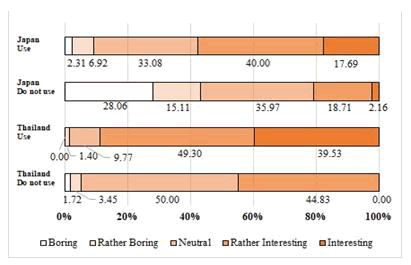
After we found the results of difference between Japan and Thailand in the moderator analysis results. We considered more deeply about the difference of emotions in each country by compare the groups of use and do not use mobile payment in shop in each country. For this study, we concern both of the groups of merchant who use and do not use mobile payment in shop. We want to know the whole image of emotions which effect in both groups of merchants in both countries. However, we showed more how the different between the group of use and do not use mobile payment in shop. The results showed the most of emotion of the between two groups in each country are difference. The graphs in Fig. 4 to 7 show the results of sad-happy, disappointing-trustworthy, anxious-clam, and boring-interesting.
Sad-Happy: The data of participants who are using mobile payments and the data of participants who are not using mobile payments are compared by using the Chi-square test for each country. As the result of the Chi-square test, Japanese data have significant differences (p=0.006). Meanwhile Thai data have significant differences (p=0.000). From the graphs in Fig. 4, we can see that many Japanese do not feel happy or sad about using mobile payment systems irrespective of introducing or not introducing them. Meanwhile, many Thai who have introduced mobile payment systems feel rather happy for using them.
Disappointing-Trustworthy: From the graphs in Fig. 5, we can see that 36.64% of Japanese participants who are using mobile payment systems and 12.95% of the Japanese participants who are not using it answered positively (5 or 4). Meanwhile, 69.30% of Thai participants who are using mobile payment system and 51.72% of Thai participants who are not using it answered positively. It shows that Thai participants trust mobile payment system more than Japanese participants. As the result of the Chi-square test, both of Japanese and Thai data have significant differences (p=0.000). In both of the countries, the participants who are using mobile payment systems tend to trust the system.
Anxious-Calm: From the graphs in Fig. 6, we can see that 26.15% of Japanese participants who are using mobile payment systems and 6.48% Japanese participants who are not using it answered positively. Meanwhile, 73.49% of Thai participants who are using mobile payment system and 53.45% of Thai participants who are not using it answered positively. In addition, 28.46% Japanese participants who are using mobile payment system and 51.08% of those who are not using it answered negatively (1 or 2). Meanwhile, 8.37% of Thai participants who are using mobile payment system and 10.34% Thai participants who are not using it answered negative. These facts show that Japanese participants feel more anxiously about using mobile payment systems than Thai participants obviously. The data of participants who are using mobile payments and the data of participants who are not using mobile payments are compared by using the Chi-square test for each country. As the result of Chi-square test, both Japanese and Thai data have significant differences (p=0.000). Both of Japanese and Thai who are using mobile payment system feel more calmly than the participants who are not using them.
Boring-Interesting: From the graphs in Fig. 7, we can see that 57.69% of Japanese participants who are using mobile payment system and 20.87% of Japanese participants who are not using it answered positive (5 or 4). Meanwhile, 88.83% of Thai participants who are using mobile payment system and 44.83% of Thai participants who are not using it answered positively. It shows that Thai participants have stronger interesting for mobile payment systems than Japanese participants. However, the differences are smaller than the other emotions. As the result of the Chi-square test, both Japanese and Thai data have significant differences (p=0.000). In both of the countries, the participants who are using mobile payment systems tend to have interesting in the system.
From the above results, it is assumed that Japanese merchants have interesting in the mobile payment system, but they feel anxiously to use it. Basically, Japanese merchants feel neutral but Thai merchants feel positive. Thus, it could be a reason for the differences in mobile payment system popularity between the two countries.
Discussion and Conclusion
In this paper, the assumption that merchants’ emotions for mobile payment system affect on the decision to introduce was discussed based on the results of surveys in Japan and Thailand. First, UTAUT model is extended by introducing emotions as constructs. Then questionnaire surveys were conducted in Japan and Thailand, and 269 Japanese data and 273 Thai data were obtained. Extended-UTAUT models were constructed by using Japanese data and Thai data, and they were compared.
For the generation of merchants that use mobile payment in the shop, the Japanese in generation X, generation Y, and the merchants who have age under 26 have a higher percentage of use than do not use mobile payment in the shop. In Japan, the percentage of the merchants who do not use mobile payment in shop are higher than the percentage of the merchants of use mobile payment in shop, these results of Japan in this paper are conform with Chang, Chen & Hashimoto (2021) that cashless on mobile payment is not yet popular in Japan. In contrast, Thai have a higher percentage of use more than do not use in every generation.
Social influence was found the effect on behavior intention from previous studies (de Sena Abrahão, Moriguchi & Andrade, 2016; Khalilzadeh, Ozturk & Bilgihan, 2017; Al-Okaily, Lutfi, Alsaad, Taamneh & Alsyouf, 2020; Al-Saedi, Al-Emran, Ramayah, & Abusham, 2020; Jung, Kwon & Kim, 2020; Patil, Tamilmani, Rana & Raghavan, 2020). However, social influence can be separated into positive social influence and negative social influence (Muchnik, et al., (2019). Then, in this paper, social influence was extended the social influence to positive and negative social influences and tested the effect on behavioral intention. As a result, we found that Japanese merchants’ decisions are affected by only positive social influences. But Thai merchants’ decisions are affected by facilitating condition. Moreover, Thai merchant who use mobile payment in the shop, negative social influence affects behavioral intention. But positive social influence affects behavioral intention in Thai merchants who do not use mobile payment in the shop. Our result consonant with (Kladkleeb & Vongurai, 2019) research that found the social influence effect to behavioral intention for usage of digital payment system. Then, we can be described more about social influence by using positive and negative social influence.
As a result of comparing emotions, we found that groups that do not use mobile payment in shops in both Japanese and Thai have an emotional effect on the relationship more than the group that use mobile payment in the shop. Every emotion can affect the relationship between factors in every group of Thai but only sad-happy and boring-interesting effect on the relationship between factors in Japanese.
For the results of comparing the emotions of Japanese and Thai, we found that emotion could be affected by the popularity of the using mobile payment system in Japan and Thailand. Japanese and Thai merchants of both groups of use and do not use mobile payment in the shop have significant emotions. In Thai, participants who are using mobile payment systems have more positive emotions than participants who are not suing them. Meanwhile, most Japanese participants have neutral emotions for introducing mobile payment systems.
The finding of this paper will help to know the factors of acceptance of mobile payment systems in the shop for merchants in Japan and Thailand. Moreover, we can see that emotions affect the relation between factors and behavioral intention. Because of these differences in the acceptance of new technology in each country and each group of users, the service provider should know and provide a suitable system by pay attention on important factors and emotions of users. The reason that causes the differences is not discussed because it is not the scope of this paper. However, the authors consider it an important point to understand the problem and think of it as future work.
In this paper, we focused on Japan and Thailand as representative economic countries in Asia. However, when we consider the current Asian economic situations, we cannot ignore the situations in China. In the future works, we are planning to conduct the survey in China to compare with other countries.
Acknowledgement
This work was supported by Grant of Hokkaido Development Association.
References
- Akram, W., & Kumar, R. (2017). A study on positive and negative effects of social media on society. International Journal of Computer Sciences and Engineering, 5, 351-354.
- Al-Okaily, M., Lutfi, A., Alsaad, A., Taamneh, A., & Alsyouf, A. (2020). The determinants of digital payment systems’ acceptance under cultural orientation differences: The case of uncertainty avoidance. Technology in Society, 63, 101367.
- Al-Saedi, K., Al-Emran, M., Ramayah, T., & Abusham, E. (2020). Developing a general extended UTAUT model for M-payment adoption. Technology in Society, 62, 101293.
- Bank of Thailand. (2017). e-Payment.
- Available online: https://www.bot.or.th/App/BTWS\STA Tstatistics/BOTWEBSTAT.aspx?reportID=690\&lang-uage=TH (accessed on 14 10 2020).
- Bank of Thailand. (2018). Standardized QR Code in Thailand.
- Available online: https://www.bot.or.th/Thai/AboutBOT/Activities/event/Documents/ADBI\_bancha.pdf (accessed on 14 10 2020).
- Chang, W.L., Chen, L.M., & Hashimoto, T. (2021). Cashless Japan: Unlocking influential risk on mobile payment service. Information Systems Frontiers, 1-14.
- Chopdar, P.K., Korfiatis, N., Sivakumar, V.J., & Lytras, M.D. (2018). Mobile shopping apps adoption and perceived risks: A cross-country perspective utilizing the Unified Theory of Acceptance and Use of Technology. Computers in Human Behavior, 86, 109-128.
- Civelek, M.E. (2018). Essentials of structural equation modeling. Essentials of Structural Equation Modeling.
- Dahlberg, T., Guo, J., & Ondrus, J. (2015). A critical review of mobile payment research. Electronic Commerce Research and Applications, 14(5), 265-284.
- de Sena Abrahão, R., Moriguchi, S.N., & Andrade, D.F. (2016). Intention of adoption of mobile payment: An analysis in the light of the Unified Theory of Acceptance and Use of Technology (UTAUT). RAI Journal of Administration and Innovation, 13(3), 221-230.
- Im, I., Hong, S., & Kang, M. S. (2011). An international comparison of technology adoption: Testing the UTAUT model. Information & management, 48(1), 1-8.
- Jung, J.H., Kwon, E., & Kim, D.H. (2020). Mobile payment service usage: US consumers’ motivations and intentions. Computers in Human Behavior Reports, 1, 100008.
- Karsen, M., Chandra, Y.U., & Juwitasary, H. (2019). Technological factors of mobile payment: A systematic literature review. Procedia Computer Science, 157, 489-498.
- Khalilzadeh, J., Ozturk, A.B., & Bilgihan, A. (2017). Security-related factors in extended UTAUT model for NFC based mobile payment in the restaurant industry. Computers in Human Behavior, 70, 460-474.
- Kladkleeb, S., & Vongurai, R. (2019). factors influencing adoption and actual usage of digital payment systems in the era of Thailand 4.0 For Thai Society. UTCC International Journal of Business and Economics, 11(3), 117.
- Liébana-Cabanillas, F., Sánchez-Fernández, J., & Muñoz-Leiva, F. (2014). The moderating effect of experience in the adoption of mobile payment tools in Virtual Social Networks: The m-Payment Acceptance Model in Virtual Social Networks (MPAM-VSN). International Journal of Information Management, 34(2), 151-166.
- Morris, M.G., & Venkatesh, V. (2000). Age differences in technology adoption decisions: Implications for a changing work force. Personnel psychology, 53(2), 375-403.
- Muchnik, L., Aral, S., & Taylor, S.J. (2013). Social influence bias: A randomized experiment. Science, 341(6146), 647-651.
- Partala, T., & Saari, T. (2015). Understanding the most influential user experiences in successful and unsuccessful technology adoptions. Computers in Human Behavior, 53, 381-395.
- Patil, P., Tamilmani, K., Rana, N. P., & Raghavan, V. (2020). Understanding consumer adoption of mobile payment in India: Extending Meta-UTAUT model with personal innovativeness, anxiety, trust, and grievance redressal. International Journal of Information Management, 54, 102144.
- Plutchik, R., & Kellerman, H. (Eds.). (2013). Theories of emotion, 1. Academic Press.
- Song, X., Lian, J., & Suto, H. (2019). A model for representing relationships between users’ mental factors and behaviors on mobile payments, Symposium on Life oriented Software 2019, Hokkaido, Japan, 23-24 November 2019.
- Subaramaniam, K., Kolandaisamy, R., Jalil, A., & Kolandaisamy, I. (2020). The impact of E-Wallets for current generation. Journal of Advanced Research in Dynamical and Control system,12, 751-759.
- Ting, H., Lim, T.Y., de Run, E.C., Koh, H., & Sahdan, M. (2018). Are we baby boomers, Gen X and Gen Y? A qualitative inquiry into generation cohorts in Malaysia. Kasetsart Journal of Social Sciences, 39(1), 109-115.
- Venkatesh, V., Morris, M.G., Davis, G.B., & Davis, F.D. (2003). User acceptance of information technology: Toward a unified view. MIS quarterly, 425-478.
- Verkijika, S. F. (2020). An affective response model for understanding the acceptance of mobile payment systems. Electronic Commerce Research and Applications, 39, 100905.
- Yano Research Institute. (2018). Mobile payment market in Japan: Key Research Findings 2018. Available online: https://www.yanoresearch.com/en/press-release/show/press_id/2031 (accessed on 14 10 2020).
