Research Article: 2025 Vol: 29 Issue: 1
Meeting Channel Partner Expectations: A Transportation Model for Cement Distribution in India
Praful Vijay More, NMIMS (Deemed-to-be-university)
Ashu Sharma, NMIMS (Deemed-to-be-university)
Citation Information: Vijay More, P., & Sharma, A. (2025). Meeting channel partner expectations: A transportation model for cement distribution in India. Academy of Marketing Studies Journal, 29(1), 1-8.
Abstract
This paper describes an optimization-based transportation model developed for tactical supply chain planning for channel partners of a large cement-making company in India with a geographically wide distribution network. Cement is essential in the construction industry as it is the principal binding agent. In today’s scenario, channel partners prefer direct deliveries to sites when the daily volumes increase. This paper explores the expectations of channel partners concerning supplies of cement. The results show that the channel partners in the cement industry have considerations for minimum lot size, direct deliveries at the site, minimum damages, best quality, and timely delivery. Furthering this analysis, the Vogel approximation method (VAM) approach for optimal transportation has resulted in balancing supplies and demand with channel partners and determining optimal transportation schedules. The transportation model has demonstrated improvement in the planning of logistics compared to the traditional approach in the cement industry from an Indian perspective.
Keywords
Cement Industry, Transportation model, Channel Partners, VAM, Optimization.
Introduction
To better comprehend the organization of the Indian cement business, its characteristics must be explained. After being stripped of its license in 1991, India's cement sector has experienced impressive expansion (Aizawa, T. Kawano, 2002). India has overtaken China as the second- largest cement-producing nation in the world. The building material industry's most significant and lucrative product is cement, which India will consume 600 million tonnes by 2020. With a CAGR of 5.51% during the projected period, India's total cement production is anticipated to increase from 277.61 million tonnes in 2022 to 404.11 million tonnes by 2029. The cement manufacturers include Ambuja Cement, Ultratech Cement, J K Cement, ACC Cement, and Shree Cement.
Given its low value, high bulk, and high freight costs, cement's landing cost is significantly influenced by these characteristics. High transportation costs are hurting the cement industry's ability to compete. Seventeen percent of the cost of production is freight. For travel lengths under 250 km, the road is the favored means of transportation. However, due to inadequate rail infrastructure, industry primarily relies on roadways. Because it is cost-effective, rail transportation is the best method for moving coal, clinker, and cement. Because of this, the production and distribution of cement are negatively impacted by railway transportation bottlenecks or inadequacies.
The competitive radius of a typical cement plant for most common types of cement extends no more than 300 kilometers. Thus, the location of a cement plant and the cost to transport the cement it produces through its distribution terminals significantly affect the plant’s competitive position and the prices it may charge (Annexure 1). Cement is a sensitive product, and even slight moisture may damage it quickly; handling always remains an issue at construction sites. Supplies have two aspects, namely handling and transportation. Transportation has two categories: primary transportation from factory to warehouses and secondary transportation from warehouse to stockist/consumer. An ideal situation for a channel partner is that his ordered quantity should be delivered at the site at the desired time. As per industry norms, the price is charged on a Free on Road (FOR) basis only; thus, there remains no additional cost of transportation. This makes the transaction more viable for the channel partner. This industry, as such, is logistics-driven; so much depends on the strength of logistics. The places near the plants are the actual beneficiaries, as in far-off places, a lot of material is moved primarily through rakes, and secondary movement is done after transshipment. This involves handling as well as requires more lead time.
In this paper, we formulate a Transportation Model from the data collected from around 100 channel partners concerning cement transportation from different suppliers to different destinations in Jaipur. To avoid bias in the research, data is collected from the top 10 players in the Indian cement industry. The model considers transportation costs and numerous practical constraints along with calculations of primary transport allocation and mode selection from plants to warehouses as well as warehouses to stockist /construction sites, inventory stocking at warehouses, and secondary transport allocation between warehouses and stockist/construction sites. The sizes of the sites vary from small individual houses to big construction sites. This model is useful even for budget and financial planning of transportation costs.
Literature Review
Determining efficient solutions for large-scale transportation problems is essential in operations research. This study investigated Vogel’s Approximation Method (VAM), one of the well-known transportation methods in the literature, to obtain more efficient initial solutions. (Gujjula et al., 2011). A VAM variant was proposed using total opportunity cost and alternative allocation costs. Computational experiments were carried out to evaluate VAM (Korukoğlu & Ballı, 2011). A study by Loch & Silva (2014) indicated that the Least Cost Method (LCM) and Vogel's approximation method (VAM) were the most suitable strategies for the optimization of transportation problems. This research considerably helped the optimization of transportation cost estimations in many circumstances. Further, Abioye et al. (2019) proposed the notion of employing transportation problems to determine the most cost- effective ways of moving goods from distinct supply sources to different demand destinations. Bera & Mondal (2020) proposed a computer-based method for tackling transportation-related problems. They observed that manual computations using current techniques got more time- consuming as the number of variables increased. Consequently, installing mathematical software to automate computations proved to be a substantial time-saving technique. This finding underscored the need to utilize technology in addressing complicated transportation challenges, expediting the process, and eventually decreasing total expenses. Verma & Puri (2022) did a comparative analysis of several strategies for addressing transportation difficulties. They agreed that no single strategy could provide the most optimum answer for all transportation issue circumstances. Overall, the studied literature indicated the continual development and improvement of approaches and models for tackling transportation challenges. These studies have offered useful insights into finding cost-effective shipping options and have highlighted the potential for technology developments to further optimize the transportation business.
The studies related to the optimization of transportation problems using VAM were reviewed for further analysis. Table 1 summarizes the contribution of the previous studies pertaining to the application of VAM for transportation problem optimization.
| Table 1 Review of Literature Using Vam for Solving the Transportation Problem | ||||
| S. No | Author (Year) | Methodology Used | Contribution | Country |
| 1 | Krishan and Masrom (2022) | VAM | This study examines the impact of uncertainty connected to unit delivery costs on the company's overall freight costs by carrying out sensitivity analysis and emphasizing optimum delivery costs by fulfilling demand without exceeding the maximum capacity of the petrochemical plant. |
Malaysia |
| 2 | Hussein and Shiker | VAM in combination with the Improved Basic Feasible Solution (IBFS) |
This study technique generated findings that were extremely near to the optimal solutions, as proved by many solved numerical examples. |
Iraq |
| 3 | Askerbeyli (2020) | VAM | The major purpose of this study was to analyze and explore approaches to lower the overall transportation costs connected with the completed goods made by Alter Iron and Steel Industrial Company at its manufacturing site situated in Karabuk. |
Turkey |
| 4 | Jain et al. (2020) | VAM | This study aimed to find schedules for carrying commodities from source to destination in a manner that optimizes transportation costs while fulfilling supply and demand constraints. |
India |
| 5 | Nahar et al. (2018) | VAM | This study was undertaken to examine the initial solution that can be adopted and test the optimal solution if the VAM approach can generate savings or cost efficiency in rice distribution. |
Indonesia |
| 6 | Iheonu and Inyama | VAM | This study claims to have addressed genuine economic difficulties via the construction of transportation scheduling models for the Company's plants in Owerri, Port-Harcourt and Enugu. |
Nigeria |
There is extensive literature on transportation methods. Most papers discuss the comparison of various methods and applications to various industries. Some papers explain algorithms and programming of transportation modelling for optimization. Only a handful of papers discuss optimizing cost using the transportation model. This paper explains how the transportation model is applied to optimize the network, volume, and cost of cement transportation for channel partners in the cement industry from an Indian perspective.
Methodology
Logistics Model
The model shown below clearly depicts that the cement industry has a very flexible network to manage the inventory requirement when it arises. The interlinkages between channel partners are so strong that demand with any channel partner can be satisfied Just-in-time. It is always viable for the companies to manage inventory B2C as the smaller chain would lead to reduced cost of transportation as add-on margins in the network would not be added.
The Mathematical Model
Transportation problems need an initial basic feasible solution to obtain the optimal solution (Shafaat et al. 1988). The purpose is to minimize the cost of transporting goods from one location to another so that each channel partner and customer's demand is met and every source operates within its capacity. The linkage between inventory and transport planning is critical to reducing the operational cost of distribution. Various methods are available to solve the transportation problem to obtain an optimal solution (Intrator, 1989). Typical transportation methods include “North-West Corner” Method, "Least Cost Entry Method" , "VAM - Vogel's Approximation Method" (Reinfeld et al., 1958; Balakrishnan, 1990). VAM is a heuristic model and provides a better initial basic feasible solution than other methods (Goyal, 1984). VAM generally yields an optimum or close to optimum solution for small-sized transportation problems. The table below shows the quantity available with the cement suppliers per month (Table 2).
| Table 2 The Quantity Available with the Cement Suppliers Per Month | |||
| Source | Quantity Available (Bags) | Destination | Demand (Bags) |
| 1 | 985000 | 1 | 250000 |
| 2 | 300000 | 2 | 200000 |
| 3 | 175000 | 3 | 150000 |
| 4 | 140000 | 4 | 1000000 |
Formulation of Mathematical Model
The table below shows demand and supply with unit transportation costs formulating the transportation problem (Table 3).
| Table 3 Demand and Supply with Unit Transportation Costs | ||||||
| Destination 1 | Destination 2 | Destination 3 | Destination 4 | |||
| Warehouse | Dealer | Retailer | Customer | Supply | ||
| Source 1 | Factory | 18.00 | 19.50 | 21.00 | 22.00 | 985000 |
| Source 2 | Warehouse | M | 25.00 | 25.75 | 26.00 | 300000 |
| Source 3 | Dealer | M | M | 30.75 | 29.50 | 175000 |
| Source 4 | Retailer | M | M | M | 35.75 | 140000 |
| Demand | 250000 | 200000 | 150000 | 1000000 | ||
*Demand and Supply are mentioned as an average of top industry players quantified in bags/month.
**Unit transportation cost is mentioned per bag per month.
***The restricted transportation positions are allocated an enormous cost represented by M
Findings
Vogel Approximation Method
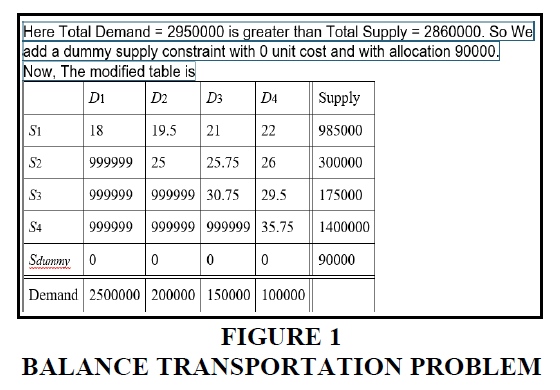
The table below shows demand and supply with unit transportation costs formulating a balanced transportation problem (Figure 1).
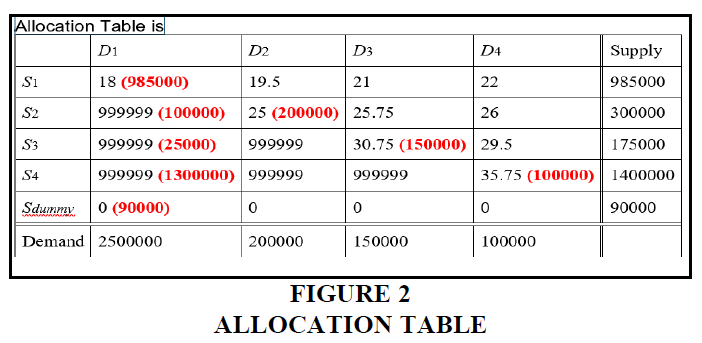
The table below shows demand and supply with unit transportation costs along with allocations (Figure 2).
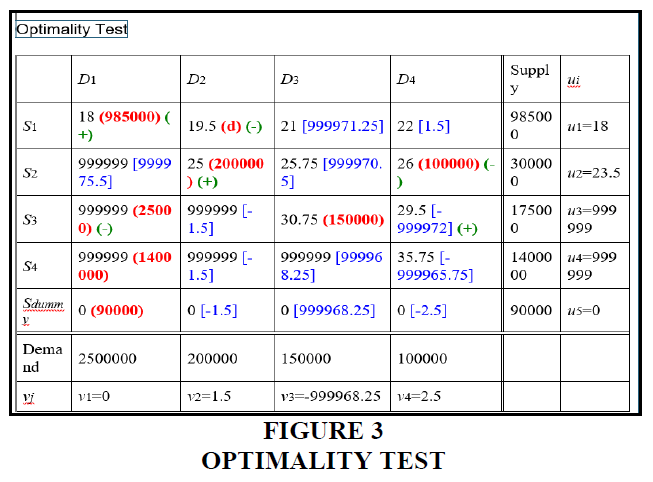
The Figure 3 shows demand and supply with unit transportation costs along with optimality.
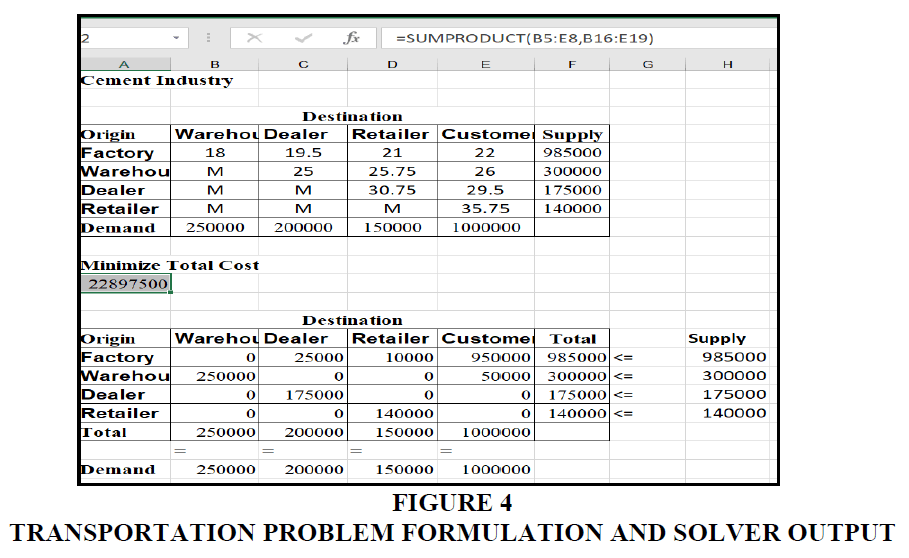
From the Vogel Approximation Method (Gass, S.I., 1990), we find the number of allocations that are same as m+n-1. Therefore, we get a total transportation cost of Rs.37,987,500 for 16,00,000 bags. Therefore, the average cost of transportation per bag is Rs 23.74. The model further explains the movement of supplies from sources to destinations and suggests that it is more viable if the inventories reach the customer directly from any source (Figure 4).
Solver Solution
The model indicates that the best method is direct deliveries at the consumption site. The analysis was done in Jaipur city, where the minimum lot size was found to be 50 bags FOR. The volumes are too high; most of it is supplied in normal bags of 50 kgs. It was observed that multi-locational godowns are necessary to service 50 bags customers directly. If the channel partner, be it a dealer or retailer, gets any order of less than this quantity, they need to dispatch it from their stock, in which there is always an additional cost of transportation and handling. Direct deliveries from the warehouse to the customer reduce the damage. Though it is mentioned on the bags that no hooks should be used in handling the cement bags, as a practice, hooks are always used in the market in each operation. Once the material reaches directly from the factory, there is no handling in between, so there is no pilferage of material due to handling. Timely delivery from the plant and warehouse is vital to customer relations and costs. In case of supply delay, the customer pushes the channel partners to give some material at least to keep the work going. It involves additional costs due to transportation and handling of material from the channel partner’s godown to the construction site. It is evident from the market that only those prominent cement companies with their plants within the state are prominent. The primary raw material coal is available only in four or five states across India, mainly in the eastern region.
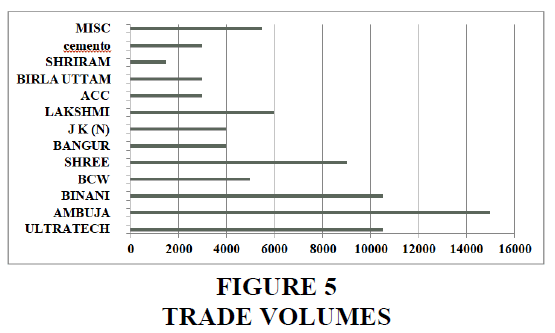
Due to the specific nature of the cement industry, cement plants are concentrated in limestone deposits available in a few states across India. Such companies are Ultratech, Ambuja, ACC, Shree, Bangur, Binani, Cemento, JK(N), Lakshmi, BCW, Manglam, Shriram etc. The latest entrant is Koramandal cement. This brand of India cement is very prominent in the south but entered this market only after it started manufacturing in this state. Another brand, Lafarge, an international player, is putting up its plant in the state and cannot bring the material from other states to this place. Jaypee is another example of having its capacities in nearby states like Gujarat and Haryana but can still not make a significant presence in this market. The following graph shows the Trade volumes in Metric Tonnes (MT) for almost all Jaipur cement industry players, totaling approximately 80000 MT (Figure 5).
It is observed that the most prominent companies in trade are Ultratech, Ambuja, Binani, and Shree, and one of the reasons, apart from their quality, price, and policies, is having multiple warehouses spread in the city. None of these companies have less than four warehouses in Jaipur city to conveniently deliver the material within a minimum lead time. The best way to deliver the material by any company is to deliver it directly from the plant to the customer site, but the same is not possible due to the lot size requirement by most of the sites in the trade segment. The minimum lot size from plant to consumer is 400 bags at a time, and the number of such customers is much less. The following best method is to supply from warehouse to customer. This involves the minimum cost component in the desired lot. To remain competitive, all players must execute 50 bag orders FOR in the most reasonable time. Typically, construction sites require material in the morning hours, so if companies use more oversized vehicles and do order clubbing, it is not easy to deliver to all the customers on time. Also, no entry of vehicles in maximum areas most often makes the operations viable only through the smaller vehicles, and as a practice, good players are using the services of PIC UP vans. While taking the cost of secondary transportation, we have not considered one-time material loading/unloading charges. In case of additional movement from one point to another, it will attract additional material handling charges. In normal circumstances, no big player in trade in Jaipur takes the services of rake as, in this case, the cost of secondary transportation becomes more. Also, it requires additional handling in which the quality of bags is also impacted. Since the rake point is single, timely delivery of material cannot be ensured, and in case of material shifting from rake siding to different warehouses, it attracts additional handling and transportation costs. Therefore, the expectations of channel partners concerning services to customers are minimum Lot size, direct delivery at the site, minimum damages, best quality, and timely delivery (Annexure Table 1).
| Annexure Table 1 Details of Cement Plants and Grinding Units | |||
| Sl.No. | Name of Cement Company | Location | |
| 1 | Birla Corp. Ltd. - Birla & Chanderia Cement Works | Chittorgarh | 2 |
| 2 | Mangalam Cement & Neer Shree Cement | Morak | 2 |
| 3 | Grasim Industries Ltd.-Aditya Cement | Shambhupura | 5 |
| 4 | J.K. Cements Ltd. | Nimbahera | 3.3 |
| 5 | J.K. Cements Ltd. | Mangrol | 0.75 |
| 6 | J.K. Cements Ltd. | Gotan | 0.47 |
| 7 | JK Lakshmi Cement Ltd. | Sirohi Road | 4.2 |
| 8 | J.K.Udaipur Udyog Ltd. | Udaipur | 0.9 |
| 9 | Shree Cement Ltd. | Beawar | 3 |
| 10 | Shree Cement Ltd. | Ras | 3 |
| 11 | Shree Cement Ltd.(G) | Khushkhera | 3 |
| 12 | Shree Cement Ltd.(G) | Suratgarh | 1.2 |
Conclusion
As per the market information, overall, the market size of Jaipur is approximately 140000 MT per month, in which the share of trade and non-trade is approximately 55 and 45 percent, respectively. This percentage fluctuates and depends on each segment's prevailing market prices. Out of more than ten players in the trade segment, 45 % of the share is shared by the top 3 players, namely Ultratech, Ambuja, and Binani, and all these players have four or more warehouses in the city spread over different corners of the city. On the one hand, they save on handling costs and transportation; on the other hand, they find themselves better equipped to provide timely customer service. The strength of any channel sales-driven industry depends on the strength of its channel partners, and apart from their business margins, services to the customers are the most crucial aspect of keeping the channel intact. Also, as the industry is logistics-driven, handling a large volume, each penny saved without compromising on volumes significantly contributes to the bottom line of the company’s balance sheet. Thus, maximum possible direct deliveries to the customers with a minimum lot size and at the expected timeline will keep customers, channel partners, and companies in good humor.
References
Abioye, O. F., Dulebenets, M. A., Kavoosi, M., Pasha, J., & Theophilus, O. (2020). Vessel schedule recovery in liner shipping: Modeling alternative recovery options. IEEE Transactions on Intelligent Transportation Systems, 22(10), 6420-6434.
Indexed at, Google Scholar, Cross Ref
Aizawa, T., & Kawano, T. (1996). Optimization systems in production and distribution of the cement industry. IEEE Transactions on Industry Applications, 32(3), 695-703.
Balakrishnan, N. (1990). Modified Vogel's approximation method for the unbalanced transportation problem. Applied Mathematics Letters, 3(2), 9-11.
Indexed at, Google Scholar, Cross Ref
Bera, R.K., & Mondal, S. K. (2020). Analyzing a two-staged multi-objective transportation problem under quantity dependent credit period policy using q-fuzzy number. International Journal of Applied and Computational Mathematics, 6, 1-33.
Gass, S.I. (1990). On solving the transportation problem. Journal of the Operational Research Society, 41(4), 291-297.
Goyal, S.K. (1984). Improving VAM for unbalanced transportation problems. Journal of the operational research society, 35(12), 1113-1114.
Indexed at, Google Scholar, Cross Ref
Gujjula, R., Werk, S., & Günther, H. O. (2011). A heuristic based on Vogel's approximation method for sequencing mixed-model assembly lines. International Journal of Production Research, 49(21), 6451-6468.
Intrator, J. (1989). A note on the optimal solution of a transportation problem. ASIA-PACIFIC J. OPER. RES., 6(2), 207-208.
Jain, V., Sthi, P., Verma, R., Srya, S., & Chawla, C. (2020). An Analytical Solution of Transportation Problem from Modified Distribution (MODI) Approach. Wesley. J. Res, 13, 43-55.
Korukoğlu, S., & Ballı, S. (2011). An improved Vogel's approximation method for the transportation problem. Mathematical and computational Applications, 16(2), 370-381.
Loch, G. V., & da Silva, A. C. L. (2014). A computational study on the number of iterations to solve the transportation problem. Applied Mathematical Sciences, 8(92), 4579-4583.
Nahar, J., Rusyaman, E., & Putri, S. D. V. E. (2018, March). Application of improved Vogel’s approximation method in minimization of rice distribution costs of Perum BULOG. In IOP Conference Series: Materials Science and Engineering (Vol. 332, No. 1, p. 012027). IOP Publishing.
Reinfeld, N.V., & Vogel, W.R. (1958). Mathematical Programming New Jersey Prentice-Hall. Englewood Cliffs.
Indexed at, Google Scholar, Cross Ref
Shafaat, A., & Goyal, S. K. (1988). Resolution of degeneracy in transportation problems. Journal of the Operational Research Society, 411-413.
Verma, V., & Puri, M.C. (2022). On a paradox in linear fractional transportation problems. In Recent developments in mathematical programming (pp. 413-424). CRC Press.
Indexed at, Google Scholar, Cross Ref
Received: 02-Aug-2024, Manuscript No. AMSJ-24-15114; Editor assigned: 03-Aug-2024, PreQC No. AMSJ-24-15114(PQ); Reviewed: 26-Sep-2024, QC No. AMSJ-24-15114; Revised: 26-Oct-2024, Manuscript No. AMSJ-24-15114(R); Published: 10-Nov-2024
