Research Article: 2020 Vol: 21 Issue: 3
Measuring the Relative Efficiency Of Course Delivery Modes Using Data Envelopment Analysis
Augustin Ntembe, Bowie State University, Maryland, USA
Elkanah Faux, Bowie State University, Maryland, USA
Abstract
This paper uses Data Envelopment Analysis to measure the relative efficiency of online and face-to-face delivery of the Principles of Microeconomics course at Bowie State University. The data used in estimating the relative efficiencies of the different modes of course delivery was collected from two online sections and two face-to-face sections of the course in 2019. The study considered each of the course sections as an operating decision-making unit. The variable returns to scale model oriented towards maximizing output was used to estimate the technical and scale efficiencies of the course delivery modes. The results indicate that the two online sections were identified as efficient while one section of the face-to-face was considered as efficient. The results suggest that the Data Envelopment Analysis technique used to assess relative efficiency in the delivery of the four-course sections present plausible quantitative information for comparative analysis and strategy to improve student learning outcomes.
Keywords
Efficiency, Data Envelopment Analysis, Course Delivery Techniques, Learning outcomes, Decision-Making Units.
JEL Classifications
C80, C67.
Introduction
The popularity of online course delivery has increased in the last decade (Allen & Seaman, 2013) as students, parents, college, and university administrators face the rising cost of education. These education stakeholders see online instruction as a cost efficiency mode of course delivery especially when face-to-face options are unavailable. Students taking the principles of microeconomics course at Bowie State University regardless of whether they are taking the course face-to-face or online, take advantage of a wide range of web-resources that help with building math and critical thinking skills that enable them to easily grasp economic concepts. However, the question of the relative efficiency of both modes of instructions need to be examined in order to answer the question of whether online delivery method improve students learning experiences and performance outcomes compared to face-to-face delivery.
Although the relative efficiency of online and face-to-face instruction has been examined in various studies, no such study has used Data Envelopment Analysis (DEA) technique to examine the differences in the efficiency of various delivery modes of the Principles of Microeconomics course. The DEA approach can use the inputs in the learning process as well as the performance (output) of the students to measure the efficiency of course delivery through various course delivery methods. The DEA developed by (Charnes et al., 1978) is a technique used to measure the relative efficiency of decision-making units that are similar in terms of their outputs and inputs. Sarkis & Seol (2010) have used the DEA to measure the effectiveness of teaching at the course unit level. However, the current study goes beyond that of Sarkis and Seol (2010) to compare the efficiencies of different course delivery modes based on performance outcome measures.
The principles of microeconomics course was identified for use in the study because the course is broad based and is open to undergraduate students in all departments and is offered online and face-to-face. It is a three-credit course taught at the undergraduate level in the College of Business at Bowie State University. The course is a graduation requirement for all concentrations in the Business Administration program. It is also a general education requirement for students in other programs across the campus – history and government, sciences, and professional studies.
The Principles of Microeconomics course is offered year-round including during the summer and winter sessions), and enrolls over 150 students per year. Before the redesign of the course in 2013, the course delivery was entirely face-to-face which translated into poor students' performance, dropouts and withdrawals, and a demonstrated pattern of low concept retention as evidenced by the exam and test grades. The average rate of success in the course, as measured by the proportion of initial enrollees who ultimately achieve a grade of C or better, typically was no better than around 50 percent with a substantial number of dropouts, failures and withdrawals (DFWs).
To address the aforementioned challenges, the Neuro-Cognitive Assessment Testing (NCAT) approach to redesign was adopted in selecting the Replacement Model that reduced the number of in-class meetings, encouraged more interactive and active learning, and enabled the use of computer-based resources. The choice of the Replacement Model led to a reduction in face-to-face meetings in favor of technology-based online activities Brown-Robertson, et al. (2015).
Based on the model, certain course activities were conducted online where students could participate anytime and anywhere and, in some cases, out-of-class activities including some in computer labs. One version of the replacement model replaces some class meetings with online activities while keeping in-class activities more or less the same. Others replace some class meetings with online activities and make significant changes in what goes on in the remaining class meetings. The re-designed course was initially a hybrid, and then later evolved to purely online offerings.
The Data Envelopment Analysis technique will be used to estimate the relative efficiencies of each of the delivery modes using on data collected from four sections of the Principles of Microeconomics course taught by the same instructor using two different instruction platforms in the Collage of Business at Bowie State University in 2019. The rest of the paper is organized as follows: Section 2 reviews previous studies on data envelopment analysis, section 3 looks the DEA methodology and section 4 presents and discusses the results.
Previous Evidence on Data Envelopment Analysis
The Data Envelopment Analysis (DEA) technique suggested by Charnes, Cooper, and Rhodes (1978), and built on the idea proposed by Farrell in (1957), is concerned with estimating technical efficiency and efficient frontiers Yun et al. (2004). The DEA is a data-oriented approach for evaluating the performance of a set of peer entities, referred to as Operational Units that transform inputs into outputs Cooper et al, (2011). The method is used to measure efficiency when there are multiple inputs and outputs with no generally acceptable weights for aggregating the inputs and outputs. Macmillan & Datta (1978). The relevance of the DEA approach is that the relative efficiency of each unit is obtained from the ratio of multiple outputs to multiple inputs Charnes et al. (1978).
Few studies have measured the effectiveness of course delivery in education and have provided evidence suggesting there is no difference in online versus face-to-face student performance based on student demographic characteristics Huh et al. (2010). In evaluating student performance based on student completion rates of course assignments; Olson (2002) found insufficient evidence to indicate that online versus face-face delivery is a factor influencing a student's completion of his or her coursework. In a study to predict the performance of online students, Trawick et al. (2010) found lower student performance in online courses, whereas Detwiler (2008) found higher performance rates in a similar study.
Breu & Raab (1994) used the DEA to measure the relative efficiency of the best 25 U.S. News and World Report-ranked universities. The results indicate it may be used to measure the relative efficiency of these higher education institutions from commonly available performance indicators. Kuah & Wong (2011) presented the DEA model for joint evaluation of the relative efficiencies of teaching and research at Malaysian universities. The inputs and outputs for university performance measurement comprised of 16 measures in total and a joint DEA maximization approach was used to model and evaluate these measures. The findings enabled the academics at the universities to identify deficient activities and take appropriate actions for improvement.
In a comparison of traditional and hybrid sections in a Principles of Marketing course, Priluck (2004) found no difference in performance, yet significant differences in student satisfaction. Hirao (2012) used the DEA methodology to study the efficiency of the top 50 public and private business schools in the United States in the year 2006. The study found that although technical efficiencies of private and public schools were both high, scale and overall efficiencies of public schools were lower than those of private schools.
Until the late 1990s, the use of DEA within a classroom and teaching context in higher education to assess classroom teaching practices was practically non-existent. It was Becker (2004) who had suggested that it could be used to determine whether the teacher and/or student exhibits best practices. According to Ekstrand (2006), it was only following the new millennium that higher education efficiency studies shifted their focus to consider the efficiency of modules or units within a particular university.
Clearly, the DEA approach has been used in several studies to measure the efficiency of a broad range of activities relating to higher education. However, none of these studies have addressed the relative efficiency of online and face-to-face delivery of an undergraduate course such as the principles of microeconomics course. Thus, the current study will specifically analyze the efficiency of the different delivery modes of the same course.
Data and Method
This paper estimates the efficiency of online vs face-to-face delivery modes of the principles of microeconomics course at Bowie State University in 2019. Two sections of the course were delivered online while two were delivered face-to-face by the same instructor. Both methods of course delivery produce identifiable outputs from measurable inputs. The following sub-sections examine the data and the estimation procedure of the relative efficiencies of the different delivery modes.
The Data Set
To conduct this study, we selected the Principles of Microeconomics course offered by the Department of Accounting, Finance, and Economics taken by undergraduate students admitted during spring 2019. All the students take the course as a college pre-requisite towards their bachelor's degree in Business Administration. The sample consisted of 116 students who took the course in four different sections. While it is possible that students can self-select into a course, the tradition at the College of Business at Bowie State University in recent years is that the name of the instructor is not known until after the registration is complete. In face of this policy, students are less flexible in switching sections. This enrollment protocol largely eliminates self-selection bias.
The output consists of the total weighted average performance on all assignments and exams taken by each student in the DMU. The first input selected for the study was the amount of time that the student spent learning on McGraw-Hill LearnSmart while the second input was the amount of student engagement in the course. A measure of engagement was provided in the course section on McGraw-Hill Connect which looks for patterns of online activity to track the engagement level of the student. As Connect tracks students with low online engagement, the instructor receives alerts about students with low engagement scores, and in turn contacts them to get them back on track.
The Linear Program Model
The model for estimating the efficiencies of the different course sections is based on the DEA method first used in evaluating the efficiency of schools and hospitals (Charnes, Cooper, & Rhodes,1978). Two sections of the course were delivered online while two were delivered face-to-face by the same instructor. The DEA technique used in estimating the efficiencies of the delivery modes is a non-parametric mathematical programming approach to frontier estimations which emphasizes the fact that a DMU can independently make decisions to improve its performance. The output-orientated model will be used to measure the efficiencies of the different approaches used in teaching the course.
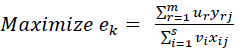
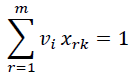
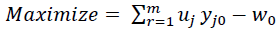
Suppose that there are n DMUs, each of which generates m outputs from s inputs. The weighted sums are used to aggregate inputs and outputs, and the measure of the efficiency of any DMU is obtained as the maximum ratio of total weighted outputs to the total weighted inputs, subject to the condition that the ratios for every DMU are less than or equal to unity. The model can thus be specified mathematically as follows:
 (1)
(1)

Where:


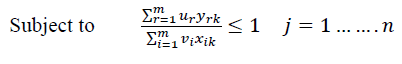
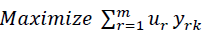
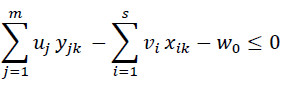
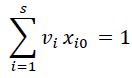
The specified model is solved for the values of u and v that maximize the efficiency of DMU j under the restriction that all the efficiency measures must be equal to or less than 1: it can have an infinite number of solutions. Following Charnes & Cooper (1962), By setting the denominator in the objective function equal to a constant (usually unity), the resulting LP model as follows:
 (2)
(2)
Subject to
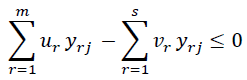

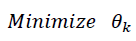
The efficiency evaluation models shown above are called Charnes, Cooper and Rhodes (CCR) models or the Constant Returns to Scale (CRS) and are treated in the input-oriented forms. The constant returns to scale model assume full proportionality between inputs and outputs. The efficient DMUs in the CCR model are called CCR efficient. The dual programming form is written as:
Min θ (3)
Subject to:
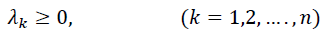
Where:
 are dual weights which describe the proportion attributed to
  used to define the composite unit. To allow variable returns to scale, the Banker et al. (1986) (BCC) model was modified by Banker et al. (1984), to include an additional constant variable,
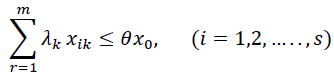
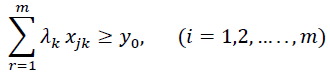
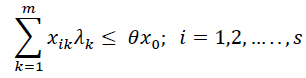
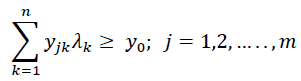
  so as to permit variable returns to scale (VRS). The variable returns to scale (VRS) model is used to estimate efficiencies where an increase or decrease in inputs or outputs does not result in a proportional change in the outputs or inputs respectively (Cooper, Seiford, and Zhu, 2011). The VRS LP model is written as follows:
 (4)
(4)
Subject to

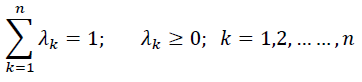
The dual form of the LP (4) is as follows:
 (5)
(5)
Subject to
The LP model can be solved for each DMU to obtain BCC efficiency values. The performance efficiency measures are simply pure efficiency which is related to the values obtained from the model that allows scalable return variables. The scale technical efficiency can be calculated from the value of the pure technical efficiency.
Empirical Results
The study uses the basic output-oriented DEA model proposed by Charnes et al. (1978)
which maximizes output for a given level of input. The study determines the level of performance in the course section for a given level of input. Each of the courses is taught using a certain number of inputs (amount of time spent by the student to read the course material and the amount of effort expended by the student to complete the course to generate the output or final score obtained in the course). The first model assumes variable returns to scale technology while the second model assumes variable returns to scale.
The four-course sections produce output (students weighted average score) with two inputs (the amount of time that students spent learning measured with the average time spent on McGraw-Hill's LearnSmart activity, and level of student engagement in the course – as reported from McGraw-Hill connect). The latter input is a critical instrument that allows the instructor to identify students that are not fully engaged and to provide them with more feedback and support during the learning process. The study uses DEAP software to estimate the relative efficiencies associated with each of the course section in Table 1. The specific approach used is the basic output-oriented DEA model proposed by Charnes et al. (1978).
| Table 1 Inputs and Output Used in the Data Envelopment Analysis Model | |||
| DMU | Output | Input | |
| Weighted Average score | Average time spent studying | Engagement | |
| 1 | 85.75 | 42.52 | 9.40 |
| 2 | 85.18 | 30.10 | 10.00 |
| 3 | 73.00 | 32.54 | 9.80 |
| 4 | 76.56 | 79.23 | 9.90 |
Table 2 shows the technical efficiency from the VRS DEA model, the pure technical efficiency, and the scale efficiency for the four-course sections that were delivered online and face-to-face. The results are obtained by maximizing outputs or grade scores for each of the course sections.
| Table 2 Input-Oriented DEA Summary Results, Variable Returns to Scale | ||||
| DMU | CRSTE | VRSTE | SCALE | |
| 1 | 1.000 | 1.000 | 1.000 | - |
| 2 | 1.000 | 1.000 | 1.000 | - |
| 3 | 0.862 | 0.909 | 0.949 | Irs |
| 4 | 0.925 | 1.000 | 0.925 | irs |
| Mean | 0.947 | 0.977 | 0.968 | |
Vrste = technical efficiency from VRS DEA
Scale = scale efficiency = crste/vrste
Drs = decreasing returns to scale
IRS = increasing returns to scale
Note also that all subsequent tables refer to VRS results
The course sections that achieved efficiency scores equal to 1 were considered as efficient (column 3 on Table 2-VRSTE). The results show that three of the four-course sections (1, 2, 4) were identified as being efficient and only one (3) was inefficient. The two online sections were considered as efficient while one section of the face-to-face offering was considered as being inefficient. Thus, the evidence shows that students in the online courses performed relatively well and that they were more efficient in utilizing the available resources to produce the investigated output. The course section that had the lowest efficiency was the face to face section taught in the spring of 2019.
The DMU 3 also has a relatively low CRSTE (0.862 shown in Table 2). The average efficiency score for the CRS DEA and the VRS DEA is respectively 0.947 and 0.977 indicating the absence of any large discrepancies between the efficiencies of the four DMUs. Two of the DMUs were operating at IRS implying that they can improve their efficiency if certain things were done simultaneously rather than in a piecemeal/sequential fashion.
(Technical efficiency = 1.000; Scale efficiency = 1.000 (crs)
Table 3 displays the results for the winter course taught online in 2019. The table shows a technical efficiency score of 100 percent and a scale score of 100 percent. Input 1 cannot be reduced implying there is no radial movement (or 0.00/42.517 x 100). Therefore, VRSTE corresponds to 100 %. Since the pure efficiency score is 100%, the student cannot improve performance by increasing the amount of time devoted to learning or the amount of effort expended on the course.
| Table 3 Projection Summary of Winter Course (DMU1) Results | |||||
| Variable | Original value | Radial movement | Slack movement | Projected value | |
| Output | 1 | 85.740 | 0.000 | 0.000 | 85.740 |
| Input | 1 | 42.517 | 0.000 | 0.000 | 42.517 |
| Input | 2 | 9.400 | 0.000 | 0.000 | 9.400 |
| Listing of Peers | |||||
| peer | Lambda weight | ||||
| 1 | 1.000 | ||||
(Technical efficiency = 1.000; Scale efficiency = 1.000 (crs)
Table 4 displays the results for the course taught in summer. The DMU2 shows a technical efficiency score of 100% and a scale efficiency score of 100%. The two used in the calculations cannot be improved to affect learning outcomes as there is no feature in need of improvement for the two inputs.
| Table 4 Projection Summary of Summer Course (DMU2) Results | |||||
| Variable | Original value | Radial movement | Slack movement | Projected value | |
| Output | 1 | 85.175 | 0.000 | 0.000 | 85.175 |
| Input | 1 | 30.099 | 0.000 | 0.000 | 30.099 |
| Input | 2 | 10.000 | 0.000 | 0.000 | 10.000 |
| Listing of Peers | |||||
| peer | Lambda weight | ||||
| 2 | 1.000 | ||||
(Technical efficiency = 0.909; Scale efficiency = 0.949 (irs)
Table 5 displays the results for the spring course. It shows a technical efficiency score of 90.9 % and a scale efficiency score of 9.9 %. Output 1 can be increased by 7.331 (radial movement). This represents 9.03 % (7.331/80.333) x 100 to be located on the efficiency frontier. The spring course section should learn best practices from the fall course section (DMU4) which is associated with a higher weight (0.57).
| Table 5 Projection Summary Spring Course (DMU3) Results | |||||
| Variable | Original value | Radial movement | Slack movement | Projected value | |
| Output | 1 | 73.002 | 7.331 | 0.000 | 80.333 |
| Input | 1 | 32.545 | 0.000 | 0.000 | 32.545 |
| Input | 2 | 9.800 | 0.000 | 0.000 | 9.800 |
| Listing of Peers | |||||
| peer | Lambda weight | ||||
| 2 | 0.186 | ||||
| 1 | 0.237 | ||||
| 4 | 0.577 | ||||
(Technical efficiency = 1.000; Scale efficiency = 0.925 (irs)
Table 6 displays the results for the section of the course delivered face to face during the Fall 2019 semester. The DMU4 has a pure efficiency score of 100% and a scale efficiency score of 92.5%. It is facing increasing returns to scale (IRS). The course is well delivered and it cannot improve its pure efficiency. However, it can improve its scale efficiency. About 3.2% (100 – 96.8) of the amount of inputs used could be saved. The original value column contains the original values of the course variables. These values are equal to the projected values (pure efficiency = 100%). The course is purely efficient and it acts on its power.
| Table 6 Projection Summary Fall Course (DMU4) Results | |||||
| Variable | Original value | Radial movement | Slack movement | Projected value | |
| Output | 1 | 76.555 | 0.000 | 0.000 | 76.555 |
| Input | 1 | 29.235 | 0.000 | 0.000 | 29.235 |
| Input | 2 | 9.900 | 0.000 | 0.000 | 9.900 |
| Listing of Peers | |||||
| peer | Lambda weight | ||||
| 4 | 1.000 | ||||
Discussion and Conclusion
The goal of this paper was to apply the DEA method of data analysis to assess the relative efficiency of courses delivered online and face to face. The model utilized is the output-oriented model aimed at maximizing outputs or student performance. The key factors investigated were the amount of time devoted to online reading and learning, and also the amount of student engagement in the course. The latter was generated by collecting information on the patterns of online student activity to determine students' engagement by looking at the frequency of logins and the submission of assignments. The instructor sends messages to students with low online engagement to express concern to the affected students. Students react to these messages by complying with the instructor to complete their assignments and online activities. The results from the DEA show that three of the four-course sections were efficient and only one was inefficient.
The two online course sections delivered in winter and summer were efficient while just one of the face-to-face sections delivered in the spring was inefficient. This is a rather strange phenomenon which could arise if there are external factors that could affect performance such as late registration, inadequacy in student advising that lead students to take classes that do not fit their schedules. Or, does it have to do with the time of the day when the course was being taught? Or, based on the assumption of equally well-prepared students and invariably then, a lecture in a well-organized delivery mode will not yield the desired outcomes.
However, because all the four-course sections were taught by the same instructor, the inefficiency of the third-course section could be attributed to students not utilizing all the resources available to them, including time, an important variable that enhances learning. It is also possible to revise the face to face course to incorporate some of the online and computer-based activities to bring more efficiency to the required learning platform. Findings from the current study could guide the formulation of teaching strategies to improve learning outcomes. Findings could also be helpful in evaluating the efficiency of the different modes of course delivery.
References
- Allen, I.E., & Seaman, J. (2013). Changing course: Ten years of tracking online education in the United States. Babson Survey Research Group. Pearson Publishers and Sloan Foundation.
- Banker, R.D. (1980). Studies in cost allocation and efficiency evaluation. Unpublished doctoral thesis, Harvard University, Graduate School of Business Administration.
- Banker, R.D. & Morey, R.D. (1986). Efficiency analysis for exogenously fixed inputs and outputs.Operations Research, 34 (4, July-Aug.).
- Banker, R.D., Charnes, A., & Cooper, W.W. (1984). Some models for estimating technical and scale inefficiencies in data envelopment analysis.Management Science, 30 (9, Sept.).
- Brown-Robertson, L., Ntembe, A., & Tawah, R. (2015). Evaluating the "underserved student" success in economics principles courses. Journal of Economics and Economic Education Research, 16(3), 13-23. Retrieved from https://search.proquest.com/docview/1768624161?accountid=9683
- Detwiler, J.E. (2008). Comparing student performance in online and blended sections of a GIS programming class. Transactions in GIS, 12 (1), 131-144.
- Farrell, M. J. (1957). The measurement of Productive Efficiency. Journal of the Royal Statistical Society, Series A, Vol. 120 (3), pp. 253–290. DOI: 10.2307/2343100
- Huh, S., Jin, J.J., Lee, K.J., & Yoo, S. (2010).Differential effects of student characteristics on performance: Online vis-à-vis offline accounting courses.Academy of Education Leadership Journal, 4.
- Kuah, Ch. T.; Wong, K. Y. 2011. Efficiency assessment of universities through data envelopment analysis, Procedia Computer Science 3: 499–506. http://dx.doi.org/10.1016/j.procs.2010.12.084
- Lu, J., Yu, C.S., & Liu, C. (2003). Learning style, learning patterns, and learning performance in a WebCT-based MIS course. Information & Management, 40(6),497-507.
- Olson, D. A (2002).Comparison of online and lecture methods for delivering the CS 1 course.Journal of Computer Sciences in Colleges, 18 (2, Dec).
- Priluck, R. (2004). Web-assisted courses for business education: An examination of two sections of Principles of Marketing. Journal of Marketing Education, 26 (2), 161-173.
- Trawick, M.W., Lile, S.E. & Howsen, R.M. (2010). Predicting performance for online students: Is it better to be home alone? Journal of Applied Economics and Policy, 29 (Spring), 34-46.
- Yun, Y. B., Nakayama, H. & Tanino, T. (2004). A generalized model for data envelopment analysis. European Journal of Operational Research Vol. 157 (1) pp. 87–105 https://doi.org/10.1016/S0377-2217(03)00140-1