Review Article: 2024 Vol: 28 Issue: 5
Long and Short-Term Performance Analysis of Government Initiated Merger of Indian Banks: An Event Study and Ratio Analysis Approach
Nikunj Chaudhary, ABV – Indian Institute of Information Technology and Management, Gwalior, Madhya Pradesh
Rajendra Sahu, ABV – Indian Institute of Information Technology and Management, Gwalior, Madhya Pradesh
Vaibhav Agarwal, ABV – Indian Institute of Information Technology and Management, Gwalior, Madhya Pradesh
Citation Information: Chaudhary, N., Sahu, R., & Agarwal., V. (2024). Long and short-term performance analysis of government initiated merger of indian banks: an event study and ratio analysis approach. Academy of Marketing Studies Journal, 28(5), 1-20.
Abstract
Considering that mergers and acquisitions (M&As) are pivotal strategic decisions, it is imperative to delve into the resultant synergy creation. Therefore, the paper meticulously examined the impact of mergers on the operational performance of Bank of Baroda (BOB), one of India’s leading state-owned banks, in the short and long duration. This study employed a multifaceted approach, incorporating event study methodology (ESM), strategic similarity analysis (SSA), and ratio analysis, to comprehensively investigate both the short and long-duration performance of BOB. The outcomes unveiled that BOB’s shareholders reacted optimistically to the merger news. BOB’s financial performance after merger demonstrated noteworthy improvements, evident in its enhanced ratios and SSA. Specifically, the study revealed significant enhancements in various key variables, including profitability, efficiency, liquidity, relative size, and cost-to-income ratio, underscoring the positive impact of the merger on Bank of Baroda’s overall operational performance. The study shows that management should not presume that M&As will invariably yield higher profits and synergies. In order to approach a more realistic understanding, a parallel case study-based research could be initiated in conjunction with the present study.
Keywords
Merger and Acquisitions, Event Study Methodology, Strategic Similarity Analysis, Financial Performance.
Introduction
The dynamic and ever-changing global business environment has compelled enterprises to adapt to counter fierce competition swiftly. Inorganic growth strategies, such as M&As, strategic alliances, and joint ventures, have become indispensable tools for overcoming these challenges. Among these strategies, M&A is notably one of the most popular strategies, with corporations increasingly utilizing it to enter new markets, expand production capacity, gain market share, achieve synergy, reduce costs, gain a competitive edge, and mitigate economic shocks (Altunbas & Marqués, 2008; Antoniadis et al., 2014; Martynova & Reneeboog, 2006).
Companies strategically employ M&A as a means to enhance performance and profitability through the creation of synergies, improved efficiencies, asset acquisition, and market expansion. Synergy, in the context of M&A, refers to the new unit having a value higher than the constituent units (Wajid et al., 2019), making M&A a common phenomenon in corporate settings. However, in the banking sector, M&As are not always solely aimed at countering competition or gaining a competitive edge (Anand & Singh, 2008; Wajid et al., 2019). As a result, academically, M&As in the banking sector have received relatively less attention than corporate M&As (Abbas, Hunjra, Saeed, et al., 2014; Aggarwal & Garg, 2019).
In India, both public and private sector banks have witnessed numerous mergers and acquisitions in the aftermath of globalization, privatization, deregulation, and liberalization (Mallikarjunappa & Nayak, 2013). Existing studies indicate that the main driving force behind bank mergers is to capitalize on unity benefits and enhance the efficiency of the merged bank (Mall & Gupta, 2019). Several Indian banks have faced challenges related to excessive lending and mounting non-performing assets (NPAs) in various instances. To address these issues, the government initially infused capital but later turned to bank consolidation as a means to improve capital efficiency and enhance the recovery of bad loans (Abbas, Hunjra, Azam, et al., 2014; Kumar & Suhas, 2010; Patel, 2018; Shah & Khan, 2017; Wajid et al., 2019). Moreover, the merger aims to create a global-scale bank in India. Therefore, due to their significance in reshaping the global banking business, M&As in the banking sector have attracted much attention from academicians in recent decades. In light of these facts, this study examines the amalgamation of three Indian public sector banks, namely, Dena Bank, Vijaya Bank, and Bank of Baroda.
The study aims to comprehensively analyze the performance of the entity created post government forced merger of Dena Bank, Vijaya Bank, and Bank of Baroda. In 2018, Dena Bank’s gross non-performing assets accounted for Rs. 16,361.44 Crore, 22.04% of its total advances. Similarly, Vijaya Bank’s gross NPA rose to Rs. 7,526 Crore, representing 6.34% of its total advances, while Bank of Baroda’s gross NPA surged to Rs. 56,480 Crores, equivalent to 12.26% of its total advances (Bank of Baroda, 2018; Dena Bank, 2018; Vijaya Bank, 2018). Due to the alarming increase in NPAs and the precarious future of Dena Bank (smaller bank), the Reserve Bank of India (RBI) proposed its consolidation and integration with larger banks such as Vijaya Bank and BOB. As a result, this tripartite amalgamation was initiated by the government of India to address the issues of NPAs and loan defaults, emphasizing combining and fortifying these banks.
Therefore, to understand the consequence of this mega-merger in short-term and long-term performance, this study intends to investigate this merger holistically. Extant studies in the context of M&As in the banking sector have used either event study methodology (Antoniadis et al., 2014), strategic similarity analysis (Kuriakose & Paul, 2016), or ratio analysis (Patel, 2018) to investigate post-merger financial performance of banks. However, most of these studies have used one or two of the analysis method leading to a non-holistic financial performance analysis of merged entity. Moreover, as per the author’s best information, no study to date has examined the performance of an amalgamated entity formed after the merger of Dena Bank and Vijaya Bank with BOB. Hence, considering these gaps, this paper intends to comprehensively examine the performance of the consolidated entity formed after the merger utilizing a combination of ESM, SSA, and ratio analysis. The specific objectives are:
• To measure BOB’s abnormal returns to the shareholders in short-term following its merger announcement with Vijaya Bank and Dena Bank.
• To study the strategic similarity and dissimilarity between BOB, Vijaya Bank, and Dena Bank.
• To assess how the merger will affect the consolidated entity’s, i.e., BOB’s, financial performance.
The outcomes of this paper are anticipated to advance academicians’ understanding of the benefits of mergers in the banking sector. Furthermore, it seeks to shed new light on the performance of acquirers, thereby providing insights into the feasibility and applicability of merger strategy on Indian banks. This article is structured in this manner: firstly, the relevant literature is reviewed, followed by a detailed analysis and discussion on the ESM. Subsequently, SSA is discussed, followed by long-term financial performance assessment ratios analysis and its discussion. Finally, the study's conclusion, implication, limitations, and future research directions are presented.
Review of Extant Literature
Extant literature has investigated the financial performance of banks post-mergers, with a predominant focus on two crucial aspects in the Indian banking sector: the impact of M&A events on the operational performance of the merged entity, examined through ratio analysis, and the abnormal returns to shareholders, analyzed using event research methodology. However, it is noteworthy that many studies have been carried out in the context of developed economies, with limited research conducted in the Indian context, despite it being a rapidly growing developing economy (Wajid et al., 2019). Therefore, there is a significant dearth of studies explicitly exploring Indian bank mergers. The following are noteworthy studies conducted in the Indian context.
Balasubramanian (2022) studied the pre-merger of 6 nationalized banks for 2008-19 through key performance indicators. It established the factors influencing the financial capabilities of these banks using ratio analysis. The study concluded Oriental Bank of Commerce as most consistent regarding deposits, income from interest, and operating expenditures. Similarly, Allahabad Bank was consistent with investment and other income, Syndicate Bank was consistent with profitability, and Andhra and United Bank were consistent with non-performing assets. However, this study missed out on analyzing the performance of BOB, an important public sector bank, which was also under the M&A process during this period. However, they missed out on long-term and similarity analysis.
Herwadkar et al. (2022) studied the impact on five merged banks over four years through the short-term and medium-term performance using data envelopment analysis (DEA), event study analysis, and ratio analysis. The authors argued that the integration of Ratio analysis with event study analysis produces robust results. The ratio analysis conducted on bank mergers suggested that based on interest earnings, there is an enhancement in the bank’s efficiency after the merger.
Khushalani & Sinha (2021) examined the financial performance of 4 banks, viz. Indian Overseas Bank, HDFC Bank, ICICI Bank, Kotak Mahindra Bank, before and after amalgamation, using ratio analysis and paired t-test. The results showed that for Indian Overseas Bank, Dividends per Share (DPS), Return on Assets (ROA), and Capital Adequacy Ratio (CAR) were increased, with no improvement in the Net Profit Margin (NPM) and Credit Deposit Ratio (CDR). HDFC bank exhibited an improvement in CAR but no change in NPM, DPS, and ROA. For ICICI bank, CAR and NPM was improved, but no change in ROA, and DPS, with worsened credit deposit ratio. For Kotak Mahindra, ROA and CDR improved, but with no change in DPS, NPM, and CAR. Thus, the study showed a positive effect of consolidation on these banks’ financial performance. However, they missed out on similarity analysis and short-term performance assessment.
Jasrotia & Agarwal (2020) conducted a comprehensive study of ten successful mergers of banks from the public and private sectors in India from 2017 to 2019. They analyzed the data on Indian nationalized banks after their consolidation and analyzed their deposits and gross non-performing assets (GNPA) to assess the effect of the bank’s amalgamation on the economy of India. Moreover, they examined the negative and positive aspects of banks merger. The study concluded that the bank’s merger resulted in various positives, especially the consolidation of banks. The authors also provide recommendations for the way forward, including strategies for successful integration, addressing human resource challenges, leveraging technology, and promoting a culture of risk management and innovation. However, they did not examine if the banks were compatible to be merged and what their long-term prospects would be.
Meenakshisundaram & Kannan (2020) assessed the impact of M&A on the financial performance of three banking entities in India using ratio analysis from 2008 to 2017. They found that all three banks have lower ROAs and higher NPAs. The study concluded that efforts are required to increasing ROA and decreasing NPA, in order to improve effectiveness and amalgamated unit’s financial performance. However, they did not examine if these banks were compatible and what would be their short-term performance.
Babu (2019) conducted a study to assess the status of liquidity and profitability in Indian banks before and after mergers. The study utilized the Capital adequacy, Asset quality, Management, Earning, and Liquidity (CAMEL approach) and DEA to evaluate the performance of 17 national and private banks from 1998 to 2016. The study shows that HDFC bank ltd, Federal Bank, and Bank of Baroda were the banks that performed the best financially when compared to other banks. However, they did not clarify which banks were suitable for consolidation and what was the impact of the merger announcement on their operation.
Wajid et al. (2019) studied how acquisitions will affect ICICI Bank’s operational performance in the long term and market performance in the short term. This article employed ESM, ratio analysis, and SSA to examine ICICI Bank’s performance in long and short duration. The study observed that the announcement of ICICI Bank’s merger did not receive a positive reaction from the shareholders, as returns were not up to expectations. However, the SSA analysis and ratio analysis concluded that after the merger ICICI Bank’s financial performance improved significantly.
Patel (2018) evaluated the before and after consolidation long-term profitability of five Indian banks merged during 2003-04 to 2013-14 using the paired t-test. The financials were evaluated based on the variables such as return on equity (ROE), net profit ratio, return on assets (ROA), yield on advance, and investments. However, following the merger, earnings per share, business per employee, and profit per employee exhibited growth after the merger. However, they did not examine the merger compatibility of these banks.
Saha & Dash (2016) investigated various efficiency parameters and their drivers of PSUs justifying the consolidation in the Indian banking system and evaluated the performance of 54 Indian banks from 2001-2012 using the DEA analysis. The study concluded that the size of a bank significantly influenced the efficiency of Indian banks. However, NPAs had a detrimental effect and remained the biggest hindrance, leading to occasional discussions among policymakers and researchers in the country about consolidation. Nevertheless, the study missed out on examining the short-term performance of the merged entity.
Hence, it is evident that none of the recent studies have examined the merger of Vijaya and Dena Bank with BOB, resulting in a significant knowledge gap.
Methodology
In this article, data were collected through the annual reports of banks, published research papers, the Bombay Stock Exchange, and the CMIE Prowess IQ database to conduct a comprehensive analysis. The study’s sample comprised target and acquiring banks involved in merger activities from 2016 to 2022. Since the focus of this study is to investigate the effects of a specific merger on the performance of the acquiring bank, the study centers on the merger of BOB with Dena Bank and Vijaya Bank, employing the ESM to analyze the short-term abnormal returns to the shareholders of BOB post-announcement. Furthermore, SSA is performed on various variables of BOB, Vijaya Bank, and Dena Bank to assess the impact of similarities and dissimilarities between the target and bidder banks. Finally, ratio analysis is performed to evaluate the financials of BOB in the long-term. Moreover, a two-sample paired t-test was also performed for all 21 ratios used in this study to evaluate whether there were any significant differences between the pre-and post-merger periods. This gave researchers a thorough understanding of the operation and dynamics of the merger.
Data Analysis and Results Discussion
Analysis of Short-term Abnormal Returns
ESM assumes that the market is rational, and that the effect of any corporate announcement is observed directly on its share prices (Wajid et al., 2019). In a perfectly efficient market, ESM is apt for analysis when the pronouncement of strategies such as joint ventures, mergers, or strategic alliances are reflected in the stock prices (Fama, 1976; Louhichi, 2008; Mall & Gupta, 2019). As such, ESM has been widely used to assess the effect of various factors on a firm’s stock prices (Anand & Singh, 2008). Table 1 illustrates recent studies employing ESM with its various parameters to examine shareholder wealth affected by the consolidation events in the banking and non-banking sector.
| Table 1 Recent Studies Using Event Study Methodology | ||||||
| Study | N | Event | Model (Clean Period) | Total Days for the Model | Window | Total Days for the Window |
| Anand & Singh (2008) | 5 | Strategic alliances | Bidder banks - 120 days prior and 120 days after the 40-day window period Target banks- 200 days before and 40days after the 40-day window period | 281 days for Bidder bank & 281 days for Target banks | -40 to 40 | 81 |
| Joshipura & Panda (2019) | 332 | Strategic alliances | -31 to -251 | 220 | Multiple -30 to 30 | Multiple 61 |
| Mall & Gupta (2019) | 383 | Strategic alliances | Not available | Not available | -10 to 10 | 21 |
| Wajid et al. (2019) | 24 | Strategic alliances | -200 to -21 | 180 | Multiple -10 to 10 | Multiple 21 |
For conducting the ESM analysis, the methodological steps outlined by Montgomery & Takahashi (2014) were followed. While using ESM, the event must be clearly defined, which in this case is the day of the merger announcement to the general public. Subsequently, the estimation period needs to be determined (Uddin & Boateng, 2009), which in our study is from 120 to 21 days (-120 to -21 days) before the merger announcement.
The estimation period for parameter estimation is computed in the manner shown in Figure 1.

Figure 1 Chronology of Events Undertaken in the Study
Here, day 0 is defined as the event day; for instance, for this study, it is September 17, 2018, when BOB, Dena Bank, and Vijaya Bank’s merger was announced (The Times of India, 2018). Then, the abnormal returns were examined during the event window (-20, 20) day. To analyze expected returns, the single-factor model was employed, regressing the stock returns on the market index. Here, the actual returns ( ) (also referred to as adjusted closing price) of Bank of Baroda were taken from Bombay stock exchange (BSE), and Index data obtained from BSE BANKEX was used to compute estimated returns . The market model is to estimate the returns: is shown by Equation (1)
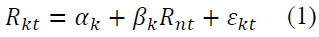
Where,  is the returns of Bank of Baroda for the period t (obtained from sources such as BSE)
 is the returns from the market (obtained from Index Data) ,
 is the intercept and
  is model’s slope, and
 denotes error term.
The values of intercept and slope were calculated using MS-Excel, which came out to be
The expected returns were computed using the following Equation (2)
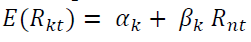 (2)
(2)
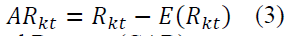
Now, the abnormal returns  for Bank of Baroda at period t were calculated using Equation (3):
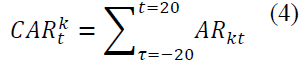
Moreover, Cumulative Abnormal Returns (CAR) were computed using Equation (4):
The event study statistics of BOB are reported in Table 2. The standard error is 0.0191 & slope (beta) is 2.130 revealing that the bank showed higher than average risk during the merger announcement with Vijaya Bank and Dena Bank. The R2 is 0.5038, indicating that the model explains 50.38% of the variation in BOB’s returns surrounding the merger, indicating adequate model fitness as extant studies have not mentioned any lower limit of R2 values (Anand & Singh, 2008).
| Table 2 Announcement Returns of Bank of Baroda | |||||
| Day |  |
 |
 |
CARs | Independent sample t-test |
| -20 | -0.0232 | -0.0511 | 0.0279 | 0.0279 | 1.4604 |
| -19 | 0.0217 | 0.0434 | -0.0217 | 0.0062 | -1.1376 |
| -18 | 0.0336 | 0.0684 | -0.0348 | -0.0286 | -1.8238 |
| -17 | -0.0013 | -0.0050 | 0.0037 | -0.0249 | 0.1933 |
| -16 | -0.0053 | -0.0134 | 0.0081 | -0.0169 | 0.4236 |
| -15 | -0.0170 | -0.0380 | 0.0210 | 0.0041 | 1.1002 |
| -14 | 0.0180 | 0.0356 | -0.0176 | -0.0135 | -0.9231 |
| -13 | -0.0407 | -0.0877 | 0.0471 | 0.0336 | 2.4679* |
| -12 | 0.0240 | 0.0482 | -0.0242 | 0.0094 | -1.2695 |
| -11 | 0.0180 | 0.0356 | -0.0176 | -0.0082 | -0.9231 |
| -10 | 0.0193 | 0.0384 | -0.0191 | -0.0273 | -1.0011 |
| -9 | -0.0075 | -0.0180 | 0.0105 | -0.0168 | 0.5515 |
| -8 | -0.0422 | -0.0909 | 0.0487 | 0.0319 | 2.5551* |
| -7 | -0.0062 | -0.0152 | 0.0091 | 0.0410 | 0.4747 |
| -6 | 0.0100 | 0.0189 | -0.0088 | 0.0321 | -0.4637 |
| -5 | 0.0134 | 0.0259 | -0.0125 | 0.0196 | -0.6561 |
| -4 | -0.0112 | -0.0257 | 0.0145 | 0.0342 | 0.7619 |
| -3 | -0.0376 | -0.0813 | 0.0437 | 0.0779 | 2.2918* |
| -2 | -0.0512 | -0.1098 | 0.0587 | 0.1365 | 3.0754* |
| -1 | 0.0079 | 0.0143 | -0.0064 | 0.1301 | -0.3381 |
| 0 (event day) | 0.0041 | 0.0064 | -0.0023 | 0.1278 | -0.1197 |
| 1 | -0.1603 | -0.3392 | 0.1790 | 0.3068 | 9.3821* |
| 2 | 0.0251 | 0.0506 | -0.0255 | 0.2813 | -1.3358 |
| 3 | -0.0400 | -0.0863 | 0.0463 | 0.3276 | 2.4284* |
| 4 | -0.0340 | -0.0738 | 0.0398 | 0.3674 | 2.0845* |
| 5 | 0.0153 | 0.0299 | -0.0146 | 0.3528 | -0.7679 |
| 6 | -0.0041 | -0.0109 | 0.0068 | 0.3595 | 0.3543 |
| 7 | -0.0413 | -0.0890 | 0.0477 | 0.4073 | 2.5026* |
| 8 | -0.0493 | -0.1058 | 0.0566 | 0.4638 | 2.9647* |
| 9 | 0.0513 | 0.1057 | -0.0544 | 0.4094 | -2.8498* |
| 10 | -0.0110 | -0.0254 | 0.0144 | 0.4238 | 0.7530 |
| 11 | 0.0000 | -0.0022 | 0.0022 | 0.4260 | 0.1167 |
| 12 | -0.0435 | -0.0938 | 0.0503 | 0.4763 | 2.6341* |
| 13 | -0.0121 | -0.0278 | 0.0156 | 0.4919 | 0.8186 |
| 14 | -0.0420 | -0.0905 | 0.0485 | 0.5404 | 2.5443* |
| 15 | 0.0235 | 0.0472 | -0.0237 | 0.5167 | -1.2430 |
| 16 | -0.0193 | -0.0429 | 0.0235 | 0.5403 | 1.2338 |
| 17 | 0.0245 | 0.0493 | -0.0248 | 0.5155 | -1.2995 |
| 18 | 0.0104 | 0.0196 | -0.0092 | 0.5062 | -0.4843 |
| 19 | 0.0288 | 0.0584 | -0.0295 | 0.4767 | -1.5489 |
| 20 | -0.0075 | -0.0180 | 0.0105 | 0.4872 | 0.5503 |
Notably, the  was computed using Equation (3), for (-20 to -1 days), shareholders of BOB were significantly lower before the merger announcement but increased (1 to 20 days) afterward (refer Table 2). In Table 2, the value of is -0.23%, and CAR is 12.78% on the event day, i.e., day zero. CAR is a widely used metric in event studies, providing a concise and standardized measure of the market’s response to a merger announcement. The overall CAR value increased from 12.78% (day 0) to 48.72% (day 20) in the next 20 days after the announcement of the merger. A positive CAR suggests a positive perception of the merger by the market, while a negative CAR indicates a negative perception. The magnitude of the CAR can offer insights into the expected value generated by the merger, making it a valuable tool for evaluating a merger’s long-term success. Further, by using an independent t-test on the values of , the findings indicate that during the event window (from day 0 to 20), eight days (highlighted in bold in Table 2) exhibited significant differences in the abnormal returns. This implies that, though there were an increase in the values of abnormal returns of stock prices on other days also, the significant difference in them was observed on these eight days. Overall, the stock prices of BOB responded positively to its merger with the Vijaya Bank and Dena Bank on these days.
Here, the event study analysis concluded that there was a spike in the abnormal returns of BOB after the merger announcement, which was greater in the period from day 0 to day 20 compared to day -20 to 0. The next section discusses the strategic similarity analysis.
Strategic Similarity Analysis
This analysis evaluates the compatibility of entities getting into a merger. A few studies have examined the factors influencing strategic fit between target and bidder firms, suggesting that the similarity and relatedness between two merging entities improve performance after the merger. Using the variables suggested by Wajid et al. (2019), Kuriakose & Paul (2016), Altunbas & Marqués (2008), and Ramaswamy (1997), the present study exhibits evaluates the strategic similarity between BOB, Vijaya Bank, and Dena Bank. Table 3 exhibits the items from the target and bidder bank’s balance sheets, which were utilized for the analysis.
| Table 3 Particulars of Banks for SSA | |||
| (Rs. In 000's) | |||
| Particulars | BANK OF BARODA | VIJAYA BANK | DENA BANK |
| Size of the Balance sheet | 7199997716 | 1776320472 | 1208597962 |
| Total Cost (TC) | 527375067 | 134634290 | 120188988 |
| Total Revenue (TR) | 503056945 | 141904519 | 100957456 |
| Other Income | 66571527 | 16006089 | 11635209 |
| Advances and Loans | 4274318313 | 1161654423 | 655815144 |
| Deposits | 5913148224 | 1572875358 | 1061301424 |
| Total Capital Including Reserves | 433947719 | 106271981 | 92028011 |
| Total Assets (TA) | 7199997716 | 1776320472 | 1208597962 |
| Interest Income | 436485418 | 125898430 | 89322247 |
Note: SSA = Strategic Similarity Analysis
Table 4 exhibits the evaluation parameters, mathematical formula, SSA results, and associated hypothesis. Table 4 showcases the evaluation parameters suggested by Kuriakose & Paul (2016) and Wajid et al. (2019). Using the values of particulars given in Table 3, the formulae presented in Table 4 were used to compute the similarity analysis results for all three banks.
| Table 4 Strategic Similarity Analysis Of Vijaya Bank, Dena Bank, And Bob | ||||||
| Evaluation Parameters | Estimation Formulae | Similarity Analysis Results | Post-Merger Performance Related Hypothesis | Hypothesis result | ||
| Bank of Baroda | Vijaya Bank | Dena Bank | ||||
| The relative size of the target | NA | 0.2467 | 0.1678 | A smaller ratio improves performance | supported | |
| Cost-income ratio | 1.0483 | 0.9487 | 1.1904 | Performance is improved by similarity | supported | |
| Efficiency ratio | 0.4892 | 0.3647 | 0.5509 | Performance is improved by similarity | supported for Vijaya Bank and not supported for Dena Bank | |
| Liquidity risk | 0.5936 | 0.6539 | 0.5426 | Performance is improved by similarity | supported | |
| Diversity Earning | 0.1323 | 0.1127 | 0.1152 | Performance is improved by dissimilarity | supported | |
| Financial Leverage | 0.0602 | 0.0598 | 0.0761 | Performance is improved by dissimilarity | not supported | |
| Loan-deposit ratio | 0.7228 | 0.7385 | 0.6179 | The similarity is vital in determining post-merger asset quality | supported for Vijaya Bank and not supported for Dena Bank | |
Interpretation of Strategic Similarity Analysis Results
The relative size of the target (bank) could refer to the size of the market or customer base being targeted. A larger target market may offer more potential customers but also entails increased competition. The target firm’s relative size is determined by dividing the size of the target (SOT) by the size of the bidder (SOB), as computed in Table 4. BOB is the bidder bank, and Vijaya & Dena Bank are the target banks. Hence, BOB does not have values for the first parameter in Table 4. However, the relative size of Vijaya Bank is 0.2467, and for Dena Bank, it is 0.1678, indicating a small ratio that suggests a good post-merger performance, as supported by studies by Kuriakose & Paul (2016) and Wajid et al. (2019). This argument is based on the idea that integration is easier and more effective when the relative size is small, facilitating cost-cutting strategies like technology sharing and eliminating overlapping branches noted by Altunbas & Marqués (2008) and Ramaswamy (1997). As per the hypothesis, a smaller ratio is associated with higher post-merger performance, suggesting that this dissimilarity in relative sizes will improve the performance.
The cost-income ratio (CIR), or operating margin, is a key financial metric that assesses a bank's efficiency in generating revenue from its operations. It gauges the rate at which expenses are evolving in relation to bank’s earnings, providing insight into the company’s cost-controlling measures and future outlook. A lower CIR is preferred, as it indicates the effective implementation of cost-cutting strategies that can enhance the bank’s profitability. The CIR is computed by dividing the total cost (TC) by the total revenue (TR). In the case of BOB and Vijaya Bank, their respective CIR values are 1.0483 and 0.9487, while for BOB and Dena Bank, the values are 1.0483 and 1.1904, respectively. The difference between these values is 0.0996 and 0.1421, which is a decent sign for the amalgamated bank because its similarity should improve performance after the merger (Altunbas & Marqués, 2008; Kuriakose & Paul, 2016). As evident from Table 4, this CIR value is higher for Dena Bank, which is expected as it faced many problems before it finally got merged with the Bank of Baroda. Similarly, Vijaya Bank’s overall costs surpass its profits, indicating the use of other funding sources to cover interest payments and other expenditures.
The efficiency ratio measures the proportion of a bank's revenue spent on operating expenses. It is calculated by taking the ratio of banks’ non-interest expenses (NIE) with the total revenue (TR). In the case of BOB and Dena Bank, the difference in efficiency ratio is very small, 0.1617, while the difference between BOB and Vijaya Bank is 0.1245. This small difference is considered a positive sign for the merged bank, as it indicates improved efficiency, as suggested by Wajid et al. (2019). On the other hand, a higher ratio exhibits operational inefficiency. Overall, these three banks exhibited mixed outcomes, as Dena Bank, the target bank, exhibited a higher efficiency ratio, which could potentially impact the post-merger performance of the new entity negatively. Dena Bank’s efficiency ratio exceeding 50 percent is possibly due to increased provisions and contingencies to its poor performance and is not considered favorable.
Liquidity risk in a bank refers to the potential risk of being unable to meet its financial obligations in a timely manner due to insufficient cash or liquid assets to meet its funding needs. This situation may arise when a bank's cash outflows exceed its cash inflows, which could be triggered by factors such as unexpected deposit withdrawals, sudden increases in loan defaults, or disruptions in financial markets. Liquidity risk is measured by dividing the loan amount (LN) by the total asset (TA).
Upon reviewing Table 4, it can be observed that the difference in liquidity risk between the BOB and Vijaya Bank is 0.0603, while the difference between BOB and Dena Bank is just 0.051. This small discrepancy is favorable for the merged entity as it indicates a lower liquidity risk. This implies that the combined entity would have sufficient cash and liquid assets to withstand any potential disruptions during the integration process, maintain investor confidence, and meet the requirements of maintaining an adequate level of liquidity to avoid penalties or reputational damage. Consequently, lower liquidity risk is anticipated to positively impact the unit's performance after the merger (Wajid et al., 2019). This would position the merged bank in a stronger position to navigate any potential liquidity challenges and enhance its overall performance.
The earnings diversification ratio specifies the bank's exposure to sources other than interest income. In the contemporary era of banking, the banks’ effectiveness in accessing the financial services market is evaluated based on income from other sources such as commissions income, forex operations, fees income, and treasury operations. Diversity of Earnings is the ratio determined by dividing other operational revenue (OOR) by total revenue (TR), and a higher ratio signifies better post-merger performance. Notable studies by Wajid et al. (2019), Kuriakose & Paul (2016), and Altunbas & Marqués (2008) suggested that its dissimilarity is expected to improve the post-merger performance. As evident from Table 4, BOB (DE ratio = 0.1323 compared to 0.1127 of Vijaya Bank and 0.1152 of Dena Bank) exhibits higher non-interest income than its partners, which is expected to create synergies in the post-amalgamation period.
Financial leverage in a bank entails the strategic use of debt to finance its operations or investments, with the goal of amplifying returns by generating income from borrowed funds. Similar to other businesses, banks can leverage debt to optimize their capital structure and enhance their performance. Financial leverage is measured by dividing capital (CPT) by total assets (TA). Its variance in capital structure is supposed to increase the performance post-amalgamation, as the optimum capital structure is obtainable from the combination of similar asset structures. However, as per Table 4, the ratio is very close to each other; hence, does not align with the assumption and is unfavorable for the merged bank.
The loan-deposit ratio is an important measure of a bank's lending activity and its ability to generate income from loans. It reflects the proportion of loans (LN) to the bank’s total assets (TA). Notably, Table 4 reveals that this ratio differs by 0.0157 points between BOB and Vijaya Bank; this small difference is considered a good sign for the merged bank. The ratio differs by 0.1049 between BOB and Dena Bank, which is very different from each other, and is not a good indicator for the merged bank as the performance after the merger is supposed to improve due to the similarity in these ratios (Altunbas & Marqués, 2008; Kuriakose & Paul, 2016; Wajid et al., 2019).
This concludes that the strategic similarity analysis validates the compatibility of the merger, as it is evidenced by the supported hypotheses of the relative size of the target, cost-income ratio, efficiency ratio, liquidity risk, diversity earnings, and loan-deposit ratio. However, the proposed hypotheses in Table 4 are rejected for Dena Bank in terms of efficiency ratio and loan-deposit ratio, and for Dena Bank and Vijaya Bank in terms of financial leverage.
Analysis of Financial Performance
The paper’s other objective is to conduct a comparison of the financial performance of the acquirer banks prior and after merger. The hypothesis says that acquirers would exhibit an improved financial performance in the post-merger duration compared to the pre-merger one. The assessment of financials is evaluated based on four ratio groups, viz. leverage, employee performance, liquidity, and profitability & efficiency ratio. These indicators are elucidated in Table 5.
| Table 5 Bank’s Financial Performance Metrics (21 Ratios) | |||
| Group Ratios | Ratio(s) / Indicators | Measurement | Sources |
| Profitability & Efficiency | Return on Equity (ROE) |  |
Abbas et al. (2014), Aggarwal & Garg (2019) Patel (2018); Rani et al. (2015) |
| Return on Assets (ROA) |  |
Abbas, Hunjra, Azam, et al. (2014), Aggarwal & Garg (2019), Patel (2018), Shah & Khan (2017) | |
| Return on Capital Employed (ROCE) |  |
Aggarwal & Garg (2019), Rani et al. (2015) | |
| Net Interest Margin (NIM) |  |
Abbas, Hunjra, Azam, et al. (2014), Shah & Khan (2017) | |
| Earnings Per Share (EPS) |  |
Abbas, Hunjra, Azam, et al. (2014), Patel (2018) | |
| Spread Ratio (SPR) |  |
Abbas, Hunjra, Azam, et al. (2014) | |
| Interest expense to Interest Income (IE/II) |  |
Abbas, Hunjra, Azam, et al. (2014) | |
| Non-Interest Income to Total Assets (NII/TA) |  |
Abbas, Hunjra, Azam, et al. (2014) | |
| Non-Interest Expense to Total Income (NIE/TI) |  |
Abbas, Hunjra, Azam, et al. (2014) | |
| Yield on Advances (YOD) |  |
Patel (2018) | |
| Yield on Investments (YOI) |  |
Patel (2018) | |
| Total Income/ Total Asset (TI/TA) |  |
Wajid et al. (2019) | |
| Liquidity | Cash & Cash equivalent to total assets (C/TA) |  |
Abbas, Hunjra, Azam, et al. (2014), Shah & Khan (2017) |
| Investment to Total Assets (I/TA) |  |
Abbas, Hunjra, Azam, et al. (2014), Shah & Khan (2017) | |
| Total Liabilities to total assets (TL/TA) |  |
Abbas, Hunjra, Azam, et al. (2014) | |
| Leverage | Debt to Equity Ratio (DE) |  |
Abbas, Hunjra, Azam, et al. (2014), Aggarwal & Garg (2019) |
| Capital Ratio (CR) |  |
Abbas, Hunjra, Azam, et al. (2014) | |
| Total Deposit to Total Equity (TD/TE) |  |
Abbas, Hunjra, Azam, et al. (2014), Shah & Khan (2017) | |
| Employee Performance Ratios | Business Per Employee (B/E) |  |
Patel (2018) |
| Profit Per Employee (NP/E) |  |
Financial Bank of Baroda Balancesheet, n.d. | |
| Interest Income Per Employee (II/E) |  |
Financial Bank of Baroda Balancesheet, n.d. | |
To examine the performance in the long-term, the study used long-term financial data from the duration prior to and after the merger. Different accounting measures were looked into in the study to give a comprehensive view of the long-term profitability and performance of mergers and acquisitions. The variables and statistical test were obtained from the literature review.
Moreover, paired t-test was also used to compute the significance of differences in the values of financial ratios from pre and post-merger durations. Studies such as Aggarwal & Garg (2019); Khushalani & Sinha (2021); R. Kumar (2009); Patel (2018); Rani et al. (2015); Rashid & Naeem (2017); Vulanovic (2017) have recommended its use.
This paper sourced data for analysis from the annual report of BOB. Here, the average of values from three years before and after merger is used to compare each factor. The suggestions outlined by Aggarwal & Garg (2019) and Kumar & Bansal (2008) were followed for choosing 3-year data for the impact of mergers and acquisitions analysis. Moreover, the year of the merger was excluded from the analysis, that is, 2019, because it would have distorted the results (Rani et al., 2016; Wajid et al., 2019).
Table 6 shows the computed values of 21 ratios for three years prior and post to merger using formulae exhibited in Table 5.
| Table 6 The Empirical Results of Ratios are Presented | ||||||||||||
| Pre-Merger | Post-Merger | |||||||||||
| Ratio(s) / Indicators | 2016 | 2017 | 2018 | Mean (µ1) | SD | 2020 | 2021 | 2022 | Mean (µ2) | SD | Computed t-value (Where critical t-value = 4.302) | Significance Value (α = 5%) |
| ROE (%) | -13.40 | 3.43 | -5.60 | -5.19 | 8.42 | 0.76 | 1.08 | 8.47 | 3.43 | 4.36 | -1.57 | 0.257 |
| ROA (%) | -0.80 | 0.20 | -0.34 | -0.31 | 0.50 | 0.05 | 0.07 | 0.57 | 0.23 | 0.29 | -1.62 | 0.247 |
| ROCE (%) | 1.36 | 1.63 | 1.72 | 1.57 | 0.19 | 1.77 | 1.85 | 1.81 | 1.81 | 0.04 | -2.58 | 0.123 |
| NIM (%) | 1.90 | 1.94 | 2.16 | 2.00 | 0.14 | 2.37 | 2.49 | 2.55 | 2.47 | 0.09 | -10.77 | 0.009 |
| EPS (Rs.) | -23.89 | 6.00 | -10.53 | -9.47 | 14.97 | 1.36 | 1.78 | 14.06 | 5.73 | 7.21 | -1.57 | 0.258 |
| SPR (%) | 28.91 | 32.02 | 36.13 | 32.35 | 3.62 | 36.13 | 40.87 | 46.68 | 41.23 | 5.29 | -9.20 | 0.012 |
| IE/II (%) | 71.09 | 67.98 | 64.44 | 67.83 | 3.33 | 63.87 | 59.13 | 53.32 | 58.77 | 5.29 | 8.00 | 0.015 |
| NII/TA (%) | 0.74 | 0.97 | 0.92 | 0.88 | 0.12 | 0.89 | 1.12 | 0.90 | 0.97 | 0.13 | -1.55 | 0.262 |
| NIE/TI (%) | 47.15 | 38.58 | 48.92 | 44.89 | 5.53 | 43.13 | 49.04 | 45.27 | 45.81 | 2.99 | -0.19 | 0.864 |
| YOD (%) | 12.78 | 12.77 | 11.77 | 12.44 | 0.58 | 12.51 | 11.81 | 10.47 | 11.60 | 1.03 | 2.82 | 0.106 |
| YOI (%) | 40.73 | 37.77 | 30.83 | 36.44 | 5.08 | 31.43 | 31.94 | 25.77 | 29.71 | 3.43 | 5.16 | 0.036 |
| TI/TA (%) | 7.31 | 7.05 | 6.99 | 7.11 | 0.17 | 7.45 | 7.22 | 6.37 | 7.01 | 0.57 | 0.38 | 0.739 |
| C/TA (%) | 19.94 | 21.65 | 12.90 | 18.17 | 4.64 | 10.53 | 10.42 | 9.60 | 10.18 | 0.51 | 3.33 | 0.080 |
| I/TA (%) | 17.94 | 18.66 | 22.66 | 19.75 | 2.55 | 23.72 | 22.61 | 24.71 | 23.68 | 1.05 | -3.65 | 0.068 |
| TL/TA (%) | 94.01 | 94.20 | 93.97 | 94.06 | 0.12 | 93.79 | 93.33 | 93.28 | 93.47 | 0.28 | 3.05 | 0.093 |
| DE (%) | 83.27 | 75.95 | 144.19 | 101.14 | 37.47 | 129.52 | 86.76 | 120.94 | 112.41 | 22.62 | -0.56 | 0.631 |
| CR (%) | 5.99 | 5.80 | 6.03 | 5.94 | 0.12 | 6.21 | 6.67 | 6.72 | 6.53 | 0.28 | -3.05 | 0.093 |
| TD/TE (%) | 1427.99 | 1492.87 | 1362.64 | 1427.83 | 65.11 | 1316.50 | 1255.09 | 1217.49 | 1263.03 | 49.98 | 4.37 | 0.049 |
| B/E (Rs.) | 184119500 | 187892864 | 185226664 | 185746343 | 1939618 | 194120422 | 204060663 | 230267103 | 209482729 | 18673369 | -2.20 | 0.159 |
| NP/E (Rs.) | -1037184 | 263856 | -442147 | -405158 | 651308 | 64803 | 101092 | 918530 | 361475 | 482764 | -1.63 | 0.245 |
| II/E (Rs.) | 8469902 | 8050349 | 7936098 | 8152116 | 281076 | 9015300 | 8596958 | 882639 | 6164966 | 4579408 | 0.78 | 0.515 |
Note: Values in bold represent a significant difference, p < 0.05; ROE = Return on Equity; ROA= Return on Assets; ROCE= Return on Capital Employed; NIM= Net Interest Margin; EPS= Earnings Per Share; SPR= Spread Ratio; IE/II= Interest expense to Interest Income; NII/TA= Non-Interest Income to Total Assets; NIE/TI= Non-Interest Expense to Total Income; YOD= Yield on Advances; YOI= Yield on Investments; TI/TA= Total Income/ Total Assets; C/TA= Cash & Cash equivalent to total assets; I/TA= Investment to Total Assets; TL/TA= Total Liabilities to total assets; DE= Debt to Equity Ratio; CR= Capital Ratio; TD/TE= Total Deposit to Total Equity; B/E= Business Per Employee; NP/E= Profit Per Employee; II/E= Interest Income Per Employee
The Return on Equity witnessed an increase from -5.19% to 3.43% in the post-merger period. Since ROE measures the amount of profit generated through shareholder’s invested equity, an increase in the ROE of a merged entity represents an improvement in the profitability of the company's shareholders' investments. This 166% increase in ROE could be attributed to the proper utilization of shareholder equity. Alternatively, BOB controlled its operational and other costs, increasing profit in the post-merger period.
The Return on Assets increased from -0.31% to 0.23% in the post-amalgamation period. In the context of a bank merger, ROA can provide insights into the efficiency and profitability of the merged entity's asset base. Here a higher ROA possibly indicates that the merged bank can better use its assets to generate profits than the individual banks were before the merger. This could be due to factors such as increased lending opportunities, cost savings from economies of scale, or better management of the asset portfolio.
Return On Capital Employed observed a minor increase from 1.57% to 1.81% in the post-amalgamation duration. Since ROCE measures the profitability of a company's capital investments, in the context of a bank merger, an increase in ROCE indicated that the merged bank can better utilize its capital resources to generate profits than the individual banks were before the merger. This could be due to increased efficiency, better risk management, or improved asset allocation.
The Net Interest Margin increased significantly from 2.0% to 2.47%. Since NIM calculates the difference between interest revenue from a bank’s assets and interest paid on its obligations. In the context of a bank merger, an increase in NIM can represent that merged bank is better able to manage its interest rate risk, optimize its asset and liability mix, and generated higher net interest income than the individual banks before the merger. This increase could be attributed to economies of scale, better pricing of loans and deposits, or improved risk management.
Post-merger, the average Earning per Share increased from Rs. -9.47 to Rs. 5.73, indicating that the merged bank is generating more profit per share for its shareholders than the individual banks were before the merger. Since EPS measures the value of profit earned by a company on each outstanding share of its common stock, an increase in EPS of the merged bank could be due to factors such as increased revenue, reduced expenses, improved efficiency, or better risk management.
The Spread Ratio (SPR) exhibited a significant (p < 0.05) increase from 32.35% to 41.23% after the merger. Since the spread ratio calculates the difference between the interest rates paid on deposits and other liabilities and the interest rates earned on loans and investments, an increase in the spread ratio in the context of a bank merger represents an improvement in the merged bank's ability to generate profits from its interest-bearing activities. This could be attributed to factors such as economies of scale or better pricing of loans and deposits.
The Ratio of Interest Expenses to Interest Income represents bank’s cost efficiency after merger. In Table 6, the results have shown a decrease in this ratio from 67.83% to 58.77%, indicating that the merger had a significant (p < 0.05) impact on the IE/II ratio. This means that the bank increased its interest expenses after the merger, which is a positive sign for improving the cost efficiency of banks post-M&A.
The Non-Interest Income to Total Assets increased from 0.88% to 0.97% during the post-amalgamation period, indicating positive growth. However, the impact of the merger on this growth ratio is insignificant (p > 0.05). The possible reason for this increase might be the bank’s diversification of its revenue streams and relying less on traditional lending and deposit-taking activities, or the bank sold off some of its assets, resulting in a decrease in the total assets but keeping its non-interest income constant, resulting in the ratio to increase.
Non-Interest Expenses to Total Income ratio witnessed a minor change, increasing from 44.89% in the pre-merger period to 45.81% post-merger. Though NIE/TI ratio increased by 2.06%, being an insignificant (p > 0.05) change, is not a good sign because it shows that a larger portion of the merged entity’s total income is being used to cover non-interest expenses. The possible reason for the increase in NIE/TI ratio could be an increase in operating costs (rising wages, rent, or marketing costs), inefficient cost management (excessive spending), lower profitability (increased competition), and an increase in business costs (increased employee cost) due to acquisition or expansion.
The Yield on Advances decreased from 12.44% to 11.60% post-amalgamation, indicating a statistically insignificant impact (p > 0.05) of the merger on the YOD. The reduction in YOD can be attributed to the non-optimum usage of advances after the merger, change in loan portfolio composition (merged entity having a larger proportion of lower-yielding loans), change in interest rates (merged entity wants to operate in low-interest environment), or integration challenges (systems integration, cultural differences, process changes, etc.).
The Yield on Investment also reduced from 36.44% to 29.71% after the merger, which was statistically significant (p < 0.05). However, this decrease is not a praiseworthy aspect of the merger. The possible reasons attributable to this decrease can be changes in investment portfolio (lower yield investments), challenges in integrating investment portfolios of merging banks, unfavorable market conditions (market volatility, interest rate shifts), and time lag effect (need more to realize the impact of merger completely).
The Ratio of Total Income to Total Assets decreased from 7.11% to 7.01% after the merger, which was, however, statistically insignificant (p > 0.05). Some possible reasons for the decrease in TI/TA could be reduced profitability (BOB is generating less income relative to the total size of its assets) or lower asset utilization (bank is not effectively utilizing its assets to generate income).
The Cash and Cash Equivalents to total assets ratio decreased from 18.17% to 10.18% after the merger, which was termed insignificant (p > 0.05) by the t-test. This reduction indicates that the proportion of cash and cash equivalents in the bank's total assets has reduced compared to what it was before the merger. The potential reasons for this decline could be attributed to the integration and restructuring costs (associated with integrating systems, processes, and personnel), loan write-offs, or fluctuations in the level of deposits or borrowings.
The Investment to Total Asset ratio showed an increase from 19.75% to 23.68%, which was, however, not a significant change (p > 0.05). The increase in I/TA could imply that the proportion of the bank's total assets allocated towards investments has increased compared to what it was before the merger. Possible reasons could be more investment in instruments such as stocks, bonds, or other securities. Additionally, changes in bank’s risk appetite, investment objectives, or market outlook also influence I/TA ratio.
The ratio of Total Liabilities to Total Assets witnessed a slight decrease from 94.06% to 93.47%, which was, however, a statistically insignificant difference (p > 0.05). This decrease in TL/TA ratio indicates that the increase in total assets is relatively more than the total liabilities. Moreover, the merged bank has been able to reduce its debt burden or liabilities due to the merger, possibly through debt repayment, restructuring, or other financial arrangements. This indicates a possible improvement in the financial health and reduced risk for the merged bank.
The Debt-to-Equity Ratio increased from 101.14% to 112.41% after the merger, which is, however, an insignificant change (p > 0.05). An increase in the debt-to-equity ratio implies an increase in the financial leverage for earning higher returns, advantages due to tax-deductible debt interests, and improved liquidity of the merged banks. However, it also increases financial risks, increases vulnerability in economic downturns, and reduces flexibility in operational decision-making.
The Capital Ratio increased from 5.94% to 6.53%, indicating that the capital adequacy or financial stability of banks has improved after the merger. Additionally, it indicates that BOB is now in a strong position to protect against operational losses.
A decrease in the ratio of Total Deposits to Total Equity from 1427.83% to 1263.03% (p < 0.05) was observed in the post-merger period. This would mean that the proportion of total deposits (liabilities) relative to total equity (shareholders' equity) has decreased in the merged bank compared to what it was before the merger. Moreover, the merged bank is relying relatively less on deposits and has a lower level of leverage compared to its equity capital after the merger. This decrease could be attributed to factors such as lower deposit growth (slower growth in its total deposit compared to its equity) or capital infusion (capital injection from the government, additional equity investment from shareholders, or retained earnings).
The Business Per Employee value exhibited an increase from Rs. 185746343 to Rs. 209482729, which is 1.127 times the value prior to the merger. Business per employee measures the amount of revenue generated by a company per employee. Since the merger of two banks leads to a change in the combined workforce and operations, the merged bank can generate higher revenue with the same or fewer employees than the sum of the individual banks, leading to higher business per employee of the merged entity. Hence, an increase in business per employee provides an insight into the efficiency and productivity of the merged bank and indicates that the merged bank is more efficient and productive than the individual banks were before the merger. This could be due to factors such as improved technology and automation (such as digitalization, automation, or optimization of operational processes), better utilization of resources, or streamlined processes (resulting from higher loan disbursements or increased customer deposits).
Profit Per Employee increased from Rs. -405158 to Rs. 361475 in the post-amalgamation duration. An increase in profit per employee refers to a situation where the combined bank generates higher profits for each employee after the merger than before. An increase in profit per employee assesses the efficiency of the merged entity, as a higher profit per employee indicates that the bank is generating more revenue while keeping its employee costs low. The possible reasons could be due to various factors, such as increased productivity, economies of scale, and streamlining of operations.
Interest Income Per Employee decreased from Rs. 8152116 to Rs. 6164966 after the merger, indicating that the merged entity is not generating as much revenue as expected. A decrease in interest income per employee could also indicate inefficiencies in the merged entity's operations, such as duplication of roles, ineffective lending practices, or inadequate risk management. Possible reasons could be a decline in the demand for loans or an increase in competition, adversely affecting the bank's ability to earn interest income.
Overall, the merger observed a positive impact on ROE (%), ROA (%), ROCE (%), NIM, EPS, SpR, IE/II (%), NII/TA (%), NIE/TI (%), I/TA (%), DE (%), CR (%), B/E, NP/E, and negative impact on YOD (%), YOI (%), TI/TA (%), C/TA (%), TL/TA (%), TD/TE (%), and II/E of the merged entity. The ratios where the merger failed to produce favorable results, there is a need for introspection. Strategies such as optimizing operating costs, improving the utilization of advances, adjusting interest rates, integrating systems effectively, creating better investment plans, and maximizing asset utilization to generate more income. Additionally, by controlling fluctuations in deposits and borrowings, the merged entity can enhance the chances of improved performance.
Conclusion
The present study employed a comprehensive approach, utilizing event study methodology, strategic similarity analysis, and ratio analysis, to meticulously investigate the case of consolidation of Vijaya Bank and Dena Bank (merged bank) with Bank of Baroda (acquirer bank). The study was concentrated around these banks because, firstly, all three banks were public sector banks; secondly, it was a government-forced merger; and thirdly, none of the recent studies investigated this mega-merger which resulted in the creation of one of the top three largest public sector banks in India. Hence, through short- and long-term comprehensive investigation, this article contributes to the body of knowledge significantly.
The results from the event study methodology revealed a positive reaction by the shareholders of Bank of Baroda, as evidenced by the CARs value, in response to the merger announcement. These findings are congruous with the outcomes of, and but contradict the findings of, where the announcement of the merger did not elicit a favorable response from the shareholders. The study employed a meticulous strategic similarity analysis, and the findings were consistent with that of, where the relative size of the target, cost-earnings ratio, liquidity ratio, diversified income, and loan-deposit ratio variables exhibited an improvement in the performance, thus, confirming the merger compatibility of these banks.
Furthermore, the results of the ratio analysis were in alignment with the strategic similarity analysis, as both approaches corroborated the improved performance of Bank of Baroda following the merger. Empirical evidence unequivocally validates that Bank of Baroda has demonstrated an improved financial performance after the merger, indicating that the merger of two smaller distressed banks, viz. Dena and Vijaya Bank did not adversely impact the performance of BOB. Several key ratios, such as profitability ratios, efficiency ratios, leverage ratios, and employee performance ratios, all exhibited a positive trend in the post-merger period, indicating improved performance. These findings are consistent with the research of, who also observed the positive impacts of mergers on the long-term financial performance of banks. However, our results contrast the findings of, who observed a deterioration in the post-amalgamation performance of Pakistan’s Banks.
In summary, the performance of Bank of Baroda is concluded to have improved post-amalgamation. Moreover, the positive outcomes of this merger suggest that the mergers of distressed banks with healthy banks could result in fair chances of improved efficiency of the merged entity in the short- and long-term. A sensible and compatible merger could further result in an increased scale of operations, more efficient business strategies adoption, and geographical diversification. The methodology employed in this study for comprehensive analysis holds immense potential for policymakers and investors in predicting the outcomes of mergers and acquisitions with greater accuracy. Specifically, for prospective acquirer banks, strategic similarity analysis can aid in identifying suitable banks for potential mergers. Additionally, ESM can provide a better understanding of the probability of abnormal returns in the short term, while ratio analysis can offer a means to assess long-term financial performance. As such, this study serves as a reference for policymakers, research analysts, academicians, and practitioners for providing guidance and designing & refining corporate restructuring strategies.
Limitations and Scope for Further Research
This study focused solely on one merger, and therefore, caution must be exercised in generalizing the findings to other bank mergers. Furthermore, it is important to acknowledge that the tools and techniques employed in this study have their inherent limitations. To enhance the scope and robustness of future research, it could be beneficial to expand the analysis to encompass multiple bank mergers, longer periods, and diverse analysis techniques. Additionally, comparing merger outcomes across different industries could provide valuable insights. While this study is limited to the banking sector in India, there are numerous other sectors where this research could be extended. Future research may explore cross-broader mergers and acquisitions in various industries as well.
Declaration of Conflicts of Interest
The authors declare that they have no known competing financial interests or personal relationships that could have appread to influence the work reported in this paper.
FundingThis research did not receive any specific grant from funding agencies in the public, commercial, or not-for-profit sectors.
References
Abbas, Q., Hunjra, A. I., Azam, R. I., Ijaz, M. S., & Zahid, M. (2014). Financial performance of banks in Pakistan after Merger and Acquisition. Journal of Global Entrepreneurship Research, 4(1), 1–15.
Indexed at, Google Scholar, Cross Ref
Abbas, Q., Hunjra, A. I., Saeed, R., Hassan, E. U., & Ijaz, M. S. (2014). Analysis of Pre and Post Merger and Acquisition Financial Performance of Banks in Pakistan. Journal of Banking and Finance, 28(10), 177–190.
Indexed at, Google Scholar, Cross Ref
Aggarwal, P., & Garg, S. (2019). Impact of Mergers and Acquisitions on Accounting-based Performance of Acquiring Firms in India. Global Business Review, 23(1), 218–236.
Altunbas, Y., & Marqués, D. (2008). Mergers and acquisitions and bank performance in Europe: The role of strategic similarities. Journal of Economics and Business, 60(3), 204–222.
Anand, M., & Singh, J. (2008). Impact of Merger Announcements on Shareholders’ Wealth: Evidence from Indian Private Sector Banks. Vikalpa, 33(1).
Indexed at, Google Scholar, Cross Ref
Antoniadis, I., Alexandridis, A., & Sariannidis, N. (2014). Mergers and Acquisitions in the Greek Banking Sector: An Event Study of a Proposal. Procedia Economics and Finance, 14, 13–22.
Indexed at, Google Scholar, Cross Ref
Babu, M. R. (2019). Research on Profitability And Liquidity Position of Banks With Reference To Pre And Post-Merger. International Journal of Recent Technology and Engineering (IJRTE), 8(1S4).
Balasubramanian, S. (2022). A Review of the Pre-merger Performance of Select Public Sector Banks in India Using Key Performance Indicators. In A. Chandani, R. Divekar, J. K. Nayak, & K. Chopra (Eds.), Pandemic, New Normal and Implications on Business (pp. 73–86). Springer Nature.
Fama, E. F. (1976). Foundation of finance. Basic Books.
Financial Bank of Baroda Balancesheet. (n.d.). Moneycontrol.Com.
Herwadkar, S. S., Gupta, S., & Chavan, V. (2022). Do Bank Mergers Improve Efficiency? The Indian Experience. Reserve Bank of India Occasional Papers, 43(1).
Jasrotia, S. S., & Agarwal, T. (2020). Consolidation of Indian PSU banks and the way forward. Journal of Public Affairs, 21(1).
Indexed at, Google Scholar, Cross Ref
Joshipura, M., & Panda, M. (2019). Effect of mergers and acquisitions on short-term gain to equity shareholders of acquiring firms in India. Afro-Asian Journal of Finance and Accounting, 9(1), 1–20.
Indexed at, Google Scholar, Cross Ref
Khushalani, D., & Sinha, M. (2021). Pre-and Post-Merger Financial Analysis of Banks. Universal Journal of Accounting and Finance, 9(6), 1247–1257.
Kumar, B. R., & Suhas, K. M. (2010). An analytical study on value creation in Indian bank mergers. Afro-Asian Journal of Finance and Accounting, 2(2), 107–134.
Indexed at, Google Scholar, Cross Ref
Kumar, M., Kumar, S., & Morandiere, L. P. D. La. (2011). “Relationship between merger announcement and stock returns: evidence from Indian banking.” Banks and Bank Systems, 6(4).
Kumar, R. (2009). Post-merger corporate performance: An Indian perspective. Management Research News, 32(2), 145–157.
Indexed at, Google Scholar, Cross Ref
Kumar, S., & Bansal, L. K. (2008). The impact of mergers and acquisitions on corporate performance in India. Management Decision, 46(10), 1531–1543.
Indexed at, Google Scholar, Cross Ref
Kuriakose, S., & Paul, J. (2016). Strategic and financial similarities of bank mergers. Review of International Business and Strategy, 26(1), 50–68.
Louhichi, W. (2008). Adjustment of stock prices to earnings announcements: Evidence from Euronext Paris. Review of Accounting and Finance, 7(1), 102–115.
Indexed at, Google Scholar, Cross Ref
Mall, P., & Gupta, K. (2019). Impact of Merger and Acquisition Announcements on Stock Returns and Intraday Volatility: Evidence from Indian Banking Sector. Journal of Entrepreneurship & Management, 8(3).
Mallikarjunappa, T., & Nayak, P. (2013). A Study of Wealth Effects of Takeover Announcements in India on Target Company Shareholders. Vikalpa, 38(3).
Indexed at, Google Scholar, Cross Ref
Martynova, M., & Reneeboog, L. (2006). Mergers and acquisitions in Europe. In L. Reneeboog (Ed.), Advances in Corporate Finance and Asset Pricing (pp. 13–75). Elsevier.
Meenakshisundaram, K. S., & Kannan, A. S. (2020). Bank of Baroda Merger in India: Pre-Merger Scenario Analysis. International Journal of Advanced Science and Technology, 29(3), 3935–3944.
Montgomery, H., & Takahashi, Y. (2014). The Effect of Bank Mergers on Shareholder Value and Performance in Japan. In D. Lee & G. N. Gregoriou (Eds.), Handbook of Asian Finance: Financial Markets and Sovereign Wealth Funds (Vol. 1, pp. 77–103). Elsevier Inc.
Patel, R. (2018). Pre & Post-Merger Financial Performance: An Indian Perspective. Journal of Central Banking Theory and Practice, 3(540), 181–200.
Ramaswamy, K. (1997). The Performance Impact Of Strategic Similarity In Horizontal Mergers: Evidence From The U.S. Banking Industry. Academy of Management Journal, 40(3), 697–715.
Rani, N., Yadav, S. S., & Jain, P. K. (2015). Financial performance analysis of mergers and acquisitions: evidence from India. International Journal of Commerce and Management, 25(4), 402–423.
Indexed at, Google Scholar, Cross Ref
Rani, N., Yadav, S. S., & Jain, P. K. (2016). Mergers and Acquisitions (1st ed.). Springer Singapore.
Rashid, A., & Naeem, N. (2017). Effects of mergers on corporate performance: An empirical evaluation using OLS and the empirical Bayesian methods. Borsa Istanbul Review, 17(1), 10–24.
Indexed at, Google Scholar, Cross Ref
Saha, A., & Dash, U. (2016). Consolidation in Indian banking: Does size matter? DECISION, 43, 223–238.
Shah, B. A., & Khan, N. (2017). Impacts of Mergers and Acquisitions on Acquirer Banks’ Performance. Australasian Accounting, Business and Finance Journal, 11(3), 30–54.
The Times of India. (2018, September 17). Government to merge Bank of Baroda, Vijaya Bank, Dena Bank. The Times of India.
Uddin, M., & Boateng, A. (2009). An analysis of short-run performance of cross-border mergers and acquisitions Evidence from the UK acquiring firms. Review of Accounting and Finance, 8(4), 431–453.
Indexed at, Google Scholar, Cross Ref
Vulanovic, M. (2017). SPACs: post-merger survival. Managerial Finance, 43(6), 679–699.
Indexed at, Google Scholar, Cross Ref
Wajid, A., Singh, H., & Ansari, A. A. (2019). Corporate Restructuring through Mergers: A Case of ICICI Bank. Indian Journal of Finance, 13(8), 38–50.
Indexed at, Google Scholar, Cross Ref
Received: 14-Feb-2024, Manuscript No. AMSJ-24-14501; Editor assigned: 15-Feb-2024, PreQC No. AMSJ-24-14501(PQ); Reviewed: 30- Mar-2024, QC No. AMSJ-24-14501; Revised: 29-Jun-2024, Manuscript No. AMSJ-24-14501(R); Published: 10-Jul-2024