Research Article: 2021 Vol: 20 Issue: 6S
Level of Guest Satisfaction in Table Manner Event at Management of Food and Beverage Division Course
Lise Asnur, Universitas Negeri Padang
Nizwardi Jalinus, Universitas Negeri Padang
Anni Farida, Universitas Negeri Padang
Asmar Yulastri, Universitas Negeri Padang
Keywords
Table Manners, Satisfaction, Quality
Abstract
The purpose of this study was to test and analyze 1) quality of waiter/waitress service at the Table Manner Event, 2) quality of the equipment and its accessories, 3) instructor of Table Manners, 4) event rundown, 5) room design, 6) quality of the dish and 7) event setting. This research used descriptive methods with quantitative data. The research sample was 47 people taken using a saturated sampling technique. The results of data analysis showed that all variables had a positive effect on the level of satisfaction of the guest at Table Manner Event. Implications of this study, the Table Manner committee must pay attention to five service indicators on service quality, so that guest satisfaction is met guests’ expectations.
Introduction
In the world of tourism, what is needed is accommodation; examples of accommodation needed are hotels, resorts, and other similar businesses. Based on the Decree of the Minister of Tourism, Post and Telecommunications Number Km 94/HK103/MPPT 1987, it states that the hotel is one type of accommodation that uses part or all of the parts for lodging services, providing Food and Beverages and other services for the general public which are managed commercially (Tassiopoulos, 2011; Jaelani, 2017).
Hotel is one of the companies that need the service of Food and Beverages (Gundersen et al., 1996). The Food and Beverage Department is divided into two, i.e., Food and Beverage Products and Food and Beverage Service. According to Gustia Buted, et al., (2014), the understanding of the Food and Beverages product department is one of the departments in the hotel responsible for providing Food and Beverage facilities. Moreover, According to Kemala, et al., (2020), "Food and Beverage service is a part of the charge and responsible for Food and Beverage services for guests". According to Otles & Sakalli (2019), foodservice is the availability of Food and Beverage menus that are served by the technique or arrangement according to the presentation etiquette until they are ready for consumption. In serving the guests, waiters/waitresses need supporting equipment to do table set up. in principle, table set up is to arrange and complete food equipment such as: how to install Tablecloths, spoons, forks, knives, glasses, for example, wine glasses, glasses for mineral water and other equipment including flower vases, ashtrays, table numbers, places for salt and pepper, napkin and other equipment on the dining Table in a balanced, harmonious and beautiful so it is ready to be used to enjoy certain types of dishes (Rasheed, 2015; Aggarwal, 2014).
Event is an activity that aims to commemorate which is essential in individual life and groups based on tradition, religion, customs, and culture, and involve the environment of society at a particular time (Van Zyl, 2005). One of the events related to Food and Beverage is Table Manners. Table Manner is an activity that is designed such a way as to provide direction to participants who take part in the activity, regarding proper eating procedures (Von Drachenfels, 2000; Silvers, 2012).
The Table Manner Event was carried out as a requirement to meet the Food and Beverage Division Management course, and this course was taken by students of the Hospitality Management Study Program (MPH) of Universitas Negeri Padang Academic Year 2017. The purpose of this event was to learn how to create a proper Event. It also trains the student team to works in holding this event. In this event, all the committee members are the 2017 MPH students, and the guests are MPH 2019 and the public. The evaluation of this event was carried out by guests in the Table Manner by giving a guest comment on the link provided. This assessment includes the arrangement of the program displayed, the instructions Table Manner, the timing of the event, the service waiter, the room design, the quality of the dishes, and the serving equipment.
Research Methods
This research belongs to causal associative research by linking cause and effect between two or more variables (Noor, 2008). Variables analyzed included; guest satisfaction, Food and Beverage, service, equipment. The type of data used was quantitative. In this study, quantitative data was in the form of guest comment participants in Table Manner hospitality management 2017. The techniques of data collection used were a questionnaire (questionnaire), which was arranged according to the Likert scale. The population in this study was all participants of the 2017 MPH Table Manner Event for 100 participants. The sampling technique was a saturated sampling technique, which is a sampling technique when all members of the population are used as samples. The classification techniques used, according to Arikunto (2010), are:
Very good category : ≥ (Mi +Sdi1,5) –to
Good category : (Mi+0.5 Sdi) - <(Mi+1,5 Sdi)
Normal category : (Mi - 1.5 Sdi) - <(Mi - 0.5 Sdi)
Bad category : <(Mi - 1,5 Sdi)- down
Hypothesis testing was used to determine the effect of independent variables with the dependent variable using a simple linear regression test.
Results and Discussion
Service Quality of Waiter/Waitress
Service is an activity or a series of invisible activities that occur due to interactions between consumers and employees or other rights provided by service providers intended to solve the problems of consumers or customers (Suminar, 2015). A waiter or waitress is a person who is responsible for serving Food and Beverages in a restaurant or bar. Meanwhile, according to (Putra, 2017) waiters are waiters who are in charge of waiting for guests, serving Food and Beverage orders, and serving Food and Beverages. After obtaining a statistic count of the service quality variable waiter/waitress at the timeTable Manner, then the description of the assessment category of the results of the study, as shown in Table 1.
| Table 1 Classification Score of the Service Quality Variable Waiter/Waitress |
||
|---|---|---|
| Category | F | Percentage |
| Very Good | 29 | 61.70% |
| Good | 17 | 36.20% |
| Normal | 1 | 2.10% |
| bad | 0 | 0% |
| Total | 47 | 100 |
Figure 1. Diagram of the percentage of waiter/waitress service quality
Based on the Table and diagram above, it can be seen that the highest percentage of services is very good at 61.7%.
Quality of the Equipment
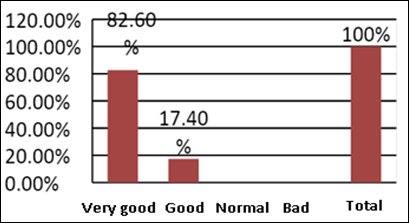
Equipment served as a tool used to serve food on the dining table, consisting of glassware (chinaware), glass (glassware), Table accompaniment, and other equipment (other equipment) used in serving food. Foodservice tools used in the event are Table Manner divided into three types of tools based on the primary material of manufacture, i.e., 1) Chinaware: It is a ceramic tool made of clay that has been through a process of heating with high temperatures; 2) Silverware: is a tool made from silver and stainless stee, and 3) Glassware: is a serving device used to serve beverages that are not hot and made of glass. Glassware used during Table Manner, i.e.,: water goblet is a glass used to present mineral water. After calculating the statistics on the quality of the tools at the time of the Table Manner, the description of the assessment results of the research results is shown in Table 2.
| Table 2 Classification of the Score of the Quality of the Tools in the |
||
|---|---|---|
| Category | F | Percentage |
| Very Good | 38 | 82.60% |
| Good | 8 | 17.40% |
| Ordinary | 0 | 0% |
| poor | 0 | 0% |
| Total | 46 | 100% |
Based on the Table and diagram above, can be seen that the highest percentage is on the quality of the serving equipment, which is very well at 82.6%.
Table Manners Instructor
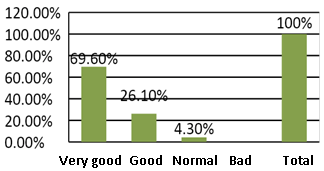
The instructor is the person in charge of teaching something and provides exercise, guidance, and instruction that are necessary for the event Table Manners. After calculating the instructor variable Table Manner, the description of the assessment results of the study results is shown in Table 3. (Figure 2)
| Table 3 Classification Score of Instructor Variable Table Manners |
||
|---|---|---|
| Category | F | Percentage |
| Very Good | 32 | 69.60% |
| Good | 12 | 26.10% |
| Normal | 2 | 4, 3% |
| Bad | 0 | 0% |
| Total | 46 | 100% |
Based on the Table and diagram above, the highest percentage is in the instructor of Table Manners is very good at 69.6%.
Event Rundown
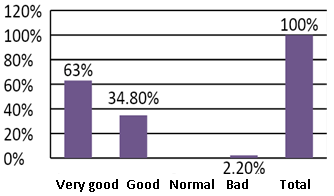
Event rundowns are a systematic program arrangement of an event that is limited by duration. After calculating the event rundown variable statistics, the description of the assessment results of the research results is shown in Table 4: (Figure 3)
| Table 4 Classification Score of the Rundown Variable Event |
||
|---|---|---|
| Category | F | Percentage |
| Very Good | 29 | 63% |
| Good | 16 | 34.80% |
| Normal | 0 | 0% |
| bad | 1 | 2, 2% |
| Total | 46 | 100% |
Based on the Table and diagram above, highest percentage of event rundown is very good at 63%.
The Setting of the Event Time and the Event
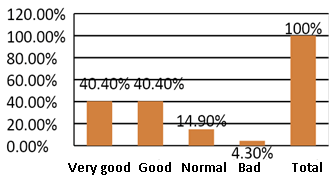
Time is aimed at making the pickles arranged more orderly, neat, and systematic. After calculating the statistics of the event time setting the variable, the description of the results of the study evaluation categories is shown in Table 5: (Figure 4)
| Table 5 Classification of the Score of the Event Time Setting Variable |
||
|---|---|---|
| Category | F | Percentage |
| Very good | 19 | 40.40% |
| Good | 19 | 40.40% |
| Ordinary | 7 | 14.90% |
| bad | 2 | 4.30% |
| Total | 47 | 100% |
Based on the Table and diagram above, the highest percentage can be seen in the timing of the event is very good and has a good percentage of 40.4%.
Room Design
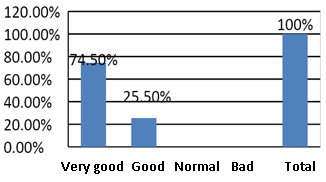
Interior design is one of the things that is quite important in the design of a building, especially in this case is the design of an event. After calculating the statistics of the room design variables, the description of the results of the research assessment categories is shown in Table 6 : (Figure 5)
| Table 6 Classification Score of Variable the Room Design |
||
|---|---|---|
| Category | F | Percentage |
| Very Good | 35 | 74.50% |
| Good | 12 | 25.50% |
| Normal | 0 | 0% |
| bad | 0 | 0% |
| Total | 47 | 100% |
Based on the Table and diagram above, the highest percentage in the room design is very good at 74.5%.
The Results of the Study of the Quality of the Dishes
The Table Manner consists of several menu stages that are served, ranging from appetizers to the dessert stage (dessert).
Appetizer: Definition Appetizer is an appetizer that is served on the first turn in a continental dish that serves as an appetite generator.
Soup: According to Setiawati (2017), Soup is a liquid food whose liquid is made from broth derived from chicken, meat, fish, and shrimp, which is added with herbs and aroma.
Main Dish (Main Course): According to Minantyo (2011), Main course was the main course with the most considerable portion of the set menu, which is served after the appetizer and before dessert. In the settings menu is not just an appetizer (not to excite the appetite), but serves as a dish that must satisfy the appetite/filling. Various kinds of sauces that can be used as a complement to the main course, according to Putri (2014), i.e., 1) Demiglace (base sauce chocolate); 2) Tomato sauce (tomato-based sauce); 3) Mayonnaise (sauce oil-based); 4) Béchamel (white base sauce); 5) Hollandaise sauce (sauce base butter).
Dish Cover (Dessert): According to Wijoyo (2014), Dessert was a dish that was served as a dessert or at the end of a dinner buffet or a la carte nature and tastes delicate and sweet and can be served cold or hot.
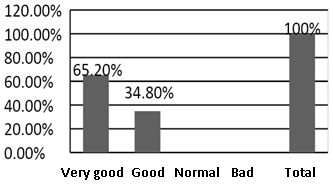
Restaurant in improving the quality of a dish, it is better to maintain the hygiene and sanitation of the food. According to Huda (2015), Sanitation is the creation and maintenance of hygienic and healthy conditions. Food hygiene is all conditions and measures needed to ensure food safety and suitability at all stages of the food chain. After calculating the statistics of the quality variables of the dish, the description of the assessment results of the study results is shown in Table 7: (Figure 6)
| Table 7 Classification Score of the Variable Quality of the Dish |
||
|---|---|---|
| Category | F | Percentage |
| Very good | 30 | 65.20% |
| Good | 16 | 34.80% |
| Ordinary | 0 | 0% |
| bad | 0 | 0% |
| Total | 46 | 100% |
Based on the Table above, can be seen that the highest percentage of the quality of the dishes is very good at 65.2%.
Conclusion
Based on the analysis of the data above, it can be stated that the level of guest satisfaction on service quality waiter /waitress, on the quality of the equipment, instructor of Table Manners, Event rundowns, setting the time of the event, room design, and quality of the dishes on the Table Manner Event shows the interpretation of the percentage of guest ratings dominantly classified as very good. A discussion was made about the level of guest satisfaction at the Event Table Manner, getting the highest percentage of 65.3% with an excellent category. It can be concluded that the level of guest satisfaction at the Table Manner Event is very good. Research on guest satisfaction at the Table Manner Event above is proper. From the above indicators, it can be seen that guest satisfaction has been achieved. Following the opinion of Guest Satisfaction, according to Ramadani, et al., (2016), is "a level where the needs, desires, and expectations of customers or guests can be met, which will result in repeat purchases or continued loyalty." While the quality of service, according to Ramadani, et al., (2016), "service quality is a measure of how good the level of service provided following customer expectations. Based on the analysis of the data above, it can be stated that the level of guest satisfaction on service quality waiter /waitress, on the quality of the equipment, instructor of Table Manners, Event rundowns, setting the time of the event, room design, and quality of the dishes on the Table Manner Event shows the interpretation of the percentage of guest ratings dominantly classified as very good. A discussion was made about the level of guest satisfaction at the Event Table Manner, getting the highest percentage of 65.3% with an excellent category. It can be concluded that the level of guest satisfaction at the Table Manner Event is very good. Research on guest satisfaction at the Table Manner Event above is proper. From the above indicators, it can be seen that guest satisfaction has been achieved. Following the opinion of Guest Satisfaction, according to Ramadani, et al., (2016), is "a level where the needs, desires, and expectations of customers or guests can be met, which will result in repeat purchases or continued loyalty." While the quality of service, according to Ramadani, et al., (2016), "service quality is a measure of how good the level of service provided following customer expectations.
References
- Aggarwal, N. (n.d.). Paper 05: Food and beverage service module 24: Whisky. Doctoral dissertation, HNB Garhwal University.
- Arikunto, S. (2010). Research procedure a practical approach. Jakarta: Rineka Cipta.
- Buted, D.R., Felicen, S.S., & Manzano, A.I. (2014). A correlation study between student performance in food and beverage services course and internship in F & B department of the hospitality business. International Journal of Academic Research in Business and Social Sciences, 4(6), 54.
- Dwi Putra, B.Y. (2017). The role of the waiter or waitress in serving guests in canting Restaurant Atria Hotel Malang Gundersen.
- Gundersen, M.G., Heide, M., & Olsson, U.H. (1996). Hotel guest satisfaction among business travelers: what are & important factors? Cornell hotel and restaurant administration quarterly, 37(2), 72-81.
- Heide, H.G., & Olsson, U.H. (1996). Hotel guest satisfaction among business travelers: What are the important factors? Cornell Hotel and restaurant administration quarterly, 37(2), 72-81.
- Huda, S. (2015). Efforts for food & baverage products in improving the quality of food at the Grand Aston Hotel, Yogyakarta. Treasures of Science-Journal of Tourism and Culture, 6(1).
- Jaelani, A. (2017). Halal tourism industry in Indonesia: Potential and prospects. International Review of management and Marketing, 7(3).
- Kemala, Z., Fajri, K., & Maulani, S.N. (2020). Communication in the hospitality industry: Azzuma Korean Restaurant in Malaysia. Tourism and Sustainable Development Review, 1(1), 49-56.
- Muhaimin, A.W., & Yapanto, L.M. (2020). Marketing strategy based on analysis of marketing mixture on consumer purchase decisions in the area of dermo café coffee, Malang, Indonesia. (16174).
- Minantyo, H. (2011). Food processing basics (Food Product Fundamental).
- Muhaimin, A.W., Toiba, H., Retnoningsih, D., & Yapanto, L.M. (2020). The impact of technology adoption on income and food security of smallholder cassava farmers: Empirical Evidence from Indonesia, 29(9), 699–706.
- Noor, K.B.M. (2008). Case study: A strategic research methodology. American journal of applied sciences, 5(11), 1602-1604.
- Rawung, J.B.M., Sahara, D., Indrasti, R., Fadwiwati, A.Y., & Yapanto, L.M. (2021). Increasing fruit yields and income of red chili farming by using chemical and biological fertilizers in rainfed rice, 20(2), 1–10.
- Setiawan, R., Pio, L., Cavaliere, L., Sankaran, D., Rani, K., Yapanto, L. M., … & Foggia, U. (n.d.). Access to financial services and women empowerment, through microfinance eligibility, 1, 841–859.
- Sahara, D., Hartoyo, B., Fadwiwati, A.Y., Yapanto, L.M., Science, M., & Indrasti, R. (2021). The improvement production and efficiency of upland rice in boyolali district central java, Indonesia, 20(2).
- Otles, S., & Sakalli, A. (2019). Industry 4.0: The smart factory of the future in the beverage industry. In production and management of beverages, 439-469, Woodhead Publishing.
- Putri, A.A., Nurani, A.S., & Nurhayati, A. (2014). The benefits of learning outcomes "knowledge of food ingredients" in the practice of "making main course from seafood". Media Education, Nutrition, and Culinary, 3(1).
- Ramadani, B., Kasmita, K., & Yuliana, Y. (2016). The influence of the quality of waiter/waitress service on guest satisfaction at d'cafe restaurant at hotel axana padang. E-Journal Home Economic and Tourism, 11(1).
- Rasheed, K.O. (2015). Product Package as determinant of brand loyalty in food and beverages markets of lagos state, Nigeria. American Journal of Marketing Research, 1(3), 150-157.
- Setiawati, T., & Sudewi, S. (2017). The benefits of learning outcomes "Knowledge of Food Ingredients" in the Practice of "Making Main Course From Seafood". Media Education, Nutrition, and Culinary, 9(1), 1-6.
- Silvers, J.R. (2012). Professional event coordination, 62, John Wiley & Sons.
- Suminar, R., & Apriliawati, M. (2018). Excellent service to parents of students at abacus sip tc paramount summarecon. Pamulang University Secretariat Journal, 4(2), 25.
- Wijoyo, T.A. (2014). The effect of chocolate garnish on black forest as a dessert on guest satisfaction at the graha santika hotel semarang. Gemawisata: Scientific Journal of Tourism, 11(1).
- Tassiopoulos, D. (2011). New tourism ventures: An entrepreneurial and managerial approach. Juta and Company Ltd.
- Van Zyl, C.J. (2005). The role of tourism in the conservation of cultural heritage with particular relevance for South Africa (Doctoral dissertation, Stellenbosch: University of Stellenbosch).
- Von Drachenfels, S. (2000). The art of the table: A complete guide to table setting, table manners, and tableware. Simon and Schuster.
- Setiawan, R., Pio, L., Cavaliere, L., Sankaran, D., Rani, K., Yapanto, L.M., … & Foggia, U. (n.d.). Access to financial services and women empowerment, through microfinance eligibility, 1, 841–859.
- Kankaew, K., Yapanto, L.M., Waramontri, R., & Arief, S. (2021). Uncertain supply chain management supply chain management and logistic presentation: Mediation effect of competitive advantage. 9, 255–264. https://doi.org/10.5267/j.uscm.2021.3.007
- Dextre-martinez, R., Zukhruf, A., & Villanueva-benites, L.A. (2021). The effect of CRM on employee performance in banking industry, 9, 295–306. https://doi.org/10.5267/j.uscm.2021.3.003
