Research Article: 2025 Vol: 29 Issue: 4
Integrating FinBERT Sentiment with Financial Stress for Optimized Portfolio Performance
Sakshi Pandey, Indian Institute of Information Technology Allahabad, Prayagraj, UP
Ranjit Singh, Indian Institute of Information Technology Allahabad, Prayagraj, UP
Suman Agarwal, Assam Royal Global University Guwahati, Assam
Nitesh Kumar Shah, Indian Institute of Information Technology Allahabad Prayagraj, UP
Citation Information: Pandey, S., Singh, R., Agarwal, S., & Kumar Shah, N. (2025). “Integrating finbert sentiment with financial stress for optimized portfolio performance". Academy of Marketing Studies Journal, 29(4), 1-17.
Abstract
This paper introduces an advanced investment strategy for the equity markets, combining a proprietary financial stress index with sentiment analysis conducted using FinBERT, a Bidirectional encoder representation from the Transformers model adapted specifically for financial contexts in deep learning. We analyze sentiments on financial news from HuffPost from 2012 to 2024. Integrating these sentiment analyses into our investment strategy via stress indices significantly improves market forecast accuracy and portfolio performance, achieving higher ratios, and reducing maximum drawdowns compared to conventional strategies. This paper highlights the power of combining advanced machine learning models with extensive financial news data to develop a dynamic trading strategy adaptable across various equity markets. The improved performance is consistent across the NASDAQ, the S&P 500, and the MSCI Global Investment index, indicating that the method generalizes for forecasting and portfolio optimization.
Keywords
Sentiment Analysis, Financial Bidirectional encoders for representation of Transformers, Equity Markets, Market Stress Indicator, Investment Strategy, HuffPost.
Introduction
There are volatilities and complexities in a stock market driven by several factors that can cause rapid fluctuations in the market. These complexities are caused by several economic indicators, market volatility, geopolitical events, technology developments, legal environments, investor behavior, global links, and data overload (Singh, 2010; Chen, 2021). Traditional investment strategies often depend predominantly on past financial data and macroeconomic indicators and are gradually becoming less effective in this increasingly dynamic landscape (Fischer & Merton, 1984). As a result, the need for sophisticated predictive models that can manage the complexity and volatility of financial markets is higher than ever (Farmer et al., 2012). There are several ways of dealing with financial market intricacies, including fundamental analysis, technical analysis, and quantitative modeling. Sentiment analysis is distinct because it can capture market sentiment and investor attitudes in real-time. When integrated with financial stress indices, it improves market prediction, improves risk management, effectively mitigates portfolio risks, and offers a forward-looking paradigm for guiding stock market strategies (Singh and Bhowal, 2010; Singh and Bhowal, 2011; Huang et al., 2023). To better grasp market sentiment, models must go beyond quantitative variables and encompass qualitative variables like public and investment sentiment. Qualitative data are required because they quantify emotional and psychological measures and give us real-time information that cannot be quantified by using quantitative data (Akter et al., 2019).
Sentiment analysis is effective because it enables us to quantify investor sentiment and public opinion, which are the primary drivers of market volatility (Pang & Lee, 2008). Financial news sentiment analysis offers real-time market trends rather than social media sentiment, which fails to reflect accurate market behavior (Khan et al., 2024). A financial stress index is a composite indicator that measures systemic risk by summing different financial market indicators, including interest rate spreads, exchange rates, and stock market returns (Hollo et al., 2012). This index helps predict economic uncertainty and enhance financial decision-making. Recent studies underscore sentiment analysis as a crucial area in the financial market. A concrete example is a survey carried out by JP Morgan and Queen's University in which the authors proved that the FinBERT model outperforms the ChatGPT model and several other models for financial sentiment analysis (Li et al., 2023).
This paper underscores the requirement for domain-specific models like FinBERT to fine-tune financial language and obtain more precise sentiment readings of financial news and reports. Certainly, the present study supports a broader trend of literature that suggests the value of specialized models toward enhancing the accuracy of market sentiment analysis (Hollo et al., 2012; Pang & Lee, 2008). Such models are combined with a financial stress index, which combines numerous financial indicators, such as exchange rates, stock market returns, and interest rate spreads, to measure systemic risk. This offers portfolio management strategies, improving predictability and modeling of future markets.
This paper aims to improve market forecasting through the integration of sentiment analysis and financial stress indices. This is due to the failure of the conventional model to capture real-time market sentiment and perceptions effectively (Singh and Bhattacharjee, 2019). We collected and pre-processed data on financial news articles from HuffPost for a period of twelve years (2012-2024). Since its inception, HuffPost Financial News has been a superhighway of information on the financial market, providing relevant and contemporaneous information. With a vast reach and audience impact, HuffPost is a significant financial news source. This twelve-year dataset was chosen as it captures an entire economic cycle, ensuring a strong basis for sentiment analysis. This research study aims to develop an advanced investment strategy leveraging sentiment analysis on financial news and financial stress index for better market prediction and portfolio management. FinBERT is a machine-learning model that can process and analyze the sentiment of the sentiment-laden news data collected (Costola et al., 2023). FinBERT was selected for the study because it is superior in understanding and interpreting financial text than other models (Liu et al., 2020). whereas other models, including Bidirectional encoder representations from transformers, LSTM, and Generative Pretrained Transformer 3 (GPT-3), among others, FinBERT is more accurate and efficient, trained explicitly for financial language
tasks (Bharathi Mohan et al., 2024). A financial stress index that considers macroeconomic variables, credit spreads, liquidity ratios, and volatility indices has been constructed (MacDonald et al., 2018). Sentiment data and the financial stress index are integrated into a single investment strategy (Hollo et al., 2012). Experiments have been conducted to ascertain how effective this combined approach is for predicting stock market movement and managing portfolio performance (Huang et al., 2005). Integration of financial stress indices with sentiment analysis forms the unique contribution of this study to the literature. The new market prediction approach could improve investment decision-making processes and risk management practices (Jin et al., 2020). The findings have significant implications for investors, portfolio managers, and financial analysts seeking to improve their market strategies in a more uncertain and complicated financial landscape (Zahra, 1996). This study illustrates the effectiveness of integrating sentiment analysis with financial stress indices to develop a dynamic and adaptive trading strategy. By extensive experimentation and analysis, this research offers pragmatic insights into the combined approach to enhancing market forecasting accuracy and achieving superior risk-adjusted returns (Deep, 2024). This research addresses the following key questions:
1. How can sentiment analysis from financial news enhance traditional investment strategies?
2. How does incorporating a financial stress index impact market prediction accuracy?
3. Can the combined use of sentiment analysis and stress indices provide better risk-adjusted returns?
Literature Review
Combining sentiment analysis with financial stress indices has gained considerable interest in the recent years because of its ability to optimize stock market strategies (Kamal et al., 2022). Extensive text analysis, together with a financial stress index, provides a more precise identification of systemic risk, enhances market sentiment assessment, improves knowledge about market dynamics El-Hajj et al., (2019), and helps create smart investment strategies that can change with market movements (Moore & Manring, 2009). A financial stress index integrates more than one measure for various financial market indicators to show the financial system's stress level (Ishrakieh et al., 2020). An index is mostly for measuring systemic risk and predicting the possible financial crisis through the movement of interest rate spreads, the performance of stock markets, and others (Rossi, 2021). As a financial text mining algorithm, FinBERT is one of the best Sentiment Analysis methods for applying sentiment evaluation in financial contexts (Arslan et al., 2021; Huang et al., 2023). Analyzing extensive text data and using financial stress indices to ascertain systemic risk enhances market sentiment assessment, and this integration has improved our understanding of market dynamics.
In addition, Hugging Face, the open-source NLP library, offers advanced tools and models for different NLP tasks (Wolf et al., 2020). Among different Hugging Face pre-trained models, BERT, GPT-3, and FinBERT are prominently used for sentiment analysis, text classification, and general language generation tasks (Leippold, 2023). It is very effective in handling big data and proper preprocessing and analysis of data (Yang et al., 2024). The literature review will cover FinBERT for sentiment analysis, utilizing financial stress indices and data-gathering methods with Hugging Face models.
FinBERT for Sentiment Analysis
Recent studies well prove the effectiveness of FinBERT in financial text analysis, particularly in capturing subtle sentiments in financial news. A recent study by JP Morgan in association with Queen's University established the fact that FinBERT is far better than the ChatGPT model and some other models found in the financial domain and thus preferred for the sentiment analysis used in the financial markets. Such a feature made FinBERT one of the power tools for making predictions in the market and presents much more authentic, contextual information. According to Yang et al. (2020), FinBERT is efficient at extracting subtle sentiments for predicting market movements. (Sharma et al., 2024) underscored that the model is more accurate than traditional methods when it comes to sentiment classification and has implications for the application of accurate sentiment assessment. In addition, (Shen & Zhang, 2024) demonstrated FinBERT’s real-time financial news analysis and potential to deal with vast datasets and offer real-time market sentiment insights.
Financial Stress Indices
Bianco et al. (2011) provide a robust methodology for building a financial stress index, combining heterogeneous market indicators to measure systemic risk. It is a valuable instrument for the monitoring of financial stability. The financial stress index presented by Cevik et al. (2013) has been developed specifically for emerging markets. The authors further analyze the component structure of the proposed index and the index's forecasting proficiency with regard to identifying financial crises. Their work highlights the essential need for tailored indices, depending upon variations in market conditions (Singh et al., 2024). Duprey et al. (2017) further demonstrated the applicability of financial stress indices in predicting financial stability crises, thus proving their position in prospective risk management.
Data Collection Methodologies Using Hugging Face Models
Wolf et al. (2020) discuss the Hugging Face model repositories by focusing on model adaptation towards large datasets and applications in data collection and preprocessing involving NLP tasks. Loshchilov and Hutter (2019) propose methods that assist training models. Brown et al. (2020) talks about large language models like GPT-3 that may be used in data collection and sentiment analysis. Devlin et al. (2019) introduce the model FinBERT, explaining one primary preprocessing step of data and methodologies that relate to our research.
The method of using sentiment analysis with FinBERT and financial stress indices appears to be a promising approach for improving stock market strategies Fatouros et al., (2023), while individual works of Sentiment analysis studies using FinBERT; financial stress indices and data collection with Hugging Face Models can be found individually, very few research exist addressing all three. The present study attempts to bridge this gap. These methods provide a general overview of market dynamics and an informed investment strategy (Argyres et al., 2020). By implementing advanced NLP models and robust financial indices, this study will enhance the body of knowledge related to the realm of finance with regard to the application of sentiment analysis and financial stress indices (Hansen & Borch, 2022).
Research Methodology
We applied Natural Language Processing with FinBERT on financial news from HuffPost spanning ten years, extracting sentiment data that reflects market moods and trends (Almalis et al., 2022). We have chosen DOW Jones because it is the index that is a global leader in its sector, and the world stock markets are influenced by its strong fundamentals and impact globally (Agarwal et al., 2024). Additionally, we constructed a financial stress index using various market indicators such as volatility indices, credit spreads, liquidity ratios, and macroeconomic indicators (Oet et al., 2015). These were standardized and integrated into a robust measure of market stress. The stress index, when merged with sentiment data, enabled more accurate and dynamic investment strategies to be developed (Liang et al., 2023). To test the strategies, experiments were conducted by measuring them against some key financial metrics, such as the Sharpe ratio, maximum drawdown, and cumulative returns, as proposed by Choi (2021). The goal is to improve market forecasting and enhance portfolio management.
Data Collection
We gathered a comprehensive dataset of financial news articles from HuffPost, covering from 2012 to 2022, sourced from Kaggle. Initially in JSON format, the same dataset included key information such as headlines, dates, categories, and authors and represented valuable data in market sentiment views. It covered the time over a decade, capturing all diverse kinds of market conditions and events.
Data Preprocessing
We prepared the dataset by converting the JSON data to CSV for easy manipulation, removed irrelevant or duplicate articles, corrected inconsistencies, and handled missing values. Then, we segmented the data into year-wise subsets for a time-series analysis of market trends.
Data Integration
We combined sentiment analysis employing FinBERT with a financial stress index for enhancing stock market strategies. Financial news sentiment scores provided valuable insights regarding market sentiment, while the stress index, derived from measures of volatility, credit spreads levels, liquidity ratios, and macroeconomic variables, evaluated general market stress levels. Through the combination of these factors, we established a solid framework for adaptive investment strategies. These strategies were exhaustively validated with significant financial metrics, including maximum drawdown, cumulative returns, and the Sharpe ratio, hence ensuring improved market prediction and effective portfolio management.
Experiments and Stress Index Analysis
The components of this index are:
1. Volatility Indices: These indices indicate market expectations of short-term volatility, as informed by stock index option prices; high volatility indicates more significant levels of uncertainty and risk (Li, 2022).
2. Credit Spreads: The measurement of credit spreads is a differential yield calculated from different types of bonds, generally between government and corporate bonds (Chen et al., 2007). A rising credit spread means that investors demand higher returns for taking an additional risk, which implies some stress in the credit markets (Cesa-Bianchi & Sokol, 2022).
3. Liquidity Ratios: Liquidity ratios measure the ability of the market to trade assets without causing significant price fluctuations. High liquidity indicates a healthy market with easy asset trading, whereas low liquidity could indicate stress and potential market instability (Arsyad et al., 2021).
4. Macroeconomic Indicators: These indicators are in the form of GDP growth rates, unemployment rates, and inflation rates (Agu et al., 2022). Whenever these indicators experience abnormal deviations from their normal levels, stress in the economy is witnessed (Cevik et al., 2013).
All these components constitute a well-rounded view of financial stress. All these components are standardized using z-scores to standardize across different scales and periods. Then, we combined the standardized measures to create a robust and comprehensive financial stress index that can adequately measure the market and provide advance warnings of possible crises by applying the Z-scoring technique to make indices.
In integrating dynamic SI + News, Z-scoring is adopted to standardize various components of the financial stress index. This helps compare different variables on different scales and ensures consistency and comparability over time. The formula for calculating the Z-score is:
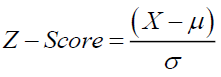 (1)
(1)
Where:
X = Value of the component
μ = Mean (average) of the component
σ = Standard deviation of the component
Applying Z-scores standardizes each component of the financial stress index, such as volatility, credit spreads, and liquidity ratios. The standardized components can then be compiled into a single comprehensive financial stress index, which is used together with sentiment scores obtained from financial news. This integration method (Dynamic SI+News) ensures that the data used for the decision-making is comparable, no matter from which scale the different components originated.
Integration as Sentiment-Stress Synergy Model.
We have introduced "Sentiment-Stress Synergy Model" which has been given the merit of alternating strategy-one depending upon financial stress index (SI) with another based upon the stress index combined with news sentiment analysis (SI+News). such a dynamic switch allows the model to optimize investment decisions under the different market conditions, using news sentiments when it improves performance. The combination of sentiment data and the stress index helps in much better comprehension of market behaviour, especially during extreme volatility or crises.
The strategy alternation is controlled by a mechanism that uses performance evaluation based on the Sharpe ratio, calculated over a 250-day rolling window analogous to an annual observation period. The mechanism switched the strategy to the one with the higher Sharpe ratio for the following month. empirical tests at hand reveal that, depending on the market context, the SI+News approach underwent strong outperformance and underperformance with respect to the SI-only approach, especially during crises. For instance, in December 2022, the SI+News strategy, which had a Sharpe ratio of 0.9, outranked the SI-only strategy with a Sharpe ratio of 0.4. Hence, in the following months, they opted for the combined strategy, which produced superior risk-adjusted returns. This choice dynamic allows for a strategy to evolve with the changing market environment, providing better portfolio management through the integration of financial stress and sentiment information. Our study aims to provide a general model for predicting the market and formulating an investment strategy through such detailed integration of sentiment analysis with financial stress indices. This complements the understanding of market dynamics and provides practical risk management and return optimization tools to investors.
Experimental Setup
The experiment was conducted using Google Colab. The experiments aimed to test the notion that stock market fluctuations may be predicted more accurately by combining sentiment data from HuffPost financial news with conventional financial stress indicators. We processed and classified sentiment from the gathered HuffPost data using FinBERT, a model designed especially for financial sentiment analysis Figure 1.

Figure 1 Model Comparison with Fin-Bert
Construction of the Composite Stress Index
The composite stress index was created by allocating weights to the different components based on their predictive usefulness and influence on market dynamics. These weights were calibrated using a combination of correlation analysis and backtesting, with an emphasis on their historical association with market rallies and declines. The resulting index proved to be a robust measure of market stress, which could then be used in conjunction with sentiment data for further empirical analysis. The Sharpe and Calmar ratios have been selected for backtesting of the financial strategies, as these ratios are best suited for assessing risk-adjusted returns and drawdown management. While the Sharpe ratio reflects return in relation to risk and is an excellent tool for determining a strategy's effectiveness concerning volatility, the Calmar ratio indicates how resilient a strategy is to severe losses. It measures the relationship between maximum drawdowns and annualized returns, which are widely known in financial analysis, to weigh risk exposure and the best possible returns.
Experiment Design
In this study, we explore the ability of the news signals to predict by comparing six different strategies across three major markets: NASDAQ, S&P 500, and MSCI Global Investment Index. This study seeks to determine whether the use of sentiment-driven signals improves performance in comparison to standard financial indicators. The six strategies that were tested are the following: The long-only strategy (Benchmark), as its name implies, is the baseline by assuming that it places a long position in the markets without considering any kind of sentiment or stress signals. Thus, this works as the yardstick against which the other strategies' efficiency will be gauged. Secondly, the VIX-based strategy with the weight assigned according to the VIX index indicates periods of market stress whenever the VIX level exceeds its 80th percentile historically at approximately 26%. The Stress Index (SI) strategy relies solely on weightings as defined by the financial stress index, which reflects the stress and volatility of the economy.
The fourth strategy, News, assigns weights based on the sentiment underlying financial news, which allows for the consideration of qualitative market mood in the analysis. The fifth strategy, SI + News, couples the Stress Index and news sentiment by multiplying the two signals together. This integrated approach makes use of quantitative and qualitative factors for a more balanced decision (Pandey et al, 2024; Pandey et al, 2025). Finally, the Dynamic SI + News strategy involves dynamically the Stress Index itself and the combination of Stress Index and News Sentiment whichever performs better in the preceding period. The choice is made based on the Sharpe ratio over a rolling period for optimal performance. To draw an overall comparative picture of performance among these strategies in the three markets, 18 experiments were run. The MSCI Global Investment Index is broad and international; it allows an evaluation of effectiveness for the global equity market. Important financial metrics involved in the assessment of performance are the Sharpe ratio and the Calmar ratio; they give us information about how risk-adjusted the returns, as well as about the ability to manage market decline.
Results
This section compares the performance of four different strategies using a few important financial variables, including the Sharpe ratio, Calmar ratio, annualized volatility (Vol), maximum drawdown (Max DD), and turnover rate.
4.1. Comparative Analysis of Investment Strategies
The strategy's performance under various conditions is shown in the tables below. The Sharpe ratio evaluates the risk-adjusted return of a strategy, calculated by dividing the excess return by annualized volatility. The formula is:
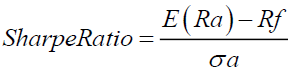 (2)
(2)
A higher Sharpe ratio indicates better risk-adjusted performance, with values above 1 considered good.
The Calmar ratio focuses on the relationship between annualized returns and maximum drawdown, which measures the largest peak-to-trough decline in a portfolio. It is calculated using the formula:
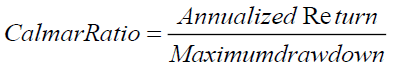 (3)
(3)
A higher Calmar ratio signals better downside risk management.
To keep column names concise in tables, we denote Sharpe for the Sharpe ratio, Calmar for the Calmar ratio, Vol for annualized volatility, and Max DD for maximum drawdowns.
The baseline strategy, namely the Stress Index (SI), is highlighted in the table 1. It provides a Sharpe ratio of 0.68 and a Calmar ratio of 0.49, with annualized volatility at 8.2% and a maximum drawdown of 12%. A turnover rate 7.5 indicates that it is a relatively non-aggressive approach, with fewer trades executed over time. The baseline provides moderate risk-adjusted returns and is compared against the other strategies in the study.
| Table 1 Stress Index Performance as the Baseline Strategy | |||||
| Strategy | Sharpe | Calmar | Vol | Max DD | Turnovers |
| SI (baseline) | 0.68 | 0.49 | 8.2% | 12% | 7.5 |
Table 2 compares the SI baseline, SI+News (Sentiment-Only), and Dynamic SI+News (Combined) strategies for the Dow Jones. The SI+News strategy, driven by sentiment data, shows a Sharpe ratio of 0.50 and a Calmar ratio of 0.28, reflecting its lower effectiveness relative to the baseline. It also exhibited a higher turnover rate of 13.2, reflecting more active trading driven by news sentiment, but this did not translate into improved performance. On the other hand, the strategy Dynamic SI+News (Combined) produced more excellent results with a Sharpe ratio of 0.78 and a Calmar ratio of 0.53. This strategy also displayed lower volatility at 7.8% and a reduced maximum drawdown of 10%. The turnover rate of 8.9 suggests a balance between active and passive trading, offering better risk-adjusted returns than the SI+News strategy.
| Table 2 Comparative Analysis for the Dow Jones | |||||
| Strategy | Sharpe | Calmar | Vol | Max DD | Turnover |
| SI (baseline) | 0.68 | 0.49 | 8.2% | 12% | 7.5 |
| SI+News (Sentiment-Only) |
0.50 | 0.28 | 6.5% | 13% | 13.2 |
| DynamicSI+News (Combined) |
0.78 | 0.53 | 7.8% | 10% | 8.9 |
The analysis in Table 3 extends to the MSCI Global Investment Index, which displays the versatility of the Dynamic SI+News (Combined) strategy. The strategy had a Sharpe ratio of 0.81 and a Calmar ratio of 0.57, with lower volatility at 8.6% and a maximum drawdown of 14%. The turnover rate of 7.4 reflects moderate trading activity, indicating that this strategy adapts well to global market environments, providing superior risk management and returns.
| Table 3 Stress Index Analysis in Broader Market Conditions | |||||
| Strategy | Sharpe | Calmar | Vol | Max DD | Turnover |
| SI (baseline) | 0.76 | 0.49 | 9.2% | 18% | 6.9 |
| SI+News (Sentiment-Only) | 0.55 | 0.34 | 7.1% | 11% | 12.7 |
| Dynamic SI+News (Combined) | 0.81 | 0.57 | 8.6% | 14% | 7.4 |
Table 4 examines the three strategies across leading equity markets, further evidence that Dynamic SI+News is strongly ahead of the competition. With the Sharpe ratio standing at 0.81 and the Calmar ratio at 0.57, the strategy maintains its relative lead over SI (baseline) at Sharpe and Calmar levels of 0.76 and 0.49, respectively. Furthermore, the SI+News strategy also lagged with a Sharpe ratio of 0.55 and a Calmar ratio of 0.34. The Dynamic SI+News strategy also managed a lower maximum drawdown of 14% and moderate turnover of 7.4, confirming its strength in managing risk and return in diverse market conditions.
| Table 4 Comparative Analysis of Major Market Strategies | |||||
| Strategy | Sharpe | Calmar | Vol | Max DD | Turnover |
| Dynamic SI+News (Combined) |
0.81 | 0.57 | 8.6% | 14% | 7.4 |
| SI (baseline) | 0.76 | 0.49 | 9.2% | 18% | 6.9 |
| SI+News (Sentiment-Only) |
0.55 | 0.34 | 7.1% | 11% | 12.7 |
Validation and Testing
We validated our findings by running a series of validation tests, including worst-case stress tests, sensitivity analyses, and out-of-sample testing. These tests were designed to check the adaptability and resilience of the strategies under different market environments. The strategies were tested over a decade-long period, from January 2012 to January 2022, encompassing different market conditions. Our comparative analysis, as presented in Tables 2, 3, and 4, highlights the performance consistency of the different investment strategies when applied to the Dow Jones Industrial Average, as we have chosen this because it is the least researched index. Notably, the Dynamic SI+News strategy, which is the sentiment-only strategy, was analyzed as per our FinBERT model. Consistently demonstrated superior performance in Sharpe and Calmar ratios, indicating better risk-adjusted returns and effective drawdown management. This underscores the strategy's ability to navigate complex market dynamics while optimizing portfolio performance. In more detail, for the Dow Jones (Table 2), the Dynamic SI+News strategy achieves not only the highest Sharpe ratio (0.78) but also the highest Calmar ratio (0.53). This improvement in the Sharpe ratio is significant compared to the benchmark strategy (SI: Baseline), which only achieves a Sharpe ratio of 0.68, making the improvement substantial. Similarly, in the DOW JONES market (Table 3), the same strategy shows a remarkable Sharpe ratio of 0.81, further reinforcing its efficacy in a tech-heavy index. The analysis for major equity markets (Table 4) also corroborates the superiority of the Dynamic SI+News strategy, particularly in managing market downturns, as evidenced by its lower maximum drawdown (Max DD) compared to other strategies like News and VIX.
Focusing on the Sharpe ratio, we also notice that the strategy based on the Stress index alone consistently ranks second, indicating that the signals from the stress index are robust and more effective than those using the VIX index. Regarding turnover, which measures the frequency of trading within the portfolio, we observe notable differences across strategies. For instance, in the Dow Jones (Table 2), the 'SI+News' strategy exhibits the highest turnover rate at 13.2, indicating a more active trading approach. This contrasts with strategies like 'SI' and 'Dynamic SI+News', which have lower turnover rates, suggesting a more passive strategy.
Figures 2-5 provide a detailed visual representation of the comparative performance between the 'Dynamic SI+News' strategy and the passive long-only benchmark within the Dow Jones universe. These figures are crucial in demonstrating the superior performance of the Dynamic SI+News strategy, which effectively combines sentiment indicators (SI) and real-time news data to inform investment decisions.

Figure 2 Comparison of Dynamic Si+News vs. Stress Index and Long-only for Dow Jones

Figure 3 Comparison of Stress Index vs. Long-only for Dow Jones

Figure 4 Comparison of News vs. Long-Only for Dow Jones

Figure 5 Comparison of Dynamic SI+News vs. Long-only for Dow Jones
The upper plot in each figure presents the cumulative performance of the Dynamic SI+News strategy relative to the benchmark. The strategy outperformed the long-only approach, considering its steeper growth trajectory and higher overall returns. This outperformance is particularly pronounced during periods of higher market volatility, where the strategy better copes with potential losses through its adaptability than the static benchmark.
Each figure subplot offers additional information by illustrating the adjustments to the allocation made by the Dynamic SI+News strategy over time. Dynamic allocation is a feature of the strategy that allows it to modulate its exposure in response to market fluctuation. For instance, in order to take advantage of growth prospects, the strategy may raise its market exposure in more stable times while decreasing its risk exposure during times of increased uncertainty. These Allocation Shifts, then, are fueled by sentiment analysis as well as news-driven insights to ensure the strategy is responsive to new and prevailing market development.
The correlation matrix shows insightful relationships among the performance metrics of the investment strategies. Notably, the Sharpe ratio, which measures risk-adjusted returns, shows a high positive correlation (0.918) with the Calmar ratio. This indicates that strategies with higher Sharpe ratios also tend to have better risk-adjusted performance, as indicated by the Calmar ratio. On the other hand, the Sharpe ratio exhibits a strong negative correlation with maximum drawdown (-0.720) and turnover (-0.883). This shows that strategies with higher Sharpe ratios exhibit lower maximum drawdowns and engage in less frequent trading, highlighting their efficiency in managing risk and trading costs.
The Calmar ratio also shows an extremely negative correlation with maximum drawdown (-0.815) and turnover (-0.889). Therefore, it could be concluded that strategies with higher Calmar ratios not only provide better risk-adjusted returns but also manage to minimize potential losses and maintain a lower frequency of trading. This proves how strong the Dynamic SI+News strategy is while consistently outperforming all others across various markets. Volatility, as expected, shows a moderate positive correlation with maximum drawdown (0.563) and turnover (0.442). Higher volatility is generally associated with higher potential losses and a more active trading approach. However, although weaker, its negative correlations with both the Sharpe (-0.175) and Calmar (-0.109) ratios indicate that lower volatility is somewhat aligned with better risk-adjusted performance. The strong positive correlation between maximum drawdown and turnover (0.809) reveals that strategies with higher drawdowns tend to have more turnover. This relationship is further emphasized as the trade-off between active management and exposure to significant losses. Overall, these correlations point to the importance of selecting strategies that have high risk-adjusted returns, effective drawdown management, and optimal trading frequency. The ability of the Dynamic SI+News strategy to balance all these aspects across different markets is noteworthy.
Discussion
It can be concluded from experiments and results that the Dynamic SI+News strategy works well, being quite good in both time periods and market conditions. Owing to the flexibility to incorporate real-time information and update the strategy appropriately, this out-of-sample strategy provides a relatively robust performance profile, capturing the upside during easy times and having its greatest utility during stress markets by limiting potential loss. For investors who tend to be more active and knowledgeable about the marketplace, the Dynamic SI+News strategy shows superior risk-adjusted returns and lower drawdowns versus a passive long-only benchmark. By employing sentiment and news data, the strategy allows a more profound comprehension of market dynamics and thus enables remaining proactive in an evolving environment
The overall assessments presented in Figures 5 & 6 demonstrate the Dynamic SI+News strategy's efficacy and versatility, making it a compelling option for investors seeking to enhance portfolio return while controlling risk. One of the main conclusions from our analysis is that the strategy may adjust to various market conditions while continuously maintaining high-performance metrics. This highlights the strategic significance of integrating sentiment and news-driven insights into the investing decision. In summary, these figures show how the Dynamic SI+News strategy has been positioned well. These show that there are superior performances under different conditions of markets. Its dynamic allocation mechanism, guided by real-time sentiment and news data, drives the dynamic mechanism towards higher performance and outperforms passive long-only benchmarks. The increased turbulence in markets brings out even higher returns when effectively managed through effective risk, showing the importance of the strategy as a prime tool for return attainment.

Figure 6 Correlation Matrix of Investment Strategies
Managerial Implications
This research offers financial managers a robust analytical tool for foretelling market movement and augmenting portfolio performance. Sentiment analysis, integrated with financial stress indices, allows managers to blend qualitative sentiment information obtained from financial news with traditional, quantitative measures. An integrated approach such as this would lead to an accurate and timely investment decision, thus mitigating risk and maximizing return. With this integrated approach, the financial manager, in fact, ought to find use in seeing that better navigation through periods of heightened uncertainty in the markets would enhance decision effectiveness and minimize uncalled-for risks.
Policy Implications
This study serves great significance to policymakers, given that they uphold market stability and transparency responsibilities. By using sentiment analysis alongside stress indices, regulators can construct more levers and frameworks for effective regulation while continuously monitoring the market in real-time. Upon perceiving potential financial risks and vulnerabilities through this synergy, regulators may choose appropriate interventionist policies to bolster market resilience. Additionally, it gives a framework for designing policies that favor greater accountability and transparency in financial markets, which will support stabilizing the economy (Agarwal and Singh, 2023). Through this, policymakers can intervene correctly by foreseeing possible financial risks and vulnerabilities long beforehand.
Academic Contribution
The present study is academically significant as it connects purely quantitative with purely qualitative financial analysis. It is methodological contribution seeks to show the efficacy of combining sentiment data with various financial stress indicators, thus improving market volatility predictions. By bridging existing literature, this study provides a foundation for future projects investigating the synergies of financial analysis that create integration of qualitative and quantitative methods. This, in turn, provides the scope for building models employing machine learning in financial studies, hence pushing new avenues of academic inquiry into market conduct and predictive modeling.
Conclusion
Finally, our study illustrates the potential benefits of combining sentiment analysis from financial news with a financial stress index to elevate stock market strategies. The combined methodology significantly enhances market prediction accuracy and portfolio performance, as revealed by improved Sharpe ratios, lower maximum drawdowns, and more stable cumulative returns. This approach provides a rich market dynamics analysis by incorporating qualitative sentiment information and quantitative financial measures.
Nonetheless, our work has some limitations. Using historical data from HuffPost can introduce period- and publication-specific biases. Moreover, FinBERT model performance and financial stress index performance can be sensitive to variations in market conditions and practices in news reporting. Future research could explore applying this integrated approach to other financial markets and news sources and incorporating real-time data for more immediate investment decision-making.
Acknowledgments
The first author would like to thank the Ministry of Education, Government of India, for providing financial assistance.
References
Agarwal, S., & Singh, R. (2023). Customers’ perception towards accountability of diagnostic centres: evidence from India. Journal of Multidisciplinary Healthcare, 2947-2961.
Indexed at, Google Scholar, Cross Ref
Agarwal, S., Singh, R., Pandiya, B., & Bordoloi, D. (2024). Unveiling the Negative Customer Experience in Diagnostic Centers: A Data Mining Approach. Journal of Multidisciplinary Healthcare, 17, 1491–1504.
Agu, S. C., Onu, F. U., Ezemagu, U. K., & Oden, D. (2022). Predicting gross domestic product to macroeconomic indicators. Intelligent Systems with Applications, 14, 200082.
Akter, S., Bandara, R., Hani, U., Fosso Wamba, S., Foropon, C., & Papadopoulos, T. (2019). Analytics-based decision-making for service systems: A qualitative study and agenda for future research. International Journal of Information Management, 48, 85–95.
Indexed at, Google Scholar, Cross Ref
Almalis, I., Kouloumpris, E., & Vlahavas, I. (2022). Sector-level sentiment analysis with deep learning. Knowledge-Based Systems, 258, 109954.
Argyres, N. S., De Massis, A., Foss, N. J., Frattini, F., Jones, G., & Silverman, B. S. (2020). History-informed strategy research: The promise of history and historical research methods in advancing strategy scholarship. Strategic Management Journal, 41(3), 343–368.
Arsyad, M., Haeruddin, S. H., Muslim, M., & Pelu, M. F. A. R. (2021). The effect of activity ratios, liquidity, and profitability on the dividend payout ratio. Indonesia Accounting Journal, 3(1), Article 1.
Arslan, Y., Allix, K., Veiber, L., Lothritz, C., Bissyandé, T. F., Klein, J., & Goujon, A. (2021). A Comparison of Pre-Trained Language Models for Multi-Class Text Classification in the Financial Domain. Companion Proceedings of the Web Conference 2021, 260–268.
Bianco, T., Eiben, R., Gramlich, D., Oet, M. V., & Ong, S. J. (2011). The financial stress index: Identification of systemic risk conditions. Working Papers (Old Series), Article 1130.
Indexed at, Google Scholar, Cross Ref
Brown, T., Mann, B., Ryder, N., Subbiah, M., Kaplan, J. D., Dhariwal, P., Neelakantan, A., Shyam, P., Sastry, G., Askell, A., Agarwal, S., Herbert-Voss, A., Krueger, G., Henighan, T., Child, R., Ramesh, A., Ziegler, D., Wu, J., Winter, C., Amodei, D. (2020). Language Models are Few-Shot Learners. Advances in Neural Information Processing Systems, 33, 1877–1901.
Cesa-Bianchi, A., & Sokol, A. (2022). Financial shocks, credit spreads, and the international credit channel. Journal of International Economics, 135, 103543.
Cevik, E. I., Dibooglu, S., & Kutan, A. M. (2013). Measuring financial stress in transition economies. Journal of Financial Stability, 9(4), 597–611.
Chen, P. (2021). Market Uncertainty, Information Complexity, and Feasible Regulation: An Outside View of Inside Study of Financial Market. Topoi, 40(4), 733–744.
Choi, J. (2021). Maximum Drawdown, Recovery, and Momentum. Journal of Risk and Financial Management, 14(11), Article 11.
Indexed at, Google Scholar, Cross Ref
Costola, M., Hinz, O., Nofer, M., & Pelizzon, L. (2023). Machine learning sentiment analysis, COVID-19 news and stock market reactions. Research in International Business and Finance, 64, 101881.
Deep, A. (2024). Advanced financial market forecasting: Integrating Monte Carlo simulations with ensemble Machine Learning models. Quantitative Finance and Economics, 8(2), 286–314.
Devlin, J., Chang, M.-W., Lee, K., & Toutanova, K. (2019). BERT: Pre-training of Deep Bidirectional Transformers for Language Understanding (arXiv:1810.04805). arXiv.
Duprey, T., Klaus, B., & Peltonen, T. (2017). Dating systemic financial stress episodes in the EU countries. Journal of Financial Stability, 32, 30–56.
Indexed at, Google Scholar, Cross Ref
El-Haj, M., Rayson, P., Walker, M., Young, S., & Simaki, V. (2019). In search of meaning: Lessons, resources and next steps for computational analysis of financial discourse. Journal of Business Finance & Accounting, 46(3–4), 265–306.
Farmer, J. D., Gallegati, M., Hommes, C., Kirman, A., Ormerod, P., Cincotti, S., Sanchez, A., & Helbing, D. (2012). A complex systems approach to constructing better models for managing financial markets and the economy. The European Physical Journal Special Topics, 214(1), 295–324.
Indexed at, Google Scholar, Cross Ref
Fatouros, G., Soldatos, J., Kouroumali, K., Makridis, G., & Kyriazis, D. (2023). Transforming sentiment analysis in the financial domain with ChatGPT. Machine Learning with Applications, 14, 100508.
Fischer, S., & Merton, R. C. (1984). Macroeconomics and finance: The role of the stock market. Carnegie-Rochester Conference Series on Public Policy, 21, 57–108.
Hansen, K. B., & Borch, C. (2022). Alternative data and sentiment analysis: Prospecting non-standard data in machine learning-driven finance. Big Data & Society, 9(1), 20539517211070701.
Hollo, D., Kremer, M., & Lo Duca, M. (2012). CISS - A Composite Indicator of Systemic Stress in the Financial System (SSRN Scholarly Paper 2018792). https://doi.org/10.2139/ssrn.2018792
Huang, A. H., Wang, H., & Yang, Y. (2023). FinBERT: A Large Language Model for Extracting Information from Financial Text. Contemporary Accounting Research, 40(2), 806–841.
Indexed at, Google Scholar, Cross Ref
Huang, B., Yao, X., Luo, Y., & Li, J. (2023). Improving financial distress prediction using textual sentiment of annual reports. Annals of Operations Research, 330(1), 457–484.
Huang, W., Nakamori, Y., & Wang, S.-Y. (2005). Forecasting stock market movement direction with support vector machine. Computers & Operations Research, 32(10), 2513–2522.
Ishrakieh, L. M., Dagher, L., & El Hariri, S. (2020). A financial stress index for a highly dollarized developing country: The case of Lebanon. Central Bank Review, 20(2), 43–52.
Jin, Z., Yang, Y., & Liu, Y. (2020). Stock closing price prediction based on sentiment analysis and LSTM. Neural Computing and Applications, 32(13), 9713–9729.
Kamal, S., Sharma, S., Kumar, V., Alshazly, H., Hussein, H. S., & Martinetz, T. (2022). Trading Stocks Based on Financial News Using Attention Mechanism. Mathematics, 10(12), Article 12.
Indexed at, Google Scholar, Cross Ref
Khan, S., Singh, R., Baker, H. K., & Jain, G. (2024). Public Perception of Online P2P Lending Applications. Journal of Theoretical and Applied Electronic Commerce Research, 19(1), Article 1.
Leippold, M. (2023). Sentiment spin: Attacking financial sentiment with GPT-3. Finance Research Letters, 55, 103957.
Liang, C., Luo, Q., Li, Y., & Huynh, L. D. T. (2023). Global financial stress index and long-term volatility forecast for international stock markets. Journal of International Financial Markets, Institutions and Money, 88, 101825.
Li, L. (2022). The dynamic interrelations of oil-equity implied volatility indexes under low and high volatility-of-volatility risk. Energy Economics, 105, 105756.
Indexed at, Google Scholar, Cross Ref
Liu, Z., Huang, D., Huang, K., Li, Z., & Zhao, J. (2020). FinBERT: A Pre-trained Financial Language Representation Model for Financial Text Mining. Proceedings of the Twenty-Ninth International Joint Conference on Artificial Intelligence, 4513–4519.
Loshchilov, I., & Hutter, F. (2019). Decoupled Weight Decay Regularization (arXiv:1711.05101). arXiv.
MacDonald, R., Sogiakas, V., & Tsopanakis, A. (2018). Volatility co-movements and spillover effects within the Eurozone economies: A multivariate GARCH approach using the financial stress index. Journal of International Financial Markets, Institutions and Money, 52, 17–36.
Indexed at, Google Scholar, Cross Ref
Moore, S. B., & Manring, S. L. (2009). Strategy development in small and medium sized enterprises for sustainability and increased value creation. Journal of Cleaner Production, 17(2), 276–282.
Oet, M. V., Dooley, J. M., & Ong, S. J. (2015). The Financial Stress Index: Identification of Systemic Risk Conditions. Risks, 3(3), Article 3.
Pandey, L. K., Bhattacharjee, J., Singh, R., & Singh, A. (2024). Unravelling the determinants of social media payment platform (SMPP) usage: A qualitative study on user intentions and adoption. Bangladesh Journal of Multidisciplinary Science and Research, 9, 33-41.
Pandey, L. K., Singh, R., & Singh, A. (2025). Adopting social media payment platforms: A systematic literature review and future research agenda. Academy of Marketing Studies Journal, 29, 1-20.
Pang, B., & Lee, L. (2008). Opinion Mining and Sentiment Analysis. Foundations and Trends® in Information Retrieval, 2(1–2), 1–135.
Indexed at, Google Scholar, Cross Ref
Rossi, B. (2021). Forecasting in the Presence of Instabilities: How We Know Whether Models Predict Well and How to Improve Them. Journal of Economic Literature, 59(4), 1135–1190.
Sharma, N. A., Ali, A. B. M. S., & Kabir, M. A. (2024). A review of sentiment analysis: Tasks, applications, and deep learning techniques. International Journal of Data Science and Analytics.
Indexed at, Google Scholar, Cross Ref
Shen, Y., & Zhang, P. K. (2024). Financial Sentiment Analysis on News and Reports Using Large Language Models and FinBERT. 2024 IEEE 6th International Conference on Power, Intelligent Computing and Systems (ICPICS), 717–721.
Singh, R. (2010). Behavioural finance studies: emergence and developments. Journal of Contemporary Management Research, 4(2), 1.
Singh, R., & Bhowal, A. (2010). Risk perception of employees with respect to equity shares. Journal of behavioral finance, 11(3), 177-183.
Singh, R., & Bhowal, A. (2011). Development of marketing-driven measure of risk perception. The Journal of Risk Finance, 12(2), 140-152.
Singh, R., & Bhattacharjee, J. (2019). Measuring equity share related risk perception of investors in economically backward regions. Risks, 7(1), 12.
Indexed at, Google Scholar, Cross Ref
Singh, R., Kajol, K., Pandiya, B., Puri, L., Pandey, L. K., Agarwal, S., & Khan, S. (2024). Comparative Analysis of Negative Customer Review of Payment Apps: A Data Mining Approach.
Wolf, T., Debut, L., Sanh, V., Chaumond, J., Delangue, C., Moi, A., Cistac, P., Rault, T., Louf, R., Funtowicz, M., Davison, J., Shleifer, S., von Platen, P., Ma, C., Jernite, Y., Plu, J., Xu, C., Le Scao, T., Gugger, S., … Rush, A. (2020). Transformers: State-of-the-Art Natural Language Processing. In Q. Liu & D. Schlangen (Eds.), Proceedings of the 2020 Conference on Empirical Methods in Natural Language Processing: System Demonstrations (pp. 38–45). Association for Computational Linguistics.
Indexed at, Google Scholar, Cross Ref
Wolf, T., Debut, L., Sanh, V., Chaumond, J., Delangue, C., Moi, A., Cistac, P., Rault, T., Louf, R., Funtowicz, M., Davison, J., Shleifer, S., von Platen, P., Ma, C., Jernite, Y., Plu, J., Xu, C., Scao, T. L., Gugger, S., … Rush, A. M. (2020). HuggingFace’s Transformers: State-of-the-art Natural Language Processing (arXiv:1910.03771). arXiv.
Yang, X., Liang, W., & Zou, J. (2024). Navigating Dataset Documentations in AI: A Large-Scale Analysis of Dataset Cards on Hugging Face (arXiv:2401.13822). arXiv.
Indexed at, Google Scholar, Cross Ref
Yang, Y., UY, M. C. S., & Huang, A. (2020). FinBERT: A Pretrained Language Model for Financial Communications (arXiv:2006.08097). arXiv.
Indexed at, Google Scholar, Cross Ref
Zahra, S. A. (1996). Technology strategy and financial performance: Examining the moderating role of the firm’s competitive environment. Journal of Business Venturing, 11(3), 189–219.
Indexed at, Google Scholar, Cross Ref
Received: 18-Mar-2025, Manuscript No. AMSJ-25-15766; Editor assigned: 19-Mar-2025, PreQC No. AMSJ-25-15766(PQ); Reviewed: 20-Apr-2025, QC No. AMSJ-25-15766; Revised: 02-May-2025, Manuscript No. AMSJ-25-15766(R); Published: 07-May-2025