Research Article: 2021 Vol: 25 Issue: 4S
Improvement of Overall Equipment Effectiveness in Chicken Parts Processing
Apichart Chindawong, King Mongkut's University of Technology North Bangkok
Abstract
This research aims to study the reduction of losses incurred from cutter failures, which is the main machine to cut the final parts before packing, in the process of cutting chicken parts. There is no replacement for the engine when it fails, and this has a significant impact on the cutting process of chicken parts.
The researcher conducted a factory study before adjusting the O.E.E. value to reduce the loss by applying the technique of analyzing the machine's overall effectiveness to be applied together with the Why analysis, which is a technique to search for problems or select topics. Setting goals for research planning, finding the cause of the loss, considering ways to improve, and setting control measures from the collection of data, it was found that the machines had frequent breakdowns and intermittent interruptions that accumulated, affecting the target of daily production. From the examination, it was revealed that three main reasons caused this problem: Servo Motor Alarm, Emergency Switch Alarm, and Proximity Sensor Alarm. Such situations were solved by checking and sharpening the cutting blades regularly. Each day’s work included covering the emergency button while cleaning the machine and replacing the spare parts at the specified intervals. The average overall productivity of the cutter was 70.02% higher than before the improvement and 88.70% after the modification, an increase of 18.68%.
Keywords
Loss Reduction, Overall Efficiency of the Machine
Introduction
The poultry production and trimming industry is rapidly expanding, both domestically and internationally. There is a tendency to compete in terms of quality, price, and delivery to customers. Each year generates income for farmers and those involved in the chicken processing industry. There are tens of millions of millions of dollars in revenue from exports to the country each year. At present, the price of poultry and broiler chicken parts is in a slump. Hence, factories need to adjust and develop production processes to respond to competition, reduce costs, make the most of available resources, and guarantee the reliability of the company's customers. The industry needs to maintain its standards for products, services, prices, and quality. In the current situation, the price of broiler chicken parts tends to decrease. As a result, production costs are higher, so it is necessary to continually improve production while maintaining consistent quality that meets requirements. The most widely used method of cost reduction is eliminating waste that occurs in the production process. Intanon (2013) described the efforts to eliminate six types of losses by improving the overall efficiency of the machinery in the food packaging production process.
A study by Mattharak (2010) increased productivity by improving productivity. Overall of machines of the 2nd and 3rd production lines of the feed mill. There is a need to increase the OEE of the pellet machine in the aquafeed mill to reduce costs because we want to add the ability to compete in the market to improve. Therefore, a study was conducted to collect data on the standard cycle time (Cycle Time) of the current working conditions for calculating the OEE value and use the OEE value to analyze and improve it to have a higher value focusing on eliminating wastage. By using the QC Story editing as a tool to improve. And using analytical tools, namely Pareto diagrams, in the selection of problem topics. And analyze the cause of the problem as well. Fish Bone Diagram defines guidelines for improvement and implementation. Thus, reducing the loss and as a result, the OEE value increased from the original average of 74% to 84%. A study by Udomsuk (2010) has improved the overall effectiveness of the machinery in the refractory brick production process. The problem here is that heat-related industries have a greater demand for refractory bricks. Therefore, it must prepare to support by eliminating various losses. To increase the OEE value of critical lines are scales, mixers, extruders, and furnaces. Therefore, a study was conducted to prioritize machinery that affects the production process and safety in refractory brick production by applying the Failure Mode and Effect Analysis (FMEA) system. Selection of machinery that affects the production process to be corrected So that the machine can work with higher overall efficiency. And using a tool to analyze the root cause, which is Why-Why Analysis; And put into practice, the average OEE value increased as follows: Scales increased to 89.23%, to 89.69%, mixers to 85.25% to 88.07%, Extrusion Machines to 75.33%, to 82.09% and Kiln. Increased from 82.13% to 86.27% and a study by Sakda Wiriyaphap (2010) has improved the overall efficiency of the machines in the welding wire production process. The problem was that the device could not produce enough product to meet the customers' needs, and there was a loss in the production process and pulling, rolling, bending, shearing, flux-mixing machines. And the oven had a low OEE, which collected data. Three months before took the improvement to calculate the OEE value. Found that the manufacturing process of welding electrodes resulted in lower OEE values and wasted loss classification. And the hours of loss incurred for each type A used the Pareto diagram to rank and select the type of loss. And using Fish Bone Diagram to find causes and solutions to implement. After the improvement, the average OEE increase of all procedures before improvement was 68.84%, after the improvement was 83.16%.
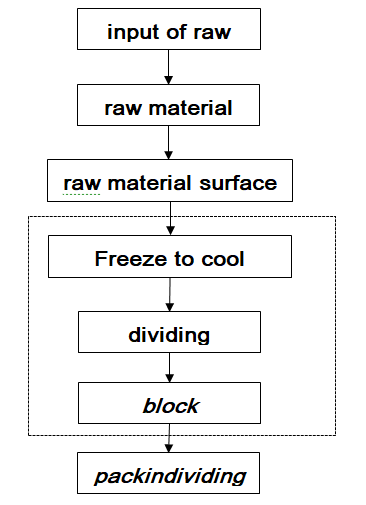
The example factory that the researcher studied is a factory for processing and cutting frozen chicken parts for export to foreign countries. Each piece of chicken is used as an important factor in machinery. In production, a machine for cutting parts (a portion machine) is a machine that performs a specific function. No other device can replace it, and frequent failures in the current operation cause a loss of working production. When collecting the operational data of the cutter from October 2020 to December 2020, it was found that the average overall efficiency of the machine was 70.02%. The policy of the case study factory requires that the overall efficiency of the engine is not less than 85%. Therefore, the cutting machine needs to be maintained and in good working condition to keep the engine running efficiently and prevent the knife from stopping during the process of cutting chicken parts. To eliminate waste for the chicken slicer, an all-inclusive maintenance method is used, with the machine's overall efficiency as an indicator. For the plant used in the present study, the production and distribution of broiler chicken parts and frozen chicken have an expected capacity of 170,000 to 200,000 chickens/day. The production process used in the production of broiler chicken parts is shown in Figure 1.
Figure 1 shows the process of trimming the chicken pieces only in the boneless leg area. The three-month retrospective adjustment in 2020 is lower than the standard, as shown in Table 1-1, with only one block cutter, which is the last step of the cutting process before packing.
| Table 1 Summary Table of OEE Values, Cutters Before Adjustment During October - December 2020 |
|||||
|---|---|---|---|---|---|
| Items | Oct.-2020 | Nov.-2020 | Dec.-2020 | Total | Average |
| Work load time (minutes) | 24000 | 24960 | 22080 | 71040 | 23680 |
| Planned stop time (minutes) | 4500 | 4680 | 4140 | 13320 | 4440 |
| Loss time from stop machine (minutes) | 3815 | 4120 | 2989 | 10924 | 3641 |
| P-Time lost from power down (minutes) | 750 | 780 | 690 | 2220 | 740 |
| Q-lost time from waste production (minutes) | 2250 | 234 | 1380 | 3864 | 1288 |
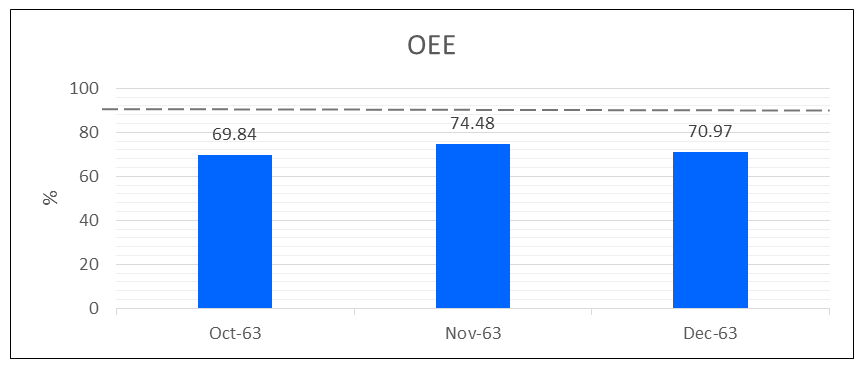
| OEE % | 69.84 | 74.48 | 70.97 | 215.29 | 70.02% |
The analysis shown in Table 1 shows that the three-month cutter OEE averaged 70.02%, below the target of 85%, as illustrated in Figure 1-2.
Studying the current machine condition before the revision shows that the chicken trimmers have a loss, as can be seen with an OEE below 85% and an average of 70.02%. Then, The research objectives as follow: To reduce the loss caused by machinery: Quality Rate >85%, To increase the efficiency of the machine: Performance Efficiency rate >85% and To increase the production time: Availability rate >85%
Research Method
The researcher conducted a study in the poultry parts factory on the chicken trimming production line. There are machines for material feeding, sizing, surface sizing, cooling, slitting, block cutting, and product packaging. Appliances are all critical to the production process because it is considered the upstream bottleneck of the chicken cutting production line. The structure of the device has a complicated mechanism and is an old machine. When the machine breakdowns, it must be stopped and repaired, affecting the entire chicken trimming line. Therefore, it must be maintained and kept in good working condition with an excellent overall efficiency value in order to eliminate losses.
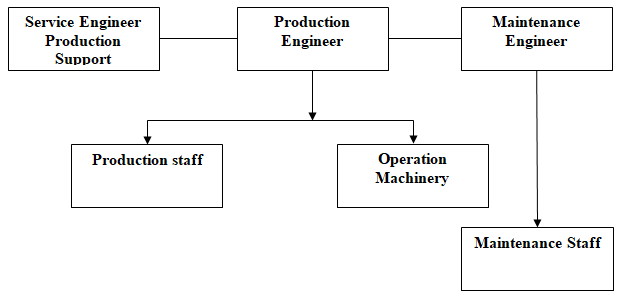
The production support department in which the researcher is involved in the operation is under the product support department and is responsible for planning, determining operational procedures, and participating in processes, including coordinating with relevant parties up to the achievement of the plans and goals set. Management was presented with the plan and results were extended to other production lines that use machinery as an essential factor in production, such as the production line of cooked chicken parts. Using the concept of establishing a small group improvement team to cause participation of each department, maintenance is not the duty of either party or only the maintenance department. Therefore, joint action is required to be able to eliminate loss by maintaining the machinery in good working order.
In the beginning, the project's objectives were explained to the subgroup members as needing to reduce the broiler trimmer's operating losses. The TPM system, the OEE index, will be used for corrective action by defining the duties and responsibilities according to the main activities of the TPM system, as follows:
1. Focused improvements to reduce losses, with shared responsibility for all parties. Details of the operation are to find and apply the topic of problems that cause loss and obstacles in the maintenance of machines to repair and improve them.
2. Autonomous Maintenance is responsible for the production department. The details of the operation are cleaning, lubricating, tightening, and daily inspection, as well as developing skills to become a machine expert and experts in their processes.
Note: This research will focus on practices related to Activity 1, reducing loss and improving self-maintenance. The sample factory that the researcher studied had no policy to bring TPM to the complete system.
The study of current conditions and the problems that arise are the key components, and each component has duties, as follows: The feeder sends the pieces to the production line. The sorting machine sorts the pieces by size, shape, and weight. The skin conditioner adjusts the surface of the work piece. The freezing machine cools the skin of the chicken parts. The dividing machine helps to separate the workpiece by type. The block cutting machine cuts the pieces in proportion. The packing machine packs the pieces.
The overall problem in the production of broiler chicken parts is that all the processes are produced by machiner; people are only responsible for feeding raw materials into the machines and inspecting equipment. At present, there are machine failures and loss of production speed.
Studying the problems that occur, the researcher collected data on working hours, records of malfunctions of different machines, details of production time, machine efficiency, work quality, and waste (OEE=AxPxQ) for three months, from October 2020 to December 2020, to calculate the OEE value as shown and summarize the total OEE value. The cutting machine shows that the three-month OEE average is 70.02%, which is below the target goal of 85%.
Root Cause Analysis and Solution
After becoming aware of the problem, as mentioned in Section 3.3, analyzing the cause and formulating a solution are necessary. The steps are as follows:
1. OEE Value Analysis
The three sub-variables of the OEE value are taken into account, namely utilization rate, operating efficiency, and quality rate. By comparing with the goals according to international standards (http://www.oee.com/world-class-oee.html, 2012), the OEE value must not be less than 85%. All three sub-variable values must meet the standards, as follows:
The utilization rate must be at least than 90%.
The utilization efficiency must be at least 95%.
The quality rate must be at least 99%.
If the rates are any lower than the specified target, the OEE value will be directly affect. As a comparison, each value of the three sub-variables revealed that the quality rate value was at a reasonable level, slightly above the target. These, therefore, did not lower the OEE value. Therefore, it can be concluded that the main reason for the high impact on the low OEE is the fact that the chicken parts cutter still has a low machine running rate.
2. Analyzing the causes of inferiority in machine operation. Due to the interruption of the engine, the data shows the repeated slowing and stopping of the chicken trimming machine, between October 2020 and December 2020, was used for the selection of topics to be improved by using the Pareto Diagram Technique’s 80:20 principles. This makes it possible to select a total of seven problem topics, which are:
1. Alarm when the machine stops working due to failure of the belt speed in conveying the chicken parts into the cutter (Speed Motor Alarm).
2. Alarm when the machine is stopped due to a momentary shutdown of the 3D camera (Camera Alarm).
3. Alarm when the machine is stopped due to the failure of the cutting blade not working (Knife Alarm).
4. Alarm when the machine is stopped due to a malfunction of the laser (Laser Alignment Alarm).
5. Alarm when the machine is stopped due to a malfunction of the blade loop detector (Proximity Sensor Alarm).
6. Alarm when the machine is stopped due to a malfunction of the machine's safety check system (Emergency Switch Alarm).
7. Alarm when the machine is stopped due to a malfunction of the machine's servomotor (Servomotor Alarm).
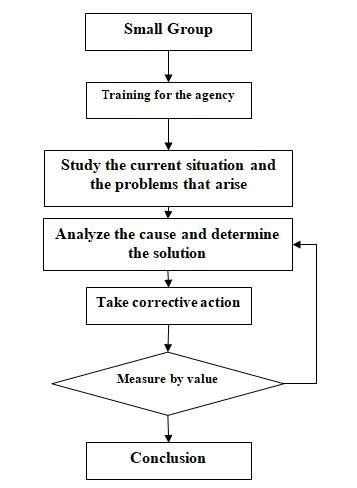
The researcher reviewed relevant research from related books. Why-Why Analysis is a tool used to analyze the root causes of problems and determine the appropriate solutions to improve the overall productivity of machines. Participants in the analysis were the small group, maintenance, and production support teams. On-site audits were conducted to collect real-time data and brainstorm together using the Why-Why Analysis tool to analyze the causes of the malfunctions and formulate corrective and preventive measures, as follows: 1. Analysis of the cause of the Servomotor Alarm problem. There are three topics to be explored by considering the machine's structure: Torque sensor, knife guide rings, and knife holder. The cause of the problem is the torque sensor detecting abnormal torque. The total number of cutting knife errors was 565 times in three months due to clogging of the accumulated fragments in the cutting blade circle. The meat stuck in the cutting knife created excessive torque, causing the sensor to activate, shutting down the machine. 2. Analysis of the cause of the Emergency Switch Alarm problem. The cause analysis of the Emergency Switch Alarm by considering the machine's structure. There are three topics to be explored: An emergency button set (Emergency Alarm), a machine door sensor set (Sensor Door), and a set of sensors to detect the meat crumb tray (Sensor Drawer). The cause of the problem is that the Emergency button has a scale on the terminal of the device. Due to the machines' cleaning each day, the cumulative frequency of crashes was 553 times over a three-month period. 3. Analysis of the cause of the Proximity Sensor Alarm problem. The Proximity Sensor Alarm root cause analysis considered the structure of the machine. There are three topics to explore: Proximity Sensor, In-feed Belts, and Metal Pin. The cause of the problem is the incoming belt of the device is tripped. The cumulative frequency of failures is 528 times over a three-month period.
Take Corrective Action
1. Apply Why-Why Analysis results to practice in small groups.
2. Apply the concept of TPM by incorporating Autonomous Maintenance and Visual Control activities. By defining plans, inspecting, and maintaining machines daily, weekly, and monthly, and by implementing the strategies of the employees who use the devices.
3. Apply the concepts and principles of Visual Control to inspect and maintain machines on a daily, weekly, and monthly basis to understand the normal and abnormal functioning of the machines quickly and easily.
4. Set the OEE value as an indicator for the trimming of chicken parts. Seek continual improvement in the sequence of research steps mentioned above to increase and maintain the OEE level to not less than 85%.
Comparative Measurements Before and After Improvement
1. Comparison of OEE values of chicken parts’ trimmers. By collecting uptime records and calculating OEE values before adjustments for three months, from October 2020 to December 2020, and after adjustments, from January 2021 to March
2. Comparison of working and stopping frequency of the chicken parts’ trimmer before and after the improvement.
Results
By conducting research according to the steps described in Chapter 3, the study concluded that the current conditions and problems that occurred during the period from October 2020 to December 2020, directly resulted in the overall efficiency of the machine being lower than 85%. With the Issues identified, it is therefore possible to analyze the causes and design preventive measures. The results of the research are as follows:
The result of the correction improves the operating efficiency.
The details of the analysis of the causes of the three problems of interruption of the cutter are mentioned above. The ability to determine corrective measures, improve, and implement the results of the revisions are as follows:
Problem 1. The Servomotor Alarm. Alarms frequently occur because the bit force exceeds the standard value due to the lack of sharp cutting blades, causing scraps during the cutting process to clog the blade groove. The solution to improve the situation is by checking and sharpening the cutting blades daily, keeping the knife sharp for cutting, and preventing scraps from clogging the grooves of the blade ring during the working process.
Problem 2. Emergency Switch Alarm. The solution is to cover the sheet during the cleaning process to prevent water from entering the machine, which is the source of slag formation in front of the contact switch.
Problem 3. Proximity Sensor Alarm. Deterioration of the equipment causes the Proximity Sensor Alarm to sound. This prevents the use of the component until the end of its useful life and causes the machine to stop for repairs. Initial correction must be restored to the normal condition by replacing the faulty parts with new ones. In the past, there was no set period. Therefore, the solution is to pre-determine the service life of the belt drive sprocket to be one year, with spare parts prepared in advance. The replacement plan will not affect the production schedule.
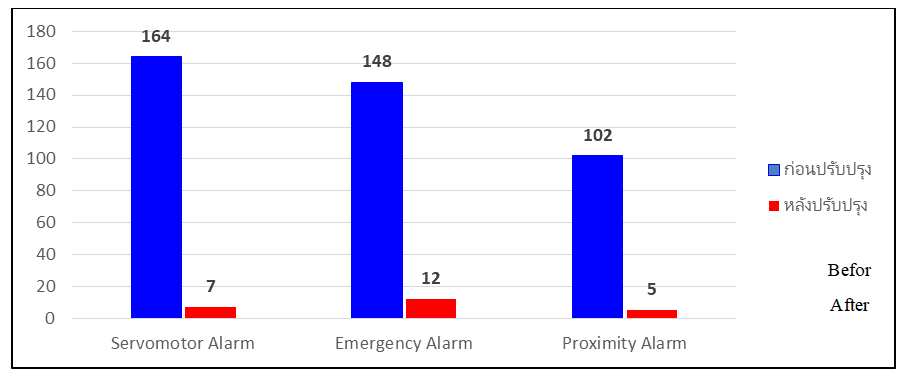
After fixing the problems of the three cutters, the most common problems were significantly reduced. Based on the Pareto classification mentioned above, the frequency of cutter failures decreased in number, as shown in Table 2 and Figure 5.
| Table 2 Frequency Comparison Problems of the Cutter Before and After Improvement |
|||||||||
|---|---|---|---|---|---|---|---|---|---|
| Order | Problem | Frequency of occurrence before improvement | Total frequency | Frequency of occurrence after improvement | Total frequency | ||||
| Oct.-63 | Nov.-63 | Dec.-63 | Oct.-64 | Nov.-64 | Dec.-64 | ||||
| 1 | Servomotor Alarm | 45 | 87 | 32 | 164 | 3 | 1 | 3 | 7 |
| 2 | Emergency Alarm | 41 | 57 | 75 | 128 | 6 | 2 | 4 | 12 |
| 3 | Proximity Alarm | 29 | 34 | 39 | 102 | 2 | 0 | 3 | 5 |
From the problems that have been analyzed, corrected, and prevented, all of the topics mentioned above are based on the principle of Total Productive Maintenance. The activities in Pillar 1, improvements to reduce losses (Focus Improvement), and the activities in Pillar 2, Autonomous Maintenance, there is a schedule to check and maintain the cutting machine daily by applying visual management techniques to allow easy and quick inspection and assign operators to operate. The daily inspection and maintenance schedule of the cutter is listed in Appendix B.
The results of the correction improve the overall OEE efficiency of the cutter.
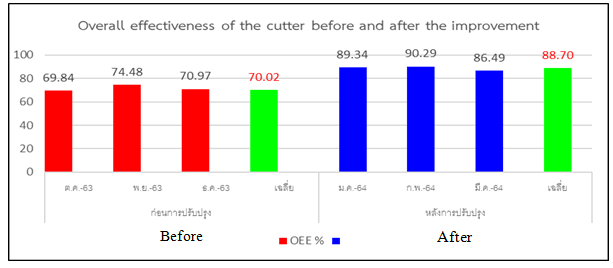
After the improvements obtained from the Why-Why analysis was implemented, the average overall efficiency of the cutter was increased. Before the improvements, from October 2020 to December 2020, the efficiency of the machine was 70.02%. After the improvements, from January 2021 to March 2021, efficiency was 88.70%, an increase of 18.68%. The results of the cutter adjustments were calculated as shown in the OEE measurement data tables in Table 5, Table 6, Table 7, Table 8, and Table 9, all of which compare the overall effectiveness of the cutter before and after the adjustment.
| Table 3 Average Uptime For The Utilization Rate, The Utilization Efficiency, And The Cutter Quality Rate After Adjustments From January 2021 To March 2021 |
|||||
|---|---|---|---|---|---|
| List | After improvement | ||||
| Jan.-64 | Feb.-64 | Mar.-64 | Total | Average | |
| Work load time (minutes) | 27,840 | 26,880 | 29,760 | 84,480 | 28,160 |
| Planned stop time (minutes) | 5,220 | 5,040 | 5,580 | 15,840 | 5,280 |
| Loss time from stopped machine (minutes) | 300 | 120 | 470 | 970 | 323 |
| Loss time from power down (minutes) | 870 | 840 | 930 | 2,640 | 880 |
| Waste production time (minutes) | 1,305 | 900 | 1,860 | 3,570 | 1,190 |
| Table 4 Calculation Results of Cutter Walking Rate After Adjustment |
|
|---|---|
| Finding the running rate (Availability) | |
| Workload time | = Total Time - Planned Stop Time |
| = 1173 – 220 | |
| = 953 Hr. | |
| Operating time | = Workload time - time wasted from stopped machines. |
| = 953 - 13.45 | |
| = 939.55 Hr. | |
| Operating rate | = Operating time/loading time |
| = 939.55/953 | |
| = 0.99%=98.59% | |
| Table 5 Calculation Results For Cutting Machine Working Efficiency After Improvement |
|
|---|---|
| Performance Efficiency | |
| Net operating time | = Run time – Time lost from power outages |
| = 939.55 – 36.66 | |
| = 902.89 Hr | |
| Operation efficiency | = Net operating time/Operating time |
| = 902.89 – 939.55 | |
| = 0.96%=96.10% | |
| Table 6 Results of The Calculation of The Quality Rate After Improvement of the Cutter |
|
|---|---|
| Quality Rate | |
| Net operating time at which the value occurred | = Net operating time – Time lost from waste production |
| = 909.89 – 49.58 | |
| = 853.31 Hour | |
| Quality rate | = Operating time/Loading time |
| = 853.31/902.89 | |
| = 0.94%=94.51% | |
| Table 7 Calculation Results for The Overall Effectiveness After Improvement Of The Cutter |
|
|---|---|
| Determination of overall effectiveness OEE | |
| OEE | = Operating rate (A) x Operating efficiency (P) x Quality rate (Q) |
| = 0.99 X 0.96 X 0.94 think %=88.70% | |
| Table 8 Comparison of Overall Efficacy Values of The Cutter Before and After The Improvement |
||||||||||
|---|---|---|---|---|---|---|---|---|---|---|
| List | Before improvement | After improvement | ||||||||
| Oct.-63 | Nov.-63 | Dec.-63 | Total | Average | Oct.-64 | Nov.-64 | Dec.-64 | Total | Average | |
| Work load time (minutes) | 24,000 | 24,960 | 22,080 | 71,040 | 23,680 | 27,840 | 26,880 | 29,760 | 8,4480 | 28,160 |
| Planned stop time (minutes) | 4,500 | 4,680 | 4,140 | 13,320 | 4,440 | 5,220 | 5,040 | 5,580 | 15,840 | 5,280 |
| Time lost from stopped machine (minutes) | 3,815 | 4,120 | 2,989 | 10,924 | 3,641 | 300 | 120 | 470 | 970 | 323 |
| P-Time lost from power down (minutes) | 750 | 780 | 690 | 2,220 | 740 | 870 | 840 | 930 | 2,640 | 880 |
| Q-lost time from waste production (minutes) | 2,250 | 234 | 1,380 | 3,864 | 1,288 | 1,305 | 900 | 1,860 | 3,570 | 1,190 |
| OEE % | 69.84 | 74.48 | 70.97 | 215.29 | 70.02% | 89.34 | 90.29 | 86.49 | 266.12 | 88.70% |
Conclusion and Discussion
This research studied the production of chicken parts at a slaughtering and processing plant - a sample factory reviewed by the researcher. Problems occurred when the operation of machinery failed repeatedly, preventing it from working efficiently. The equipment studied was chicken cutting machines. The cutting process is a bottleneck workflow. Therefore, it must be maintained to ensure that the machinery operates effectively and is always available. The concepts and methods of multi-participative maintenance with improvements to reduce losses with overall effectiveness were used to facilitate this research. The results of the study are as follows:Loss can be reduced through the efficient operation of the broiler trimmer. With overall effectiveness as an indicator, results showed that the productivity of the cutter increased 18.68%, from an average of 70.02% before the improvement to an average of 88.70% after the renovation.
Research operations can improve the reduction of cutting losses and increase the overall productivity of the cutter. The correlation and feasibility of the OEE revision study (APQ) comparison before and after the revision was the focus of this research. Hemant & Pradesh (2012) began to apply the principles of the TPM system to increase OEE value, focusing on eliminating the six major losses affecting OEE value, which was analyzed and found to be 67% - substantially lower than the minimum of 85% set by international standards. Improvements made in Autonomous Maintenance and Focused Improvement increased the OEE value. In line with Harsha, Mahesh & Kishan (2009), the principle of the overall effectiveness of OEE machines is applied to improve the CNC Machine Shop. The OEE value should be at the international standard of an 85% rate, with 90% operation, 95% operation efficiency, and a 99% quality rate. OEE measurements were taken for three months and compared to targets. Improvements were made by applying the principles of TPM and 5S methodology focusing on solving broken machinery problems by using cause and effect charts to analyze the causes, setting corrective measures, and improving performance among employees. As a result of the improvements mentioned above, the OEE value increased from 42% to 72%.
Sharma, Bhave, Khurasia & Shikari (2002) have studied the interruption of machines. As a result, the OEE value was 65%. Modifications were made with the implementation of the TPM system. Policy goals of implementing the TPM system in revisions were set to increase the OEE, resulting in a 20% increase in the OEE value, in line with Jadhav, Morosin, & Sawant (2004) in developing the TPM system. The OEE target must be at least 90%, with the focus on reducing the six losses that affect the OEE value. Combined with the use of the 5S principles as the basis of the TPM, the OEE value will increase and reduce customer complaints. This research led to Total Productive Maintenance (TPM), Focused Maintenance, and Autonomous Maintenance, focusing on reducing six significant losses that affect the operation of machines and the overall efficiency of the device. Overall Equipment Effectiveness (OEE) is a measure of the loss reduction performance applied to this research. To increase the OEE, a study of the condition of the current running of the machine first calculates the OEE value of the working condition of the device. If it is less than 85%, it means that the device still has high losses. Corrections can be made using analytical tools such as Pareto Diagrams to sort the importance of the causes for low OEE values by using the 80:20 principles to select which topics affect the loss incurred. Upon knowing the cause of the problem to be corrected, why-why analysis is used to determine the root cause, or the real cause, of each issue, etc. Focused Improvement, in the form of preventing recurrence, reflects Autonomous Maintenance. The principle of visual control is also applied and requires machine operators to inspect the machines regularly so that the device is ready for use and operates efficiently.
There is a broiler parts cutting machine at the sample factory that still incurs loss of productivity due to breakdowns. Therefore, it needs to be systematically revised in the same way the cutting machine was improved to reduce losses and raise the overall production value of OEE as measured according to international standards.
References
- Boonsong, K. (2002). Overall effectiveness improvement of compound mixer in rubber auto parts factory. Master's Thesis. Department of industrial engineering faculty of engineering, Chulalongkorn University.
- Chaisit, W. (2004). Increasing the efficiency of production by applying clean technology principles to the production of turmeric capsules. Case study of Tha Sae Hospital, Chumphon Province.
- Chanchai, P. (2006). Machine efficiency improvement manual. Study on the efficiency of production in Bangkok National Productivity Institute.
- Chanon, I. (2013). To increase the Overall Effectiveness of machinery (OEE) in a plastic additive manufacturing plant. Master of Business Administration Thesis in Logistics Management, Graduate School, University of the Chamber of Commerce.
- Harsha, G.H., Mahesh, N.S., & Kishan, D.S. (2009).Overall equipment effectiveness improvement by TPM and 5S Techniques in a CNC Machine Shop, 8(2), September 2009
- Hemant, S.R., & Pratesh, J. (2012). A Total Productive Maintenance (TPM) approach to improve overall equipment efficiency. International Journal of Modern Engineering Research, 2(6), 4383-4386
- Lak, K. (2001). Productivity Principles, 2nd printing, Bangkok National Productivity Institute.
- Pradeep, S., Vishwas, B., Khurasia, H.B., & Shikari, B. (2002). Enhancing overall equipment effectiveness through TPM. Journal of Operation and Production Management, 18(5), 495-507.
- Premchai, M. (2019). Optimization of tapioca starch production process with clean technology concept. Company case study Charoen marketing master of business administration thesis Co., Ltd. Industrial management engineering faculty of industrial technology Lampang Rajabhat University.
- Ranjeet, M.J., Morosin, A., Sawant, S.H. (2004).Total productive maintenance theoretical aspect: A journey towards manufacturing excellence. IOSR Journal of Mechanical and Civil Engineering (IOSR-JMCE), ISSN: 2278-1684,1(1), 51-59.
- Rattakorn, U. (2010). Overall efficiency improvement of machinery in refractory brick production process. Master's Degree Thesis. Industrial engineering department of industry, faculty of engineering Chulalongkorn University.
- Sakda, W. (2010). Improvement of overall efficiency of machines in the manufacturing process of electric wire, Master's Thesis. Industrial engineering department of industry faculty of engineering Chulalongkorn University.
- Suthirat, S., & Pornthip, S. (2019). Study on the enhancement of production efficiency by applying clean technology principles to the production of turmeric capsules. A case study of Tha Sae Hospital.
- Uthen, C. (2010). To increase the productivity of cooked chicken products by increasing the efficiency of the fryer because the frying machine's productivity does not meet the specified goals. A case study of a semi-finished food factory. Industrial Engineering, Faculty of the Engineering Rajamangala University of Technology, Thanyaburi.
- Weerachai, M., & Wimon, C. (2010). To increase productivity by the OEE method or improve the overall efficiency of pellet machinery in an aquatic feed mill. Master of business administration thesis technology faculty of industrial technology, Songkhla Rajabhat University.
- Wirachai, M., & Wimon, C. (2010). Increasing productivity by improving productivity. Overall of the machine Case study of animal feed factory, Journal of Industrial Technology, 6(2), 17-25.
