Research Article: 2023 Vol: 27 Issue: 2S
Implications of Economic Diversity & FDI on Business Ventures in the GCC
Hawraa Akbar, Kuwait University
Randa Diab-Bahman, Kuwait Technical College
Anwaar Al Kandari, Kuwait Technical College
Citation Information: Akbar, H., Diab-Bahman, R., & Kandari, A.A. (2023). Implications of economic diversity & fdi on business ventures in the gcc. Academy of Accounting and Financial Studies Journal, 27(S2), 1-18.
Abstract
The main purpose of the study is to investigate the impact of economic diversification efforts, particularly fluctuations in FDI inflows, in the GCC. To examine the main points, UNCTAD (1993) model will be used as the main determination of FDI in Kuwait, as well as UNCTAD (1976) model for evaluating the Emirates. The research is conducted using quantitative data from the World Bank official website data from 1993 to 2015 for Kuwait, and Emirate from 1976 to 2015. Furhter, an ARDL model and Causality analysis are used to analyse the static data. The main result of this paper indicates that a main factor that effects the countries FDI is the GDP. This result is consistent with previous studies as most of FDI flows to oil and natural resource sectors which brings foreign investments into both countries, which has a significant impact on FDI. The other unexpected result of this research is that there is no significant impact between FDI and economic growth for both Kuwait and Emirates.
Keywords
Economic Diversity, GCC, FDI, ARDL, GDP.
Introduction
Kuwait, a country with one of the world’s highest GDP per capita (SOURCE), is a small country that have strategic place worldwide that represent the economy demonstrated by government and oil industry. About 95% of the country’s GDP comes from exporting oil, which also brings the foreign currency to the country. In 1991 the economy slightly increased and from 2000 to 2008 the country reached growth by increase the number of GDP. The other significant contributors to the country’s non-oil economy are the private sector, the financial sector, public sector, transportation and communication, and manufacturing. Though globally considered a high GDP country within the GCC, it still has a long way to go when it comes to attracting foreign investors. In fact, the country is far behind in terms of foreign capital inflow compared to other GCC countries. Though it is investing capital in its GCC partners and neighbors, the country has not done much to lead the economy away from its oil-sector income, which its GDP heavily relies on. Unfortunately, the country’s economy has not much diversified its outlets and almost completely depends on oil prices. In the meantime, neighboring countries such as Qatar, United Arab Emirate and Saudi Arabia have come a long way in terms of diversifying their economies, leaving Kuwait far behind while they expanded various sectors such as tourism, finance, and transportation sectors and even Technology. Despite the emergence of economic diversifying means, scholars argue that their emergence and importance is rarely studied (Salamzadeh et al., 2017; Doshmanli et al., 2018; Al Rashidi et al., 2021).
However, Kuwaiti government took two initiatives to reach elevated levels of diversification of the economy in 2010, which included a bill that allows selling government property to private investors, and monetary package of $130bn in order to set over 5 years to boost foreign direct investment include private sectors participation in the Kuwait economy. As for the UAE, the country is ranked as one of the world’s top ten richest nations and descends much of its wealth from abundant reserves of oil and tourism. Yet, the UAE has an open trade policy to make sure that the destination continues to attract more investments from all around the world. UAE continues to impress on a global scale, being hailed as a leader in the region for its diversification efforts. In this paper, the research will focus on presenting key facts and figures to investigate the impact of economic diversity on GDP. It will start with stating the problem, then discuss the literature available on the matter, followed with the methodology of the research and the key findings and discussion. Lastly, the significance and impact of the research is presented along with the conclusion.
Problem Statement
Due to the global concerns over oil prices and climate concerns for oil production, the oil rich GCC countries are best off considering diversifying their economies to have more than one source of income. To do so, they are encouraged to increase their efforts to bring in more foreign investors into the country. Though there is a plethora of research on the importance of diversifying a country’s economy and the positive effects of foreign direct investments (FDI’s), there is little research done on the matter within Kuwait (Diab-Bahman, 2021). Thus, this research will aim to answer the following important questions in order to give policy makers better answers and motivations to embark on such important projects:
1. Do FDI inflow relate to the size and growth of output in Kuwait? 2. To what extent can FDI impact GDP in Kuwait? 3. What are some factors explaining differences in FDI between Kuwait and the UAE?
It is also important for policy makers to better understand the efforts being made by their neighbors to track their own success. Thus, this research will compare the FDI’s of Kuwait and the UAE, one of the local pioneers in the field of diversifying the economy. The significance of this research is that it extends the already existing literature on the topic and enriches it as there is a dearth of information and research coming out of the Middle East, particularly in the GCC. As well, it contributes to fact-based decision making as it gives politicians and decision makers more insight on dynamics that effects the countries FDI is the GDP. The inclusion of all relevant research is always encouraged as discussed (Salamzadeh, 2020). As well, there is a particular lack of research within such economic matters after the pandemic (Diab-Bahman et al, 2021).
Foreign Direct Investments (FDI)
The electric analysis framework is mostly used to analysis the movement of FDI, and the FDI decisions are affected by three main advantages or factors which are: firstly, the company create assets or acquire to give them benefit over local company in the host country. Secondly, the company could choose various locations to overcome trade restrictions, differences in host government policies or factors cost. Thirdly, the factor is the internalization process that the companies can keep their foreign ownership benefits under their own regulation, instead of utilizing licensing and other arrangements. Specially, this process two main set of factors are required to influence the company decision to produce a particular commodity in a specific country. The external factors contain interaction of host country characteristic, which are: size of the market, factor price, factor intensities, and availabilities of certain resource that could explain the desirability of manufacturing product in particular country. The internal factors, which help to determine the ownership of production that could depend on the benefit of attributable to the home countries that is related to attributable to individual company-specific characteristic that will differentiate them from other companies in their own countries and industries (United Nations, 1993).
Moreover, the technology which is known as high transaction costs in enforcing contract and regulating, especially in case of intangible assets over the establishment of foreign affiliates in the host country. Research and development are considered as specific motivations that lead to having a competitive advantage in the foreign marketplaces, furthermore the top talent of skilled labor needed to have in scientific community regard host country. The relative cost in the host country includes unit-labor cost and wage rate considered as another factor they might influence FDI inflows. In addition, the rate and the size of growth represent as crucial factors the effect the FDI inflows in the host country. The export orientation its import substitution opportunities and transportation cost in the host country with low cost beneficial. The location production which is represent exploiting potential advantage of economic of scale. Finally, the company size, natural resources, and location are considered as factors that encourage them to invest in the host country (United Nations, 1993).
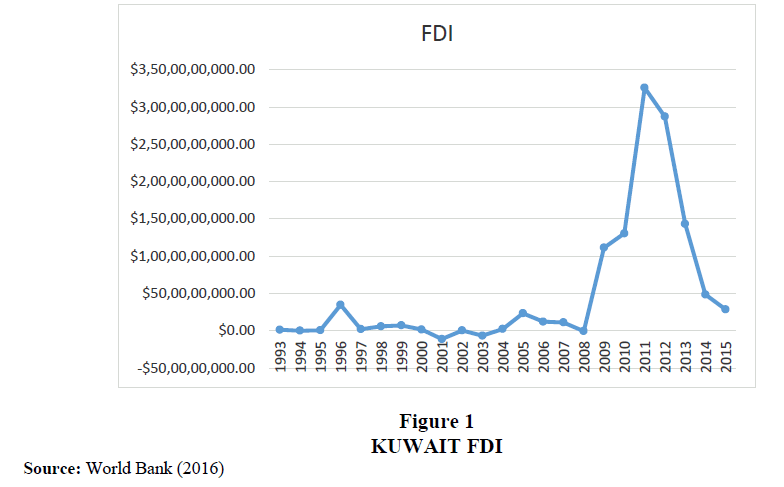
The figure 1 above states that from 2008 to 2009 shows an increase in FDI, however from 2009 to 2010 there is a slight increase there. In 2010 to 20111 there is a dramatic increase in foreign direct investment. And from 2011 to 2012 there is slightly decrease in FDI, and from 2012 to 2013 there is a recession. It’s continued decreasing from 2013 to 2014. Finally, from 2014 to 2015 there is slightly change which represent negative changes (World Bank, 2016).
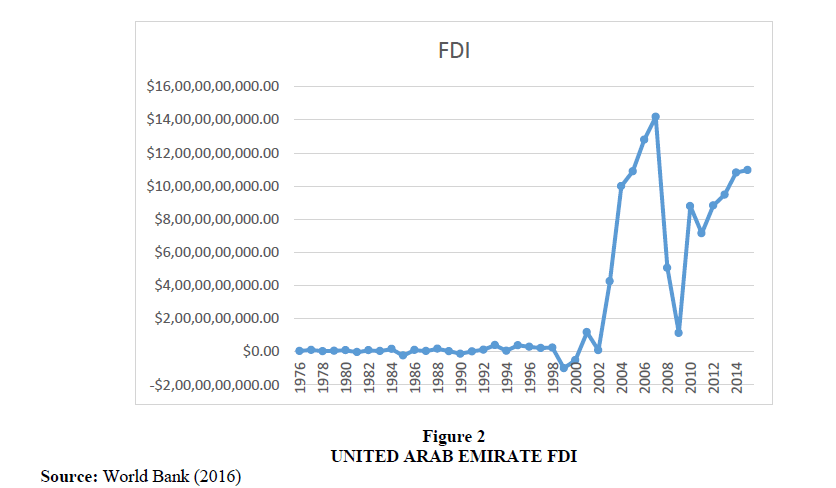
The figure 2 shows that from 2000 to 2002 there is a slight increase, then from 2002 to 2004 there is an increase in FDI from 2004 to 2006 there is a dramatically increase. In 2007 the FDI reach the peak. However, in 2008 and 2009 there is sharply decrease in FDI. In 2010 the FDI stat to increase and from 2010 to 2012 there is dramatically increased and counting increasing unit 2015 (World Bank, 2016).
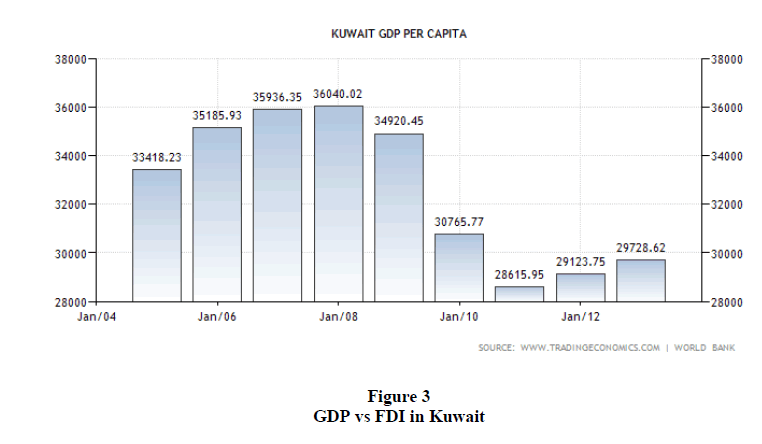
Kuwait has a positive inflow of FDI recorded in 2009, however the country is far behind in terms of foreign capital inflow compared to other GCC countries. The country has attracted $81ml of FDI in 2008, despite the fact Qatar and Saudi Arabia attract $5.5bn and $28bn respectively figure 3. The country is investing capital in GCC partners, on the other hand the country did not do much to lead the economy away from oil-sector incomes in comparison to its gulf neighbors.
Unfortunately, the country’s economy has little diversified which indicates that the wealth of the country still depends on oil prices. Most neighboring countries including Qatar, United Arab Emirate and Saudi Arabia have expanded on banking, tourism, finance, and transportation sectors to name a few in order to attract foreign investments into their countries. On the other hand, Kuwait is far behind from its counterparts primarily due to continuous inner political conflict, which deflect the importance for nation projects which usually fall to the background.
The United Arab Emirates GDP
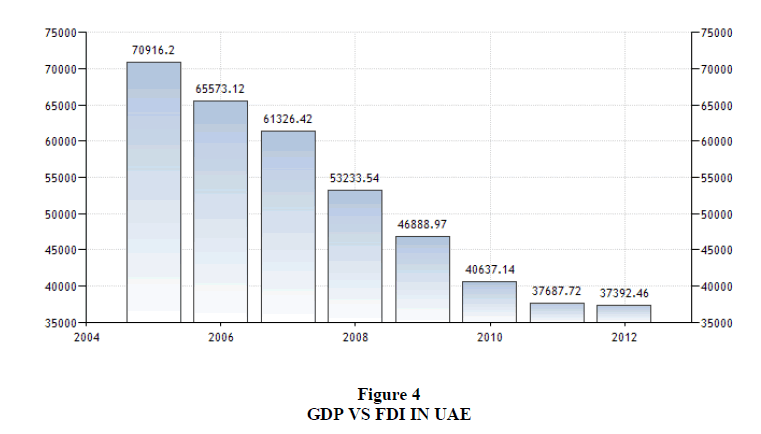
The country ranks number nine in the world’s top ten richest nations and descends much of its wealth from abundant reserves of oil and tourism. The UAE’s capital city Dubai is famed worldwide as a major trading destination, as well as a major tourist attraction. UAE has an open trade policy to make sure that the destination continues to attract more investments from the world over the country. UAE has an average GDP per capita of $24077.73 figure 4.
In comparison to other GCC countries Kuwait is the 4th place of the total GDP. The first place is Saudi Arabia, the second is United Arab Emirate and the third which represent the last decade Qatar. Because of Iraqi invasion Kuwait was delay 10 years back from the total success.
Kuwait at a Glance
The country is dependent on international trading because oil deposits are too big to be commodification and local production capacities of consumer goods are too far to meet their demand. As was mentioned above the country mainly depended on exporting crude oil and hydrocarbon products, about 95% of the total export. Moreover, the high oil prices Kuwait is continually experiencing a positive balance of trade. The biggest importers of the country oil are mostly located in Asia including Japan 14.2%, South Korea 18.3%, China 9.9%, India 13.4% and United Sate 8.7% share in 2011. In addition, the total volume of the country’s exports in 2011 was almost $95bn compared to 2010 by $67bn because of the global economy recovery which led to increase of the oil price. The rest, which includes 5% of the country’s exports, is mostly re-export of transportation and machinery equipment.
The country imports from USA about 11.9% , China 9.3%, India 10%, Japan 5.9%, South Korea 6.3%, Saudi Arabia 8%, UAE4.1% and Germany 4.8% in 2011. The country’s top priority products it’s has to buy abroad are beverages and food, clothing, construction materials and product of automotive industries. The total volume of the country export in 2011 was $22bn in comparison to 2010 by 20bn. The country has the highest per capital import rate compared to other countries because of the high private consumption demand and the large government project.
Government (Sovereign) Bond
Debt is considered a security issued associated by national government within given country with denominated in foreign currency, associated with the Iraqi invasion which implement a huge public debt almost double government GDP. However, after 20 years of positive balance of payment Kuwait has public debt around 6.8% of GDP in 2011. Recently the country has owned a sight more than $10bn what can be distributed by $2600bn between whole country populations. Later in 2012 the country Treasure decreased the yield of its one-year bonds to 1.25% per annum, which was a very low rate. The total foreign assets kept by country -$320bn, which means equal to double country GDP. In addition, according to the World Bank Kuwait net foreign assets are equal to over $11bn, include foreign exchange revenue equal to $26bn for the country.
During the great recession, the country’s central bank had a discounted rate up to 6.25%, however the crisis has pushed the local Central bank in order to decrease it. Moreover, all the Gulf region currencies are tied to United Sates dollar except the Kuwaiti dinar that is pegged to undisclosed basket of currencies, which lead to have different indicators of inflation. There was 5.6% inflation in 2011 mostly associated by an increase in food consumer purchase index, which represent the second biggest in the Kuwaiti consumer basket by 18% share. The Kuwaiti dinar is the most valued currency in the world, which is the average price of it was above 3.5 USD and around 2.8 EUR in 2012. Other known factors impacting FDI include:
Exchange rate effects
The effect on rate exchange has been examined with respect to changes in the volatility of the exchange rate and in the bilateral level of the exchange rate between countries. In addition, the exchange rate would not alter the decision by the company to invest in foreign country Bloigen (1997), and appreciation of the company home’s country’s currency would decrease the cost of assets abroad , leaving the rate of return identical , the normal return decrease as well as in the home currency. The currency could increase foreign investment by the company, Klein & Rosegren (1994) imperfect capital market stand for internal cost of capital is lower than borrow form external resource. The appreciation of the currency leads to increase the company wealth Stevens (1998) and provides the company grater low-cost fund to invest relative to the counterpart company in the foreign country that experience the devaluate of their currency.
There is another factor can change the exchange rate level which affect the inward FDI for a host country, if FDI by the company motivated by acquisition of asset that are transferable within a company across many markets without currency transaction such as: technology and managerial skills, Bruce (2005) which led the forging currency to lower the price of asset. (Foreign companies operate in a global market).
Taxes
Interest in the effects of taxes on FDI has be essential for both public economists and international (De Mooij & Ederveen, 2003). The higher taxes discourage FDI with more essential question one of magnitude and the effect of taxes on FDI can be very substantially by the type of taxes, Bruce (2005) tax treatment in the host and parent countries, Hines (1996) and measurement of FDI activities. The double taxation issue, Hartman (1984) indicates tax in both home and host countries which expect to effect of taxes on FDI.
Institution
The quality of institutions is mostly an essential determinant of FDI activity and for less development countries for many reasons such as: firstly, poor legal protection of assets higher the chance of expropriation of the organization assets which lead to lower the potential to invest there. In addition, poor quality of institutions important for well-functioning markets Bruce (2005) lead to diminish FDI activity and increase the cost of doing business. Finally, to add that poor institutions reflect to have poor infrastructure such as public goods, which lead to expectation of the probability will decrease as does FDI into a market.
Trade protection
The higher trade protection must make the organization most likely to substitute affiliate production for exports in order to avoid the costs of trade production Blonigen & Figlio (1998), which commonly termed tariff jumping FDI. In addition, data-driven, Bruce (2005) which it’s difficult to quantify non-tariff forms of protection in a consistent fashion surround industries (Kogut & Chang, 1996).
Trade effect
It involves decreasing the fixed costs, on the other hand higher the variable costs of trade barriers and transportation regard of exporting products. Servicing the market with affiliate sales from FDI lets one to substantially decrease these variables costs Buckley & Casson (1981), however mostly involves higher fixed costs than exports. Blonigen (2001) this result that the suggestion of natural progression form export to FDI once the foreign market request for the MNE’s goods reach a large enough scale size. The host countries tend to decrease or increase the MNE’s in term of exporting, Bruce (2005) however it has tended that the market led them to the same direction.
Market size
The large market size led to more potential of consumption and more opportunity for trade, and the country that has a large market size gain the benefit of receive more inflows than copier to the other small countries. The market size can be measured by Gross Domestic Product (GDP), Bruce (2005) the GDP per capita income and size of the middle-class population (Lankes & Venbles, 1996; Resmini, 2000; Duran, 1999; Garibaldi, 2002; Nunes et al., 2006; Sahoo, 2006; Asiedu, 2002). The expected sign is positive and significant determination of FDI flows.
Economic stability and growth prospects
The higher market growth is associated with a potential lager market and more promising prospects. There is a tendency of flow into the countries with higher economic growth rate and larger market size represent lager economic of scale, which provided for FDI to exploit their ownership advantages. A country which has high and sustain growth rate condition with a stable macroeconomic will receive more FDI inflows than a more volatile economy (Culem, 1988). The proxies measuring growth rate are industrial production index, Bruce (2005) GDP growth rate, inflation rate, interest rates (Duran, 1999; Dassgupta & Ratha, 2000).
Trade openness
The trade include import and export is more complements rather than substitutes regard of the FDI. Multinational enterprises (MNEs) are most frequently invested in the trade partner markets with which they are familiar (Bruce, 2005). Much of FDI is export oriented and might also require the import of complementary, capital goods, and intermediate (Lankes & Venables, 1996; Asiedu, 2002; Sahoo, 2006). Trade openness is mostly expected to be a positive and significant determinant of FDI, its proxies as ratio of import plus export divided by GDP (Nunes et al., 2006).
Infrastructure facilities
Advance infrastructure facilities and well established describes the prosperity of the country and provides a good opportunity for FDI Bruce (2005). A country that has a chance to attract FDI inflows will stimulate a country to equip itself with great infrastructure facilities. A chance of having positive effect of infrastructure facilities associated with FDI inflow will not be denied.
Labor cost
Higher labor cost in the home country which expected to pull the FDI to the host country (Bruce, 2005). The high level of labor cost will lead to an increase in the production cost associated with the less FDI inflow or FDI outflow. Labor cost can be proxies by the wage rate (Lankes & Venables, 1996; Nunes et al., 2006).
Gross capital formation
Higher gross capital formation associated with greater economic growth which led to improvement in the investments, especially the investment climate which further helps to attract higher FDI inflows. Libor (2001) the most important aspect of FDI in the selected sample of countries which is related to ownership change (Bruce, 2005). On the other hand, a positive or negative and significant relationship between Capital Formation and FDI is expected.
We used UNCTAD 1993 because the model is applied for all reigns and the predicted power is more than 85%.
Methodology
The data necessary for this research was collected from the World Bank website (www.worldbank.org, 2018). The collection entailed quantitative obtained data is from 1993 to 2015 that represent Kuwait, and quantitative obtained data is from 1976 to 2015 which represent UAE. The research focused on analyzing the change in FDI indices of Kuwait and Emirates using various graphs and compared the findings for the two countries. In addition, that previous step drove the researcher to state the hypothesis. Then, the researcher prepared the mathematical model and econometric model which represent a linear model. The following step is to test the econometric model through using Eviews program.
Mathematical Model
The theory states that the relationship between GDP and FDI inflows is positive, we expected β2 to be greater than zero. According to the Growth and FDI inflows are expected to have a positive relationship therefore β3 is expected to be greater than zero.
E [FDI | GDP, Economic growth, Exchange rate] = β1 + β2 GDP + β3 Economic growth + β4 Exchange rate β2>0, β3>0 β4<0 Equation (1)
β4 (exchange rate) has insignificant impact, therefore we will cancel the exchange rate (has positive and negative impact) for all GCC countries. One of the theory states that there is an inverse relationship between FDI inflows and exchange rate depreciation. The host country currency depreciations, FDI inflows will increase, and this will make the sign of the slope negative.
The other theory states that depreciation of exchange rate in the host country is sign of political and financial instability making it’s less attractive for foreign investors, in this situation the sign of the slop is positive because a decrease in the value of local currency leads to decreases in FDI inflows because the contradictory theories surrounding the Exchange Rate and FDI flows effects we expect that β4 will be insignificant Tables 1 to 3.
Econometric Model (UNCTAD, 1993)
| Table 1 Kuwait |
||||
|---|---|---|---|---|
| Series Name | FDI | GDP | growth | EX |
| 1993 | 13252115.53 | 58748043615 | 33.99046707 | 0.3018386 |
| 1994 | 10000 | 63704125960 | 8.436165768 | 0.296870315 |
| 1995 | 6701341.174 | 66799057920 | 4.858291224 | 0.298447721 |
| 1996 | 347351454.6 | 67203277041 | 0.605126978 | 0.299408563 |
| 1997 | 19779208.98 | 68865432659 | 2.473325247 | 0.303348835 |
| 1998 | 59063714.13 | 71387322749 | 3.662055103 | 0.30475564 |
| 1999 | 72269842.45 | 70110196790 | -1.789009463 | 0.304414667 |
| 2000 | 16299834.37 | 73401577460 | 4.694581988 | 0.306751583 |
| MEAN | 504270726.1 | |||
| STDEV | 918713706 | |||
| MIN | -111516284.5 | |||
| MAX | 3259067552 | |||
Data source: World Bank (2016).
| Table 2 UAE |
||||
|---|---|---|---|---|
| Series Name | FDI | GDP | Growth | Ex |
| 1976 | 49430000 | 65320190085 | 16.5268565 | 3.953072499 |
| 1977 | 112240000 | 79324401300 | 21.4393302 | 3.903247499 |
| 1978 | 39120000 | 78063457999 | -1.5896033 | 3.871210832 |
| 1979 | 64580000 | 94397122680 | 20.9235731 | 3.815675832 |
| 1980 | 97640000 | 1.16934E+11 | 23.8747749 | 3.707364999 |
| 1981 | -16940000 | 1.22382E+11 | 4.65917667 | 3.670999999 |
| 1982 | 95060000 | 1.14159E+11 | -6.71931619 | 3.670999999 |
| MEAN | 2917967693 | |||
| STDV | 4602467879 | |||
| MIN | -985340000 | |||
| MAX | 14186521443 | |||
United Arab Emirate source: World Bank (2016)
Linear model
| Table 3 Unit Root Test |
||
|---|---|---|
| H0 | Kuwait | Emirates |
| FDI has a unit root | 0.0714 | 0.3708 |
| GDP has a unit root | 0.2007 | 0.8661 |
| GROWTH has a unit root | 0.0621 | 0.0007 |
FDI t = β1 + β2 GDP t + β3 Economic growth t + β4 Exchange rate t + e t Equation (2)
ARDL model
FDI = β1 + β2 GDP t + β3 GDP (t-1) + β4 Economic growth t + β5 Economic growth (t-1) + β6 Exchange rate t + β7 Exchange rate (t-1) + β8 FDI (t-1) + e t Equation (3)
Data Tables
Empirical Findings
Unit Root test it’s one of essential test that help to know the best model, through conduct that the model has a spurious regression or not and the type of time series.
H0: FDI has a unit root. Kuwait
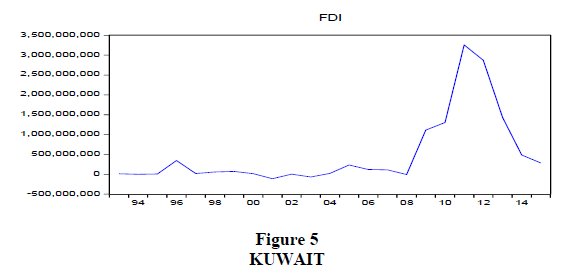
Referring to the FDI graph for Kuwait the time-series here has wandering around nonezero mean, and there is a random walk with drift intercept, that mean it is the second type of time-series. The null hypothesis is true, because p-value is greater than 5% by 0.0714. As a result, this time-series is non-stationary and there is a spurious regression figure 5.
H0: FDI has a unit root. UAE
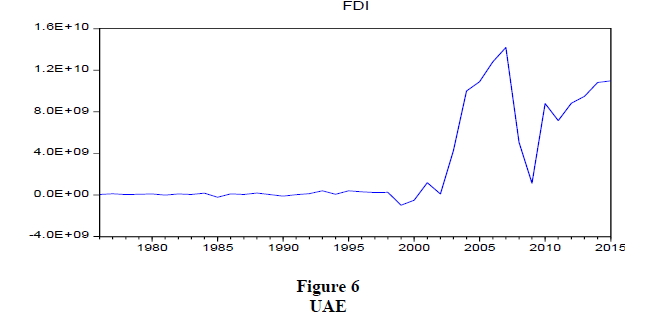
Referring to the FDI figure 6 for Emirates the time-series here has wandering around none-zero mean, and there is a random walk with drift intercept, which means it is the second type of timeseries. The null hypothesis is true because p-value is greater than 5% by 0.0714. As a result, this time-series is non-stationary and there is a spurious regression.
H0: GDP has a unit root. Kuwait
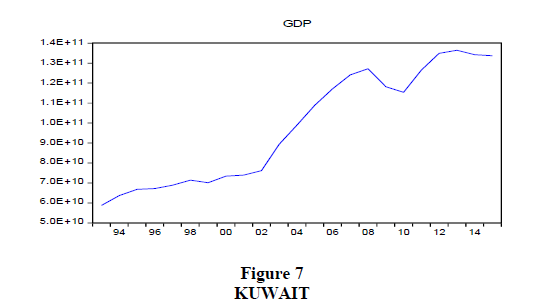
The GDP figure 7 of Kuwait, it is observed that there is a random walk between trends and intercept which is the third type of time-series. Because there is trend in the graph, the null hypothesis is true. In addition, there is a spurious regression, and this time-series is nonstationary.
H0: GDP has a unit root. UAE
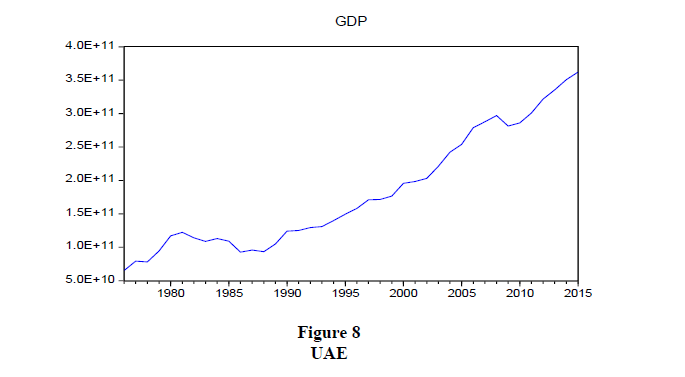
The GDP figure 8 of Emirates, it is perceived that there is a random walk between trends and intercept which is the third type of time-series (drift and trend). Because there is trend in the graph, the null hypothesis is true. In addition, there is a spurious regression, and this time-series is non-stationary.
H0: Economic growth has a unit root. Kuwait
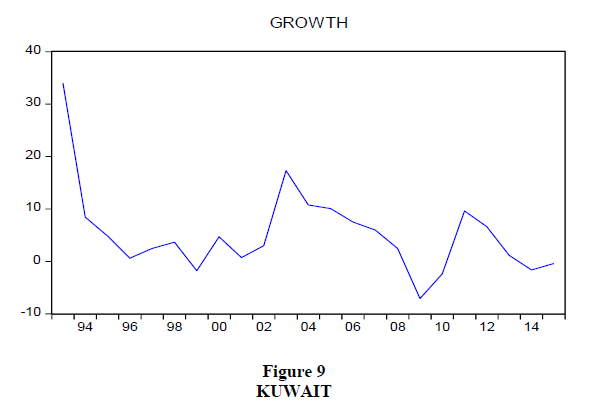
The Economic growth for Kuwait, state that the time-series here has wandering around none-zero mean, and there is a random walk with drift intercept, which means it is the second type of time-series figure 9. The null hypothesis is true because p-value is greater than 5% by 0.0621. As a result, this time-series is non-stationary and there is a spurious regression.
H0: Economic growth has a unit root. UAE
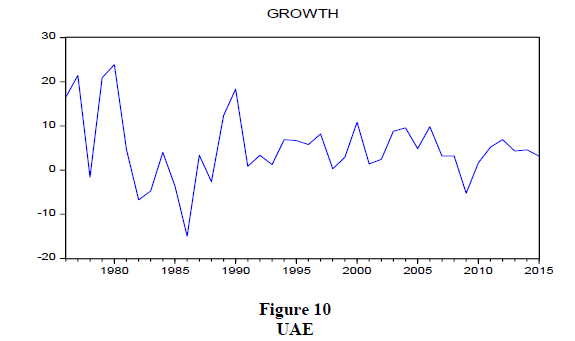
The growth for Emirates indicates that there is a random walk with intercept which is the second type of time-series figure 10. The null hypothesis is not accepted, the reason behind that is the p-value (0.0007) is less than 5%. That lead to conclude this time-series is stationary and there is no spurious regression.
Cointegration
| Table 4 Granger Causality Test |
||
|---|---|---|
| Kuwait | Emirates | |
| error | P-value 0.0085 | P-value 0.0010 |
Cointegration analysis is one of the main analyses that help to mandatory by check if Y and X are cointegrated or not Table 4. The relationship between them is stationary through there is no spurious regression or not. In order to estimate that we test the error term.
H0: E has a unit root. Kuwait
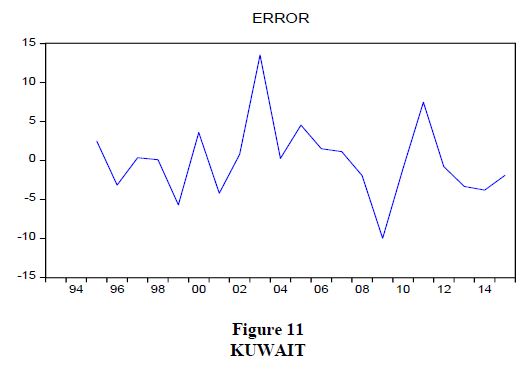
As the figure 11 for Kuwait show that the null hypothesis is not accepted because the Pvalue = 0.0026 less than 5% we reject H0; the relationship between Y and X is stationary, there is no spurious regression, and the variables are cointegrated.
H0: E has a unit root. UAE
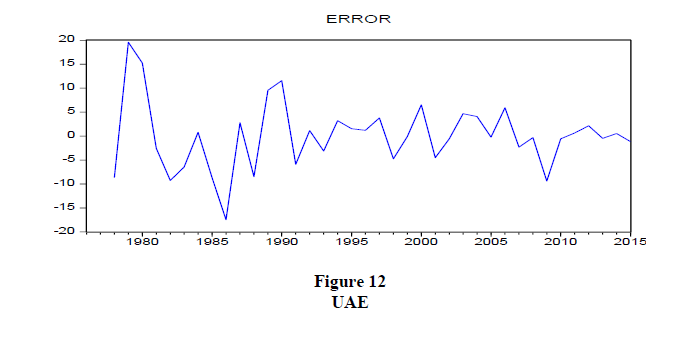
As the figure 12 for Emirates shows, the null hypothesis is not accepted because the P-value = 0.0000 less than 5% we reject H0; the relationship between Y and X is stationary, there is no spurious regression, and the variables are cointegrated Tables 5 to 7.
| Table 5 Linear Model |
|
|---|---|
| Variables | Kuwait |
| Constant | -1.37E+09 |
| GDP | 0.018760 |
| Economic growth | 7239959 |
| R squared | 0.317989 |
| Adjusted R squared | 0.249788 |
| Probability of (F-statistic) | 0.021773 |
| Akaike Information Criterion | 43.94856 |
| Schwarz Information Criterion | 44.09666 |
| Table 6 Linear Model |
|
|---|---|
| Variables | Emirates |
| Constant | -3.98E+10 |
| GDP | 0.046863 |
| Economic growth | 19088695 |
| R squared | 0.718832 |
| Adjusted R squared | 0.695402 |
| Probability of (F-statistic) | 0.0000 |
| Akaike Information Criterion | 46.24347 |
| Schwarz Information Criterion | 46.41236 |
| Table 7 Lm Test For Autocorrelations |
||
|---|---|---|
| Resid (-1)= E (error) | Linear model | ARDL model |
| Kuwait | 0.0010 (auto correlation) |
0.1279 ( solve auto correlation) |
| Emirates | 0.0004 (auto correlation) |
0.9578 ( solve auto correlation) |
In the LM test the linear Model for both countries are auto correlated because the P-value is less than 5% for Kuwait by 0.0010 and for Emirates by 0.0004. However, in LM test for ARDL model the problem of auto correlation has been solved, and P-value is bigger than 5% for Kuwait by 0.1279 and for Emirates by 0.9578 Table 8 and Table 9.
| Table 8 Ardl Model |
|
|---|---|
| Variables | Kuwait |
| Constant | 10210912 |
| GDP (t-1) | -0.086787 |
| GDP t | 0.089049 |
| Economic growth t | -64675245 |
| Economic growth (t-1) | -15635599 |
| FDI (t-1) | 0.653158 |
| R squared | 0.633251 |
| Adjusted R squared | 0.518642 |
| Probability of (F-statistic) | 0.003833 |
| Akaike Information Criterion | 43.64356 |
| Schwarz Information Criterion | 43.94111 |
| Table 9 Ardl Model |
|
|---|---|
| Variables | Emirates |
| Constant | -1.61E+09 |
| GDP (t-1) | -0.224198 |
| GDP t | 0.237371 |
| Economic growth t | -2.07E+08 |
| Economic growth (t-1) | 7262732 |
| FDI (t-1) | 0.517273 |
| R squared | 0.827467 |
| Adjusted R squared | 0.801326 |
| Probability of (F-statistic) | 0.0000 |
| Akaike Information Criterion | 45.87785 |
| Schwarz Information Criterion | 46.13378 |
Conclusion
The results indicate that there is no significant impact between FDI and economic growth in both countries. In addition, in Kuwait and Emirates, the ARDL Model is of better use than the Linear Model as the data above suggests. The chow test result shows that the model is not stable for both countries because p-value is less than 5%. As for the causality test, there is no causality between all the variables, FDI and GDP are both time-series with nonstationary, however the economic growth is time series and stationery. The relation between variables is also considered stationary. One of the limitations of this study is the number of observations less than 30 for Kuwait, therefore for future studies we can use more elaborate panel data to get better result. Also, human development was not taken as a main factor, which could be evaluated in the future as it could prove to be an important variable on the matter at hand. Moreover, panel data can be used in order to get more general results on both industry and country levels. In addition, future research can be done using a stable model instead of the one used in this research.
Implications & Limitations
The research findings are significant in that they further indicate the need for oil-rich countries whose GDP primarily depends on oil exports to diversify their economies. It also gives a clear indication that Kuwait’s neighboring countries have surpassed it in FDI efforts, leaving it far behind in comparison with GDP. One of the limitations in this study is that the number of observations was less than 30 for Kuwait, therefore for any future study it is recommended to use more panel data can be used to get more general result. Also, future papers can consider using a stable model. Also, in this research human development factors were not considered, which could be considered important variables for such studies. Finally, both industry and country level data could be considered.
References
Al Rashidi, F., Diab-Bahman, R., & Al-Enzi, A. (2021). The impact of socio-economic factors on human capital investments. International Journal of Entrepreneurship, 25, 1-14.
Indexed at, Google Scholar, Cross Ref
Asiedu, E. (2002). On the determinants of foreign direct investment developing counties: is Africa different?, World Development, 30(1), 107-119.
Indexed at, Google Scholar, Cross Ref
Blonigen, B.A. (1997). Firm-Specific Assets and the Link Between Exchange Rates and Foreign Direct Investment, American Economic Review, 87(3), 447-65.
Indexed at, Google Scholar, Cross Ref
Blonigen, B.A. (2001). In Search of Substitution Between Foreign Production and Exports, Journal of International Economics, 53(1), 81-104.
Blonigen, B.A., & David N. Figlio. (1998). Voting for Protection: Does Direct Foreign Investment Influence Legislator Behavior? American Economic Review, 88(4), 1002-14.
Indexed at, Google Scholar, Cross Ref
Bruce, A. (2005). A review of empirical literature on FDI determinants, University of Oregon and NBE, 1-30.
Indexed at, Google Scholar, Cross Ref
Buckley, P.J., & Mark, C. (1981). The Optimal Timing of Foreign Direct Investment, Economic Journal, 91(361), 75-87.
Indexed at, Google Scholar, Cross Ref
Cbk. (2016). Balance of payment of Kuwait, Central Bank of Kuwait, viewed 8 August 2016, <http://www.cbk.gov.kw/en/statisticsandpublication/statisticalreleases/quarterly.jsp?selYear=2015&selMonth=tcm%3A10-120325-1024&selTable=120440&publication-id=10&table-type=2&btn-submit=Submit>.
Culem, C.G. (1988). The locational determinants of direct investments among industrialized countries, European Economic Review, 32, 885-904.
Indexed at, Google Scholar, Cross Ref
Dasgupta, D., & Ratha, D. (2000). The role of short-term debt in recent crises, Finance and Development, 37, 54-57.
De Mooij, R.A., & Ederveen, S. (2003). Taxation and Foreign Direct Investment: A Synthesis of Empirical Research, International Tax and Public Finance, 10(6), 673-93.
Indexed at, Google Scholar, Cross Ref
Diab-Bahman, R. (2021). VLEs in a post-COVID world: Kuwait's universities. In Challenges and Opportunities for the Global Implementation of E-Learning Frameworks (265-283).
Indexed at, Google Scholar, Cross Ref
Diab-Bahman, R., Al-Enzi, A., Sharafeddine, W., & Aftimos, S. (2021). The effect of attendance on student performance: implications of using virtual learning on overall performance. Journal of Applied Research in Higher Education.
Indexed at, Google Scholar, Cross Ref
Doronin, D. (2013). Macro-level market analysis of Kuwait, Industrial Management Degree Program, 3, 1-45.
Doshmanli, M., Salamzadeh, Y., & Salamzadeh, A. (2018). Development of SMEs in an emerging economy: does corporate social responsibility matter?. International Journal of Management and Enterprise Development, 17(2), 168-191.
Indexed at, Google Scholar, Cross Ref
Durán, J.E. (1999). Los determinantes de la ied en los países de américa latina y el caribe: su impacto sobre el comercio y la integración regional, ECLAC, Mimeo.
ElKatiri, L, Fattouh, B., & Sagal, P. (2011). Anatomy of an oil-based welfare state: rent distribution in Kuwait, Oxford Institute for Energy Studies, 10, 1-40.
Fortin, C. (1993). Explaining and forecasting regional flows of Foreign Direct Investment, United Nations Conference on Trade and Development Programme on Transnational Corporations, 1-31.
Freepestelanalysis (2015). Pestel analysis of Kuwait, Analysis Tools, viewed 6 August 2016, <http://freepestelanalysis.com/pestel-analysis-of-kuwait/>.
Garibaldi, P., Mora, N., Sahay, R., & Zettelmeyer, J. (2002). What moves capital to transition economies?, IMFworking paper, WP/02/64.
Hartman, D.G. (1984). Tax Policy and Foreign Direct Investment in the United States, National Tax Journal, 37(4), 475-87.
Indexed at, Google Scholar, Cross Ref
Hayakawa, K., Kimura, F., & Lee, H. (2013). How does country risk matter for foreign direct investment, The Development Economics, 61-78.
Indexed at, Google Scholar, Cross Ref
Hines, J.R., Jr. (1996). Altered States: Taxes and the Location of Foreign Direct Investment in America, American Economic Review, 86(5), 1076-94.
Indexed at, Google Scholar, Cross Ref
Kia (2016). Responsibility, Kuwait Investment Authority, viewed 8 August 2016, <http://www.kia.gov.kw/en/ABOUTKIA/Pages/Overview.aspx>.
Klein, M.W., & Eric, S.R. (1994). The Real Exchange Rate and Foreign Direct Investment in the United States: Relative Wealth vs. Relative Wage Effects, Journal of International Economics, 36(3-4), 373-89.
Indexed at, Google Scholar, Cross Ref
Kockw (2016). Brief history of Kuwait oil company, History, viewed 7 August 2016, <https://www.kockw.com/sites/EN/Pages/Profile/History/KOC-History.aspx>
Kogut, B., & Chang, S.J. (1996). Platform Investments and Volatile Exchange Rates: Direct Investment in the U.S. by Japanese Electronic Companies, Review of Economics and Statistics, 78(2), 221-31.
Indexed at, Google Scholar, Cross Ref
Lankes, H.P., & Venables, A.J. (1996). Foreign Direct Investment in Economic Transition: The Changing Pattern of Investments, Economics of Transition, 4, 331-347.
Indexed at, Google Scholar, Cross Ref
Libor, K. (2001). Foreign direct investment financing of capital formation in Central and Eastern Europe, European Bank for Reconstruction and Development Working paper No. 67.
Microchip (2016) Quality and reliability, Microchip Technology, viewed 5 August 2016, <http://www.microchip.com/about-us/company-information/about>.
Mof (2016) Kuwait Ministry budget, Ministry of Finance, viewed 1 August 2016, <http://www.mof.gov.kw/MofBudget/PDF/Report2015_2014.pdf>.
Nunes, C.L., Oscategui, J., & Peschiera, J. (2006). Determinants of FDI in Latin America, Documento De Trabajo 252.
Paci (2015). Population Statistic, The Public Authority for Civil Information, viewed 1 August 2016, <https://www.paci.gov.kw/stat>.
Pifss (2016). the public institution for social security, State of Kuwait, viewed 8 August 2016, <https://www.pifss.gov.kw/upload/PIFSS_Guide_2014_English_1442.pdf>.
Ranjan, V., & Agrawal, G. (2001). FDI inflow determinants in BRIC countries: A panel data analysis, Canadian Center of Science and Education, 4, 255-263.
Indexed at, Google Scholar, Cross Ref
Resmini, L. (2000). The determinants of foreign direct investment into the CEECs: new evidence from sectoralpatterns, Economics of Transition, 8(3), 665- 689.
Indexed at, Google Scholar, Cross Ref
Saaed, A. (2007). Inflation and economic growth in Kuwait: 1985-2005 evidence from co-integration and error correction model, Applied Economic and International Development, 7, 1-13.
Sahoo, P. (2006). Foreign Direct Investment in South Asia: Policy, Trends, Impact and Determinants, ADB Institute Discussion paper No. 56.
Salamzadeh, A. (2020). What constitutes a theoretical contribution?. Journal of Organizational Culture, Communications and Conflict, 24(1), 1-2.
Indexed at, Google Scholar, Cross Ref
Salamzadeh, A., Arasti, Z., & Elyasi, G. M. (2017). Creation of ICT-based social start-ups in Iran: A multiple case study. Journal of Enterprising Culture, 25(01), 97-122.
Indexed at, Google Scholar, Cross Ref
Stevens, V.G. (1998). Exchange Rates and Foreign Direct Investment: A Note, Journal of Policy Modeling, 20(3), 393-401.
Indexed at, Google Scholar, Cross Ref
World Bank, (2016). URL: http://www.worldbank.org/
XU, B. (2000). Multinational enterprises, technology diffusion and host country productivity growth, Journal of Development Economics, 62, 477-493.
Indexed at, Google Scholar, Cross Ref
Received: 31-Oct-2022, Manuscript No. AAFSJ-22-12784; Editor assigned: 02-Nov-2022, PreQC No. AAFSJ-22-12784(PQ); Reviewed: 16-Nov-2022, QC No. AAFSJ-22-12784; Revised: 15-Dec-2022, Manuscript No. AAFSJ-22-12784(R); Published: 22-Dec-2022
