Research Article: 2023 Vol: 27 Issue: 2
Impact of Volatile FX Market on Indian Masala Bond Price during COVID 19
Sumit Kumar, Indian Institute of Management
Citation Information: Kumar, S. (2023). Impact of Volatile fx Market on indian masala bond price during Covid 19. Academy of Marketing Studies Journal, 27(2), 1-19.
Abstract
Masala bonds are financial obligations that are issued in countries other than India and are denominated in Indian Rupees (INR). Due to the fact that these bonds were issued somewhere other than India, the payment for them is made in US dollars (USD). It is a superb funding product that is equally liked by borrowers and investors. This is due to the structure of the instrument, as well as its price and return profile. The pandemic had the same effect on both nations since these bonds are vulnerable to fluctuations in the FX (Foreign Exchange) rate, and during COVID 19 the FX rate, particularly the USD/INR exchange rate, was extremely unstable. Our assessment is predicated on the daily snapshot of one year's worth of data, which spans from the 24th of December 2020 to the 24th of December 2021. This study examines the influence of currency exchange rates on the price profile of Masala bonds. We took a look at some examples of the Masala bonds that are traded on "The London Stock Exchange." They conducted an in-depth investigation on their structure as well as their properties. We chose one of the Masala bonds from the sample (HDFC) and analyzed the influence that movement in the foreign exchange rate had on the price of the local risk-free government bond. According to our results, a change of one percent in the price of the Masala Bond would be caused by a change of two basis points in the FX movement. This conclusion is consistent with the assumptions. We also discovered that there is a one percent change in the cost of the Masala Bond if there is a 27 basis point change in the price of the onshore risk-free bond.
Keywords
Masala Bond, Green Masala Bond, FX, Off Sore funding, Green Financing, COVID 19
Introduction
The Offshore Local Currency-Denominated Bond Market in The Emerging Market Economy (Eme)
Emerging markets' offshore issuances of local currency-denominated bonds have increased dramatically in the past few years. In the post-crisis period, when investment possibilities were scarce and global cash was plentiful, private investors were particularly drawn to these. Emerging market economies (EMEs) that escaped the global financial crisis largely undamaged provided compelling alternatives to mature countries whose public finances and other fundamentals worsened dramatically. Based on improved metrics such as low debt levels, ample forex reserves, robust anti-inflation measures, and a commitment to structural reforms, investors aiming to diversify and earn better yields viewed sovereign risk in these EMEs favorably. Local-currency sovereign bonds emerged as a separate asset class because of these countries' relative macroeconomic stability McCauley & Jiang (2004). Foreign-currency debt is not fundamentally reliant on emerging economies. Alternatively, they can create local currency bond markets, decrease currency anomalies, and reduce the risk of future crises by improving policy performance and strengthening institutions Tovar (2005). Issuing local currency securities, both onshore or offshore appeals to EMEs. The benefits include reducing FX exposure, and protecting balance sheets from currency mismatches, mainly where earnings are denominated in local currency.
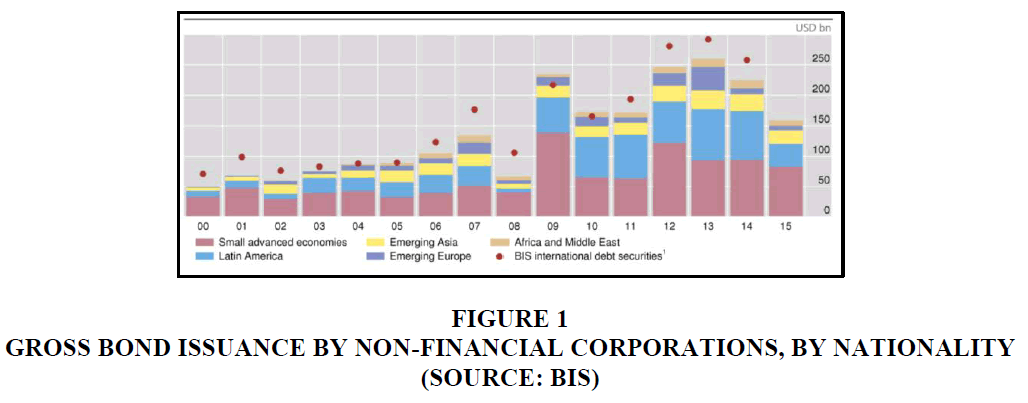
Furthermore, Dong & McCauley ( 2010) concluded that local currency fixed income funding instrument provides an additional way for putting foreign resources into long-term infrastructure projects in a country like the United States, where funding is often scarce and expensive. China has taken a giant leap forward by building an offshore local currency bond market which has further fueled its economic growth in a well-directed area and purpose. Hung & Yau (2012) noted that in the case of China, offshore markets allow the RMB to trade freely, paving the way for the RMB to become completely convertible and allowing market forces to play a part in determining the RMB's value, as well as aiding the development of Hong Kong's RMB-denominated bond (Dim Sum bond) market. Many EMEs (Emerging Market Economy) like Brazil, Chile, Russia, Uruguay, Peru, and India have offered local currency-denominated financing issuance for foreign institutional investors and investment firms. In a fascinating study by Serena & Moreno (2016), they discovered that EME enterprises were compelled to raise capital outside of their home markets due to a lack of financing options in their home markets. We also show that corporations use the proceeds from offshore bonds to expand their short-term asset holdings. For example, this could jeopardize financial stability by increasing the procyclicality of financing in the domestic financial sector. BIS has provided the following graph depicting the geographic distribution of firms active in the offshore bond market Figure 1.
The Masala Bond Program
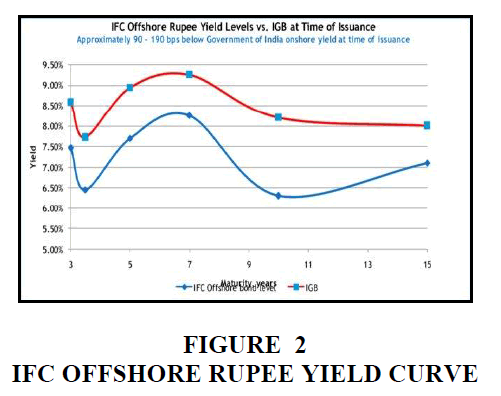
Due to capital flight sparked by a large current account deficit and the US Federal Reserve's reduction of quantitative easing, the Indian rupee hit a record low versus the US dollar in 2013. As a result, the IFC and the Indian government explored methods to fuel the growth of rupee capital markets both onshore and offshore. They resolved that IFC will establish rupee bond programs in both onshore and offshore markets to offer rupee financing for IFC projects in India and help Indian markets flourish by developing a AAA yield curve (IFC, 2017). Through maturities ranging from 3 to 15 years, IFC's issuances generated the first "AAA" offshore rupee yield curve. Even though they aided in the initial establishment, the curve is limited to the sub-government level. The masala bond market now lacks a significant, consistent supply of paper at various tenors, particularly at the long end, to allow the yield curve to form. Because of low demand and lack of knowledge with the product and quantitative constraints and eligibility restrictions, private company issues are in short supply. Below is the depiction of the IFC Offshore Rupee Yield curve vs. IGB at the Time of Issuance.
Masala Bonds
Are debt securities denominated in Indian Rupees (INR) issued outside of India. These bonds are paid in US dollars since they were given outside of India (USD). Masala bonds have a unique characteristic. Bond investors bear the Rupee currency risk rather than bond issuers, as would be the case if an Indian bank or corporation issued in a foreign currency. This implies that if the INR depreciates/appreciates against the USD over the bond's tenure, a masala bond investor's return will be lower/higher than the stated yield. Masala bonds are often issued by Indian companies seeking to obtain capital in the international market. HDFC Ltd, NTPC Ltd, and India bulls Housing Finance are the current top masala bond issuers. Masala bonds appeal to bond issuers because they allow companies to tap into overseas investor demand while avoiding foreign currency risk. Below is Indian Currency (INR) yield curve Figure 2.
The first offshore bond program of $1 billion was launched in October 2013. From 2013 to 2014, IFC issued seven tranches of offshore rupee-denominated bonds. Though these bonds were settled in dollars offshore, the exchange rate determines the dollar return. The program was subsequently extended to a second phase with longer maturities and was backed by solid liquidity in the financial markets. These are called the "Masala Bond" Program.
In Phase I of the program, which ran from November 2013 to April 2014, IFC issued four tranches of 3-year bonds, one tranche of 5-year bonds, and one tranche of 7-year bonds for a total of Rs 62 billion, or $1 billion equivalent. Through a $2 billion offshore rupee program, IFC issued Rs 10 billion in 10-year bonds in November 2014 and Rs 2 billion in 15-year notes in Phase II in March 2016. The 15-year tranche was the longest-term bond ever issued in the offshore rupee market at the time. The first Green Masala bond (with proceeds targeted for specific climatic or environmental sustainability aims) was also issued by IFC. The proceeds were invested in a YES Bank green bond. IFC issued a Rs 300 million Masala Uridashi bond in March 2016. All of the issuances drew a wide range of investors. Global investors showed strong interest in the 3, 5, and 7-year maturity issuances, all oversubscribed. Masala bonds issued by the IFC had yields that were 100 to 190 basis points lower than Indian government bonds for the same maturities. Another sub-group of Masala bond is called "Green Masala Bonds" to fund the sustainable and environment-friendly development and infrastructure project. Green Masala Bonds are created to help bridge the gap in climate finance by mobilizing overseas financing through INR denominated fixed income securities. India has committed to reducing greenhouse gas emissions by 33 to 35 percent from 2005 levels by 2030, as well as creating an additional reduction of 2.5 to 3 billion tons of CO2 through green cover, and to achieving a cumulative electric power capacity of 40% from an alternative source of energy by 2030.
Masala Bond Program Benefits: In general, the Masala Bond Program was successful in various ways. It had a demonstrative effect, prompting other issuances and establishing an offshore rupee bond market. It also looked at overseas markets to see whether the rupee could be internationalized. The absence of currency risk with such issuances provides Indian firms with more access to a broad global investor base searching for high-quality, rupee-denominated assets, allowing for a more significant potential program size to be implemented in offshore markets. Furthermore, dollar-settled rupee bonds enable international investors to profit from India's strong economic fundamentals while avoiding the time-consuming onshore investment route hampered by foreign portfolio investment quotas, complex registration procedures, and currency convertibility issues.
Key Impacts: IFC succeeded in defining a price standard for the offshore rupee market by pioneering the Masala bond and selectively releasing 3, 5, 7, 10, and 15-year bonds. This made it possible for prospective Indian corporate issuers to diversify their financing sources while avoiding currency rate risk.
Objective & Motivation of the Study
Since Masala Bonds is an INR denominated fixed income instrument for external commercial borrowing, it is pegged to INR. Therefore, domestically, it has no FX exposure, but it carries an FX risk for foreign investors. We wanted to understand this relationship of offshore Masala Bond concerning the FX movement, especially in the COVID time when the economy is going through a stressed business cycle. We were interested in learning more about the link between offshore Masala Bonds and the FX rate movement, particularly during the COCID period, when the economy is through a stressful economic cycle. There is considerable research available that explains the pandemic as a shock to the economy. One of the investigations Wang & Park (2021) demonstrates adverse mean knock-on effects from the pandemic's propagation to the US and South Korean stock markets. Another finding Ali et al. (2020) suggests that China's initial center, the spread, has steadied.
In contrast, global markets have gone into freefall, particularly in the later spread phase. According to one analysis Czech et al. (2020), the substantial depreciation of the Czech koruna (CZK), the Hungarian forint (HUF), and the Polish zloty (PLN) has a more significant possibility than their huge appreciation because of COVID-19. Another intriguing study Ashraf (2020) reveals that the negative market response was most during the early days of verified cases and then between 40 and 60 days after that. Our findings imply that stock markets react swiftly to the COVID-19 pandemic and that this reaction changes over time depending on the stage of the epidemic. According to one study Topcu & Gulal (2020), COVID-19 has the most significant influence on the economy and business cycle in Asian economies and the least in European developing markets. COVID-19 has a detrimental impact on stock markets in afflicted nations, with bidirectional spillover effects across Asian, European, and American countries, as per a study (Liu, Wang, and Yu,2020). Following the onset of the worldwide spread of coronavirus pandemic 2019, the markets rapidly plummeted, according to one fascinating research (Mishra and Mishra,2020) done in the period of COVID-19. As a result, we study the behavior of a few Asian stock markets in the face of the corona pandemic's significant uncertainty and look for instances of volatility clustering in these markets.
Offshore Funding Challenges in COVID-19
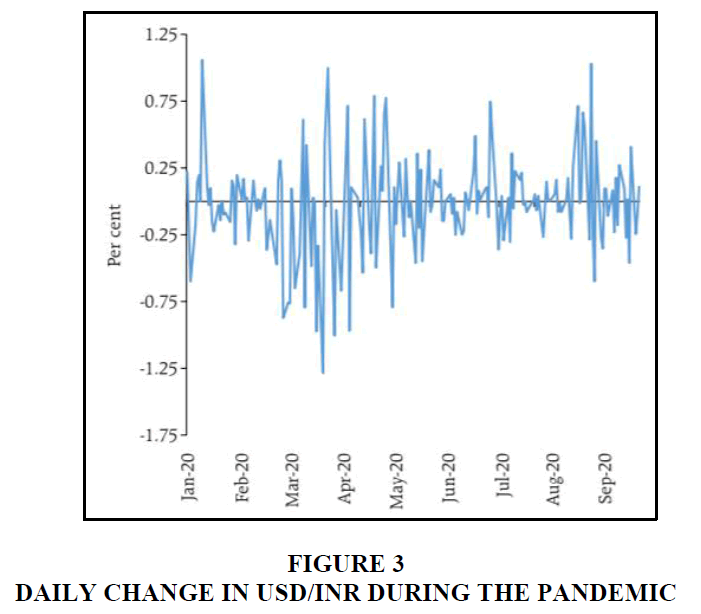
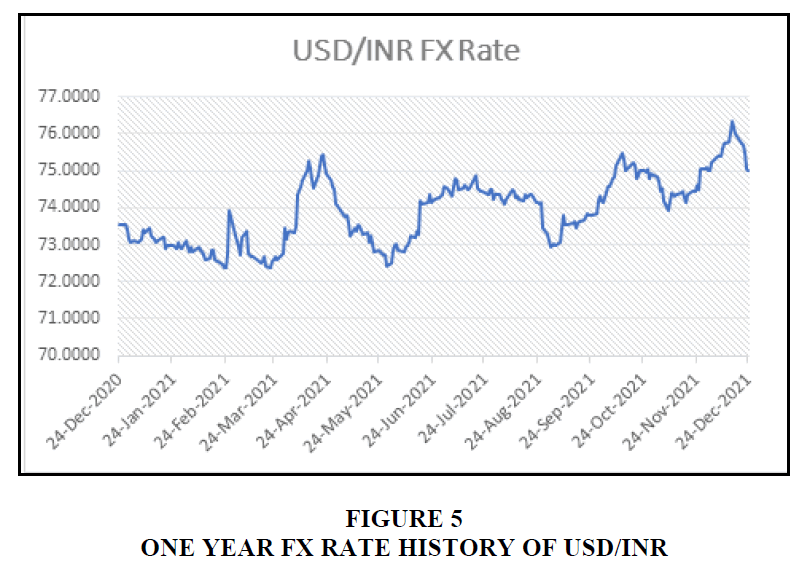
Preliminary evidence suggests that only a portion of the sharp increase in observed dollar funding costs can be attributed to the standard supply- and demand-side factors analyzed in the October 2019 Global Financial Stability Report (GFSR), including the dollar funding fragility of non-US global banks, according to an IMF study Barajas et al. (2020). During the Covid-19 crisis, non-US banks were disproportionately damaged by massive withdrawals from prime MMFs and the subsequent stress in unsecured lending markets. These banks are among the most prolific issuers of unsecured short-term paper (e.g., three-month CP and CDs) in the US money markets, owing to their lack of a consistent dollar retail deposit base. During the Great Financial Crisis (GFC), MMFs were the principal dollar lenders to non-US banks Baba et al. (2009), Aldasoro et al. (2019). There is considerable evidence of challenges and constraints in raising funding from offshore markets in domestic currency. Masala Bonds are fixed-income funding instruments that can raise funds from foreign investors in INR denominated bonds. While for Indian issuers, there is no FX risk as it is denominated in INR, foreign investors carry the FX risk. For example, a USD investor would take a USD/INR FX risk if he invests in the Masala Bond program. Following the outbreak of COVID-19, the exceptional governmental response, and the heightened global uncertainty, large swings in the prices of numerous asset classes such as currency, bond, shares, and credit were seen. Large risk-off outflows began in March 2020, putting colossal devaluation pressure on emerging market currencies, notably the Indian Rupee (INR), with the most significant sell-off in equities markets since the GFC and record lows in long-term bond rates in many advanced nations (OECD, June 2020). Global growth has been continuously revised down by the International Monetary Fund (IMF). We have witnessed the USD/INR Volatile movement Figure 3 also during this pandemic He et al. (2020).
Therefore, it is essential to understand the challenges a "Masala Bond" investor would have gone through during this pandemic period, and this is the motivation of the present research here He & McCauley (2012) Su & Tokmakcioglu (2021).
Data and Analysis
Masala bonds are listed in global exchanges. Since the initial Masala bond listing in LSE (London Stock Exchange) in 2007, the London Stock Exchange has become the world's largest Masala bond center (LSE Group, 2018). Below is the list of selected Rupee Bonds on the London Stock Exchange.
In Our analysis, we have selected the following Masala bonds. Criteria of selection are broadly based on the bond's liquidity (Average Minimum bid/ask to spread over the last one year of the trading period) and other analytical data availability Table 1-9.
| Table 1 General Bond Parameters of Our Sample Masala Bond | ||||||||
| S. No | Issuer | Price Bid | Price Ask | Yield Bid | Yield Ask | Current Coupon | Maturity Date (DD/MM/YYYY) | Currency |
| 1 | Kerala Infrastructure Investment Fund Board | 111.299 | 111.173 | 4.40% | 4.46% | 9.72% | 29/03/2024 | INR |
| 2 | HDFC Bank Ltd | 104.159 | 103.358 | 6.61% | 6.89% | 8.10% | 22/03/2025 | INR |
| 3 | National Highways Authority Of India | 100.79 | 100.75 | 5.01% | 5.11% | 7.30% | 18/05/2022 | INR |
| 4 | India, Republic Of (Government) | 103.1 | 103.7 | 6.10% | 6.11% | 6.79% | 15/05/2027 | INR |
| 5 | Indian Renew Energy Dev | 101.091 | 100.713 | 5.59% | 6.08% | 7.13% | 10/10/2022 | INR |
| 6 | NTPC Ltd | 100.7 | 100.647 | 4.96% | 5.11% | 7.25% | 3/5/2022 | INR |
| 7 | International Finance Corp | 105.352 | 105.138 | 6.32% | 6.35% | 7.10% | 21/03/2031 | INR |
| Table 2 Descriptive Statistics of Price & Yield of the Sample | |||||||
| Price Bid | Price Ask | Yield Bid | Yield Ask | ||||
| Mean | 103.784 | Mean | 103.640 | Mean | 0.056 | Mean | 0.057 |
| Standard Error | 1.425 | Standard Error | 1.422 | Standard Error | 0.003 | Standard Error | 0.003 |
| Median | 103.100 | Median | 103.358 | Median | 0.056 | Median | 0.061 |
| Standard Deviation | 3.770 | Standard Deviation | 3.763 | Standard Deviation | 0.008 | Standard Deviation | 0.009 |
| Sample Variance | 14.212 | Sample Variance | 14.158 | Sample Variance | 0.000 | Sample Variance | 0.000 |
| Kurtosis | 2.499 | Kurtosis | 2.629 | Kurtosis | -1.501 | Kurtosis | -1.114 |
| Skewness | 1.534 | Skewness | 1.554 | Skewness | -0.133 | Skewness | -0.235 |
| Range | 10.599 | Range | 10.526 | Range | 0.022 | Range | 0.024 |
| Minimum | 100.700 | Minimum | 100.647 | Minimum | 0.044 | Minimum | 0.045 |
| Maximum | 111.299 | Maximum | 111.173 | Maximum | 0.066 | Maximum | 0.069 |
| Sum | 726.491 | Sum | 725.479 | Sum | 0.390 | Sum | 0.401 |
| Count | 7.000 | Count | 7.000 | Count | 7.000 | Count | 7.000 |
| Table 3 Coupon Profile of our Sample Masala Bond | |||||||
| S. No | Issuer | Seniority | Coupon Type | Country | Callable | Perpetual | YTM |
| 1 | Kerala Infrastructure Investment Fund Board | Senior Secured - First Lien | Fixed | India | No | No | 4.43% |
| 2 | HDFC Bank Ltd | Senior Unsecured | Fixed | India | No | No | 6.75% |
| 3 | National Highways Authority Of India | Senior Unsecured | Fixed | India | No | No | 5.06% |
| 4 | India, Republic Of (Government) | Senior Unsecured | Fixed | India | No | No | 6.11% |
| 5 | Indian Renew Energy Dev | Senior Unsecured | Fixed | India | No | No | 5.83% |
| 6 | NTPC Ltd | Senior Unsecured | Fixed | India | No | No | 5.04% |
| 7 | International Finance Corp | Senior Unsecured | Fixed | India | No | No | 6.34% |
| Table 4 Descriptive Statistics of YTM | |
| YTM | |
| Mean | 0.056514286 |
| Standard Error | 0.00313911 |
| Median | 0.0583 |
| Standard Deviation | 0.008305305 |
| Sample Variance | 6.89781E-05 |
| Kurtosis | -1.266491593 |
| Skewness | -0.204979069 |
| Range | 0.0232 |
| Minimum | 0.0443 |
| Maximum | 0.0675 |
| Sum | 0.3956 |
| Count | 7 |
| Table 5 Z-Spread and Maturity Profile of our Sample Masala Bond | |||||
| S. No | Issuer | Z Spread (Bps) | Maturity (Yrs) | Next Coupon | Accrued Interest |
| 1 | Kerala Infrastructure Investment Fund Board | 2 | 9/29/2021 | 2.38 | |
| 2 | HDFC Bank Ltd | 124 | 2.64 | 3/22/2022 | 6.21 |
| 3 | National Highways Authority Of India | 28.5 | 0.37 | 18/05/2022 | 4.46 |
| 4 | India, Republic Of (Government) | 30.4 | 4.44 | 15/05/2022 | 0.79 |
| 5 | Indian Renew Energy Dev | 61.6 | 0.74 | 10/10/2022 | 1.54 |
| 6 | NTPC Ltd | 39.1 | 0.33 | 3/5/2022 | 4.73 |
| 7 | International Finance Corp | 16.5 | 6.66 | 21/03/2022 | 1.91 |
| Table 6 Descriptive Statistics of Z-Spread and Maturity Profile | |||||
| Z Spread (Bps) | Maturity (Yrs) | Accrued Interest | |||
| Mean | 50.01666667 | Mean | 2.4542857 | Mean | 3.1471429 |
| Standard Error | 16.01876851 | Standard Error | 0.8953261 | Standard Error | 0.7536459 |
| Median | 34.75 | Median | 2 | Median | 2.377 |
| Standard Deviation | 39.23780915 | Standard Deviation | 2.3688102 | Standard Deviation | 1.9939597 |
| Sample Variance | 1539.605667 | Sample Variance | 5.6112619 | Sample Variance | 3.9758751 |
| Kurtosis | 3.086583772 | Kurtosis | 0.1776975 | Kurtosis | -1.3451227 |
| Skewness | 1.738308134 | Skewness | 1.0261367 | Skewness | 0.4553015 |
| Range | 107.5 | Range | 6.33 | Range | 5.418 |
| Minimum | 16.5 | Minimum | 0.33 | Minimum | 0.792 |
| Maximum | 124 | Maximum | 6.66 | Maximum | 6.21 |
| Sum | 300.1 | Sum | 17.18 | Sum | 22.03 |
| Count | 6 | Count | 7 | Count | 7 |
| Table 7 Issuance Profile of Our Sample Masala Bond | ||||||
| S. No | Issuer | Amount Issued (MM INR) | Amount Outstanding (MM INR) | Issue Date (DD/MM/YYYY) | Issue Price | Redemption Value |
| 1 | Kerala Infrastructure Investment Fund Board | 21,500.00 | 21,500.00 | 29/03/2019 | 100.00 | 100.00 |
| 2 | HDFC Bank Ltd | 23,000.00 | 23,000.00 | 22/03/2018 | 100.00 | 100.00 |
| 3 | National Highways Authority of India | 30,000.00 | 30,000.00 | 18/05/2017 | 100.00 | 100.00 |
| 4 | India, Republic Of (Government) | 1,210,000.00 | 1,210,000.00 | 15/05/2017 | 100.00 | 100.00 |
| 5 | Indian Renew Energy Dev | 19,500.00 | 19,500.00 | 10/10/2017 | 99.57 | 100.00 |
| 6 | NTPC Ltd | 20,000.00 | 19,080.00 | 3/5/2017 | 99.88 | 100.00 |
| 7 | International Finance Corp | 2,000.00 | 2,000.00 | 21/03/2016 | 100.00 | 100.00 |
| Table 8 Descriptive Statistics of Amount Issued in the Sample Masala Bonds | |
| Amount Issued (MM INR) | |
| Mean | 189428.5714 |
| Standard Error | 170125.5289 |
| Median | 21500 |
| Standard Deviation | 450109.8411 |
| Sample Variance | 2.02599E+11 |
| Kurtosis | 6.992056963 |
| Skewness | 2.643763132 |
| Range | 1208000 |
| Minimum | 2000 |
| Maximum | 1210000 |
| Sum | 1326000 |
| Count | 7 |
| Table 9 Static Data of Our Sample Masala Bond | |||||
| S. No | Issuer | Coupon Frequency | Day Count | Min. Denomination | Industry Type |
| 1 | Kerala Infrastructure Investment Fund Board | 2.00 | ISMA-30/360 | 10,000,000.00 | Government Regional |
| 2 | HDFC Bank Ltd | 1.00 | ISMA-30/360 | 10,000,000.00 | Bank |
| 3 | National Highways Authority of India | 1.00 | ISMA-30/360 | 10,000,000.00 | Government Agencies |
| 4 | India, Republic Of (Government) | 2.00 | ISMA-30/360 | 10,000.00 | Sovereigns |
| 5 | Indian Renew Energy Dev | 1.00 | ISMA-30/360 | 10,000,000.00 | Renewable Energy |
| 6 | NTPC Ltd | 1.00 | ISMA-30/360 | 10,000,000.00 | Power Generation |
| 7 | International Finance Corp | 30/360 | 10,000.00 | Supranational | |
Methodology
Impact of FX rate on the price of the Masala Bond
Though Masala Bonds had to face the foreign currency rate risk, foreign investors' worries about exchange rate stability were relieved by India's strong economic fundamentals, which had averaged 7.8% annual growth over the previous decade. Furthermore, both foreign and local investors have raised their expectations for Indian economic development in the run-up to the April 2014 general election. Between late 2013 and early 2014, this helped recover and strengthen foreign investor enthusiasm for the early tranches of Masala bonds. Taking advantage of that window of opportunity, the IFC issued Masala bonds, which attracted a lot of interest from international investors despite the acute capital outflows caused by the rupee devaluation at the time Fung & Yau (2012).
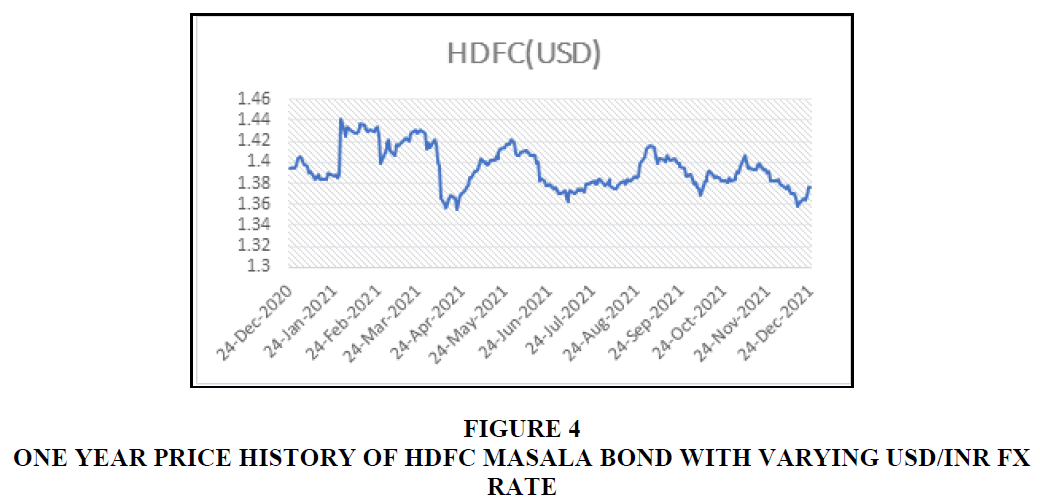
While the economy of India is strong, the pandemic situation due to the COVID-19 situation has created an exogenic economic shock, resulting in a volatile INR/USD FX rate. In such a situation, we snapped the price of our sample Masala Bonds with an FX rate Figure 4 and 5.
The risks of interest rate fluctuations (for Fixed Coupon Bonds), credit risk (for Corporations and Non-Sovereigns), foreign exchange risk (for Bond-like, Masala Bonds issued in home currency for the offshore lender), and liquidity risk are all common market risks that should be considered when deciding to take a long position in a bond (Some of the maturities are liquid than others).This is consistent with the findings published by IFC (IFC, 2017) in their publication. So, to model a pricing equation for the Masala Bond, they are the function of the above variables.
MP (Price of Masala Bond) = MP (IR, FX, CR, LF )
Where IR = Interest Rate Risk factor
FX = Foreign Exchange Risk Factor
CR = Credit Risk Factor
LF = Liquidity Factor (Which also considers, the maturity factor)
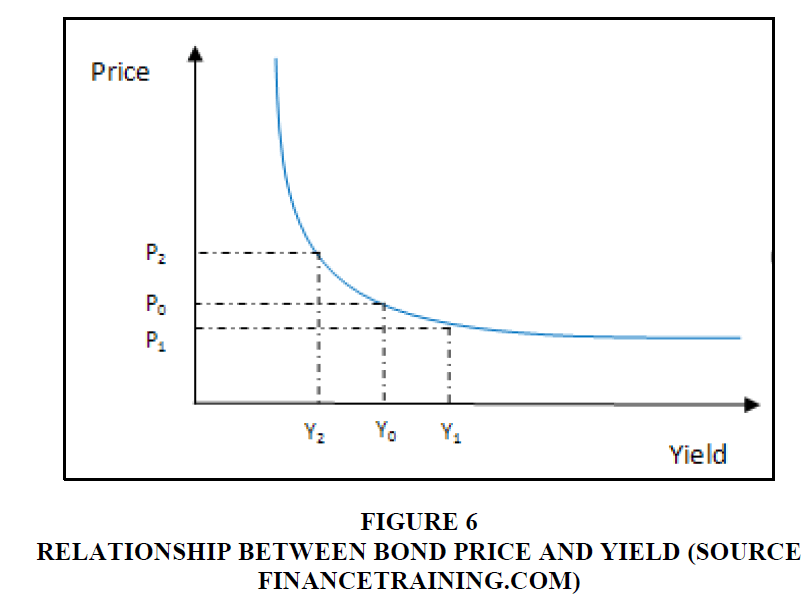
We intend to find the impact of the FX rate movement (USD/ INR) on the price of Masala Bonds. As noted above, the Pricing and Interest rate are related, but this relation is non-linear. Bond price and interest rate have a convex relationship (Choudhary, 2001). As shown in Figure 3, we decided to use a Risk-free sovereign bond price, a Govt. of India Treasury bond as a proxy to include an interest rate factor linearly into the model. Therefore, we would like to proxy Interest rate IR to Govt. of India bond GOI Figure 6.
In the above figure, P0, P1, and P2 are the bond prices at yields Y0, Y1, and Y2.
We would therefore like to propose a model where Masala Bond Price is linearly related to the factors like GOI (Govt. of India Treasury Bond Price), FX rates (USD/INR Rate), and Credit Risk (CR) along with Liquidity factor (LF).
So our proposed model for Masala Bond Price is:

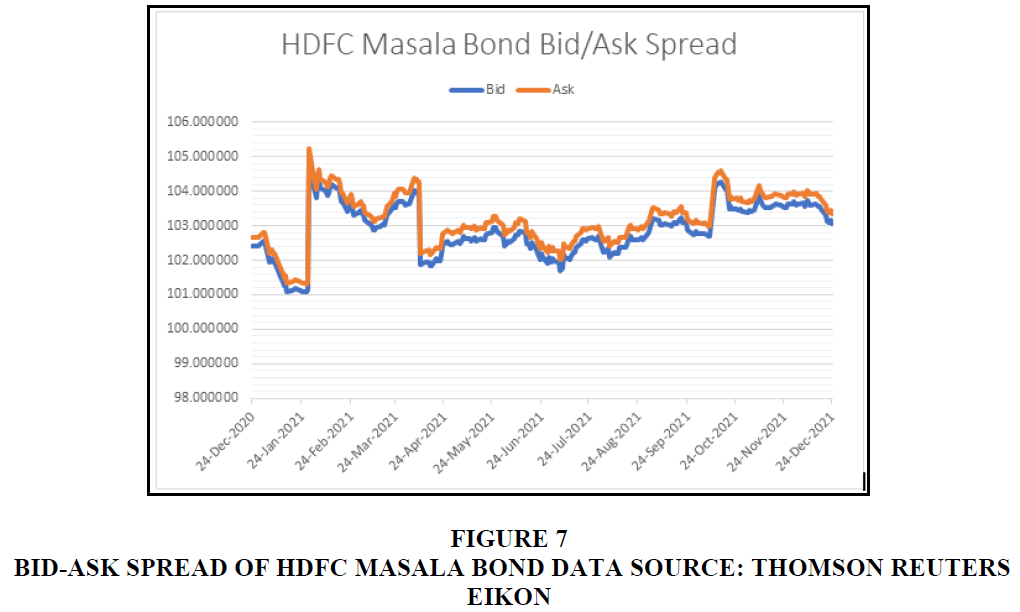
Liquidity Impact: We wanted to understand if liquidity is a significant factor in the model (Equation 1). There is research (Su and Tokmakcioglu, 2021) that explains it. The bid-ask spread refers to the price differential that occurs between the highest price a buyer is prepared to pay for an item and the lowest price a seller is willing to accept for that item. This is a measure of the market's availability of bonds as an investment. We have included bonds in this model in which the difference between the bid and the ask price is relatively narrow. The HDFC Masala Bond, which has a yearly average bid-ask spread of 25 basis points, is going to be the instrument that we make use of in the process of calibrating the model. Figure 4 shows how tight is the bid-ask spread of HDFC bond throughout the last year Figure 7 He et al. (2012).
Since the bid-ask spread is very tight, we can say that the liquidity impact on the Masala bond pricing will be minimal. Therefore, we can drop the liquidity factor from the model, and then the model (Equation 1) is reduced to:

Credit Risk (CR) Impact: The credit risk of a bond is the bond issuers' ability to honor the contract (Coupon and Principals and other contract details). This has been explained in several existing kinds of literature Malone & Choi (2020) in finance and economics Table 10.
| Table 10 Credit Rating of GOI Bond and HDFC Masala Bonds (Data Source: Thomson Reuters) | ||||
| Credit Rating of GOI Bond | Credit Rating of HDFC Masala Bond | |||
| Ratings | Foreign | Domestic | Foreign | Domestic |
| Fitch | BBB- 16-Nov-2021 (A) | BBB- 16-Nov-2021 (A) | NA | NA |
| Moody's | Baa3 05-Oct-2021 (A) | Baa3 05-Oct-2021 (A) | NA | NA |
| S&P | BBB- 30-Jan-2007 (R) | BBB- 30-Jan-2007 (R) | BBB- 16-Jan-2008 (R) | BBB- 16-Jan-2008 (R) |
We have used the Thomson Reuters database to pull the credit rating of the bonds. Unfortunately, we didn't find a credit rating from Fitch and Moody. So, taking the S&P rating as a baseline, we notice that both GOI (Govt. of India Bond) and HDFC Masala Bond's credit ratings are relatively consistent. We assume that GOI bonds are backed by a sovereign guarantee and share the same credit rating with HDFC bank, both domestic and in a foreign market; we can argue that credit risk factor may not be an influencing factor and therefore can be dropped (Suggested as future work) BondEvalue (2019).
So after dropping the CR as a factor from the model, our original model takes the form of

We will be using this model to find the causal relationship between the price of the Masala bond and its underlying factors, which are the price of the risk-free bond (GOI) and the FX rate (USD/INR) rate. Therefore, our regression model will be :

Where ε represents the error term in a regression model.
We will be using the data that we have snapped earlier.
MP (Price of the Masala Bond) = HDFC (USD) is the dependent variable, the price of HDFC
Masala Bond in USD.
GOI = GOI (USD) is the price of Govt. of India Treasury of closest maturity to HDFC Masala
Bond (5Y Maturity)
 is the USD/INR FX Mid-rate ( Mid= average of Bid and Ask)
Data has been retrieved from the Thomson Reuters Eikon database for one full year, from 25th December 2020 to 25th December 2021.
Results
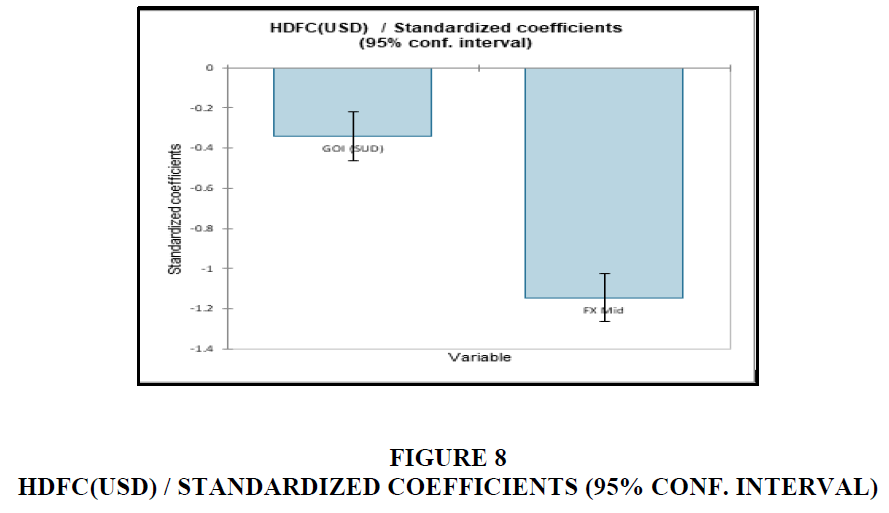
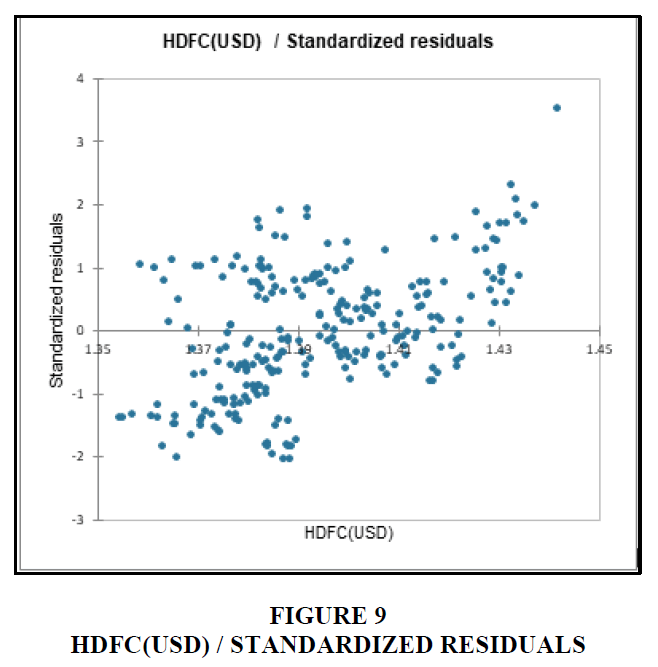
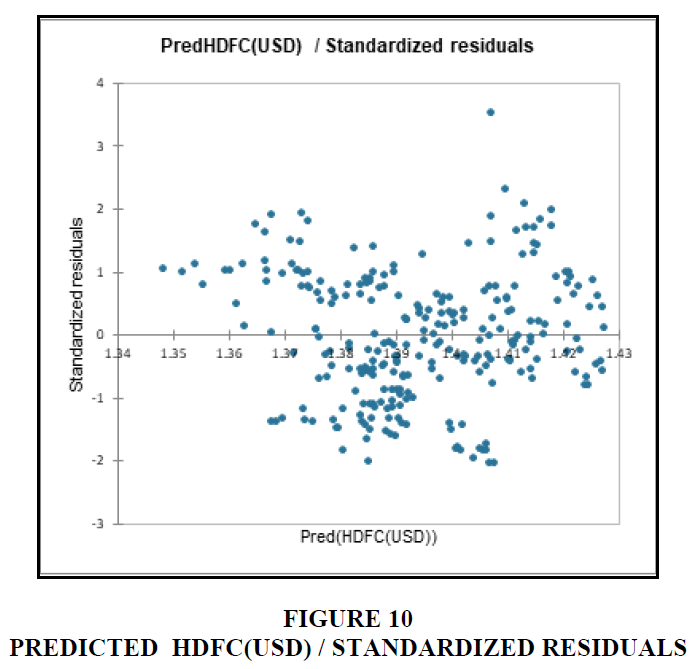
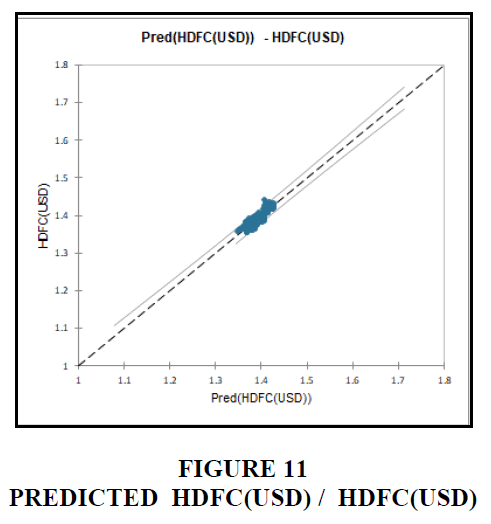
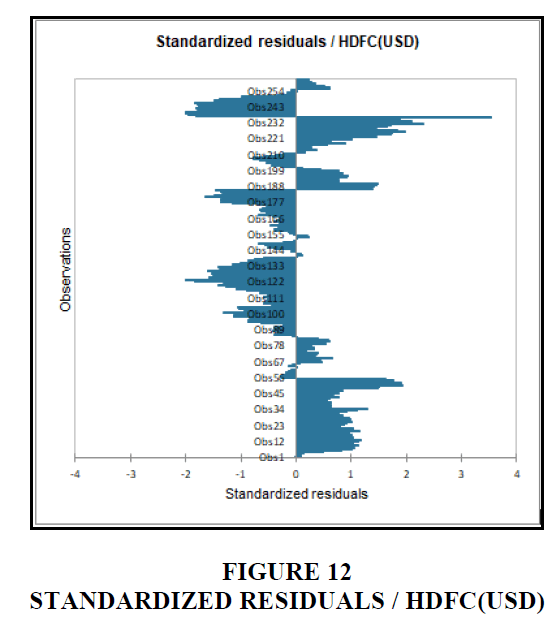
We did a simple linear regression analysis, and the following are the set of results. We have 1 Year of the observed daily price of HDFC Masala Bond Price, GOI (Govt. of India) bond price, and FX Mid of USD/INR. Also, the Prices of both the bonds are expressed in USD Table 11-16 and Figures 8 - 12.
| Table 11 Summary Statistics of Data (1year Daily Time Series of Masala Bonds, GOI, and FX Mid of USD/INR) | |||||||
| Variable | Observations | Obs. with missing data | Obs. without missing data | Minimum | Maximum | Mean | Std. deviation |
| HDFC(USD) | 262 | 0 | 262 | 1.354 | 1.442 | 1.394 | 0.020 |
| GOI (USD) | 262 | 0 | 262 | 1.359 | 1.465 | 1.407 | 0.023 |
| FX Mid | 262 | 0 | 262 | 72.380 | 76.355 | 73.909 | 0.915 |
| Table 12 Correlation Matrix | |||
| GOI (SUD) | FX Mid | HDFC(USD) | |
| GOI (USD) | 1 | -0.863 | 0.648 |
| FX Mid | -0.863 | 1 | -0.852 |
| HDFC(USD) | 0.648 | -0.852 | 1 |
| Table 13 The Goodness of Fit Statistics HDFC (USD) | |
| Observations | 262 |
| Sum of weights | 262 |
| DF | 259 |
| R² | 0.755 |
| Adjusted R² | 0.753 |
| MSE | 0.000 |
| RMSE | 0.010 |
| MAPE | 0.571 |
| DW | 0.217 |
| Cp | 3.000 |
| AIC | -2424.827 |
| SBC | -2414.122 |
| PC | 0.251 |
| Table 14 Analysis of Variance HDFC (USD) | |||||
| Source | DF | Sum of squares | Mean squares | F | Pr > F |
| Model | 2 | 0.075 | 0.038 | 399.009 | <0.0001 |
| Error | 259 | 0.024 | 0.000 | ||
| Corrected Total | 261 | 0.100 | |||
| Table 15 Model Parameter for HDFC (USD) | ||||||
| Source | Value | Standard error | t | Pr > |t| | Lower bound (95%) | Upper bound (95%) |
| Intercept | 3.606 | 0.162 | 22.230 | <0.0001 | 3.287 | 3.926 |
| GOI (SUD) | -0.286 | 0.051 | -5.597 | <0.0001 | -0.386 | -0.185 |
| FX Mid | -0.024 | 0.001 | -18.822 | <0.0001 | -0.027 | -0.022 |
| Table 16 Standardized Coefficients HDFC (USD) | ||||||
| Source | Value | Standard error | t | Pr > |t| | Lower bound (95%) | Upper bound (95%) |
| GOI (SUD) | -0.341 | 0.061 | -5.597 | <0.0001 | -0.461 | -0.221 |
| FX Mid | -1.146 | 0.061 | -18.822 | <0.0001 | -1.265 | -1.026 |
Summary Statistics
Regression of Variable HDFC(USD)
Summary Statistics
Conclusion and Summary
It was anticipated that an increase in the FX rate would result in a decrease in the price of the Masala bond, and the opposite was predicted to be true. According to the findings of our investigation, a movement of the foreign exchange market by two basis points would result in a movement of the Masala Bond price by one percent. Given that we are aware that the Masala bond is issued in the offshore market but that it is denominated in INR, it follows that the return on investment for a masala bond investor will be lower/higher than the yield that is stated if the INR experiences a depreciation or an appreciation against the USD during the tenure of the bond. In the course of our investigation, we came to this conclusion. If the rupee falls in value relative to the dollar, then according to Kurihara's interest rate parity theory (1990), the interest rate on the rupee will rise. This will cause the price of onshore bonds to fall, while the price of offshore bonds, such as Masala Bonds, will rise because the price return on the Masala bond in the offshore market will provide a better return to foreign investors. Onshore bond prices will fall as a result. As a result, we anticipate a negative causal relationship between onshore and offshore bonds because the downward or upward movement of bond price due to the interest rate movement is somehow negated by the favorable FX rate movement for the foreign investors. This is why we expect a negative causal relationship between onshore and offshore bonds. According to our findings, there was a one percent change in price that was caused by 27 basis point fluctuations in the price of an onshore risk-free bond. As a result, offshore fundraising instruments such as Masala bonds might be a fruitful investment to hedge their bond portfolio against an unfavorable interest rate shock.
In order to encourage overseas investors to make investments, Masala Bond provides certain intriguing benefits. It provides a greater return on investment because to the higher interest rates it offers. It helps to increase the level of confidence that foreign investors have in the Indian economy. It does this by boosting the trust of international investors in the Indian rupee, which in turn helps the economy benefit from increased levels of foreign investment. Profits made in the financial sector that are attributable to the rupee denomination are exempt from taxation. The investor comes out ahead of the game if the INR appreciates in value before the maturity date.
The Masala bond not only provides attractive incentives for international investors, but it also presents domestic borrowers with a beneficial option for finance. The borrower comes out ahead since there is no danger of currency fluctuation. The borrower is shielded against fluctuations in the value of the currency. The fact that these bonds are issued in Indian currency as opposed to foreign money means that the borrowers would not be adversely affected by the devaluation of the rupee. A significant amount of money is made available to the borrower. The Indian corporation that is issuing these bonds is able to diversify its assets as a result of this. Since it is granted at a rate that is less than 7% and comes from a country other than India, it allows borrowers to save money. Due to the fact that these bonds are issued in an offshore market, debtors have the potential to access a bigger pool of investors. As can be seen, the return on investment offered by the Masala Bonds is advantageous for both onshore borrowers and offshore/foreign investors. This is the case with regard to the Masala Bonds.
Future Research
Recent events have contributed to the rise in popularity of the green form of the masala bond. The term for this product is "Green Masala Bonds." They are the many forms of financial instruments that the onshore borrower will employ in order to finance their green-certified project. Some examples of green initiatives include soliciting monetary contributions to finance the construction of environmentally friendly alternative energy plants such as solar power plants, as well as the construction of green structures Kurihara (2015).
Further research on “Green Masala Bonds”: Green Masala bonds are debt obligations issued by the International Finance Corporation (IFC) that make it possible to finance initiatives in poor countries while also mandating that these endeavors be ecologically responsible. These bonds come with an assurance that the underlying development will be environmentally responsible. This makes it possible for nations like India to achieve their climate goals by investing in renewable energy and energy efficiency and by putting into place adaption measures. In addition, IFC's local currency green bonds show that it is possible for foreign investors to participate in a market. This is a primary objective for both IFC and the Indian government as they work to encourage the sustained growth of local capital markets.
References
Aldasoro, I, T Ehlers and E Eren (2019): "Global banks, dollar funding, and regulation", BIS Working Papers, no 708.
Ali, M., Alam, N., & Rizvi, S. A.R. (2020). Coronavirus (COVID-19)—An epidemic or pandemic for financial markets. Journal of Behavioral and Experimental Finance, 27, 100341.
Ashraf, B.N. (2020). Stock markets’ reaction to COVID-19: Cases or fatalities?. Research in International Business and Finance, 54, 101249.
Indexed at, Google Scholar, Cross Ref
Baba, N., McCauley, R.N., & Ramaswamy, S. (2009). US dollar money market funds and non-US banks. BIS Quarterly Review, March.
Barajas, Adolfo; Deghi, Andreas; Fendoglu, Salih; Xu, Yizhi (2020), Strain in Offshore US Dollar Funding during COVID-19 Crisis: Some Observations, Global Financial Stability Note, IMF, pp 1-13.
BondEvalue (2019), Masala Bonds – Everything you need to know,
Czech, K., Wielechowski, M., Kotyza, P., Benešová, I., & Laputková, A. (2020). Shaking stability: COVID-19 impact on the Visegrad Group countries’ financial markets. Sustainability, 12(15), 6282.
Indexed at, Google Scholar, Cross Ref
Fung, H.G., & Yau, J. (2012). Chinese offshore RMB currency and bond markets: The role of Hong Kong. China & World Economy, 20(3), 107-122.
Indexed at, Google Scholar, Cross Ref
He, D., & McCauley, R.N. (2012). 10 Offshore Markets for the Domestic Currency: Monetary and Financial Stability Issues. The Evolving Role of China in the Global Economy, 301.
He, Q., Liu, J., Wang, S., & Yu, J. (2020). The impact of COVID-19 on stock markets. Economic and Political Studies, 8(3), 275-288.
Indexed at, Google Scholar, Cross Ref
Kurihara, Y. (2015). Interest Rate Parity Theory, Risk Premium, and Break Point: Japanese Case from The 1990s. Journal of Business & Economic Policy, 2(4), 169-174.
Malone S.W & Choi, Y (2020), Credit risk and bond spreads: Dynamic relationships and trading strategies, Moody's Analytics
McCauley, R.N., & Jiang, G. (2004). Diversifying with Asian local currency bonds.
Serena, J.M., & Moreno, R. (2016). Domestic financial markets and offshore bond financing. BIS Quarterly Review September.
Su, E., & Tokmakcioglu, K. (2021). A comparison of bid-ask spread proxies and determinants of bond bid-ask spread. Borsa Istanbul Review, 21(3), 227-238.
Indexed at, Google Scholar, Cross Ref
Topcu, M., & Gulal, O.S. (2020). The impact of COVID-19 on emerging stock markets. Finance Research Letters, 36, 101691.
Indexed at, Google Scholar, Cross Ref
Tovar, C.E. (2005). International government debt denominated in local currency: recent developments in Latin America. BIS Quarterly Review, December.
Wang, W., & Park, H. (2021). How vulnerable are financial markets to COVID-19? A comparative study of the US and South Korea. Sustainability, 13(10), 5587.
Received: 27-Oct-2022, Manuscript No. AMSJ-22-12750; Editor assigned: 03-Nov-2022, PreQC No. AMSJ-22-12750(PQ); Reviewed: 14-Nov-2022, QC No. AMSJ-22-12750; Revised: 27-Nov-2022, Manuscript No. AMSJ-22-12750(R); Published: 04-Jan-2023
