Research Article: 2021 Vol: 20 Issue: 1
Impact of Tick Size Reduction on the Market Liquidity Using Trading Friction
Immas Nurhayati, Universitas Ibn Khaldun
Titing Suharti, Universitas Ibn Khaldun
Rachmatullaily Tinakartika Rinda, Universitas Ibn Khaldun
Endri Endri, Universitas Mercu Buana
Abstract
This paper examine the influence of tick size reduction on the market liquidity using trading friction in Indonesian Stock Exchange an emerging order driven market. The empirical results show that variable in determining the difference in performance of IDX stocks following the tick size reduction is the price of the stock. Low priced stocks experience larger declines in trading friction than high priced stocks. Tick size reduction has a significant impact on the real friction (% TS1 and% TS2) compared to the total friction (% S &% ES). The difference test of the average change in proportional quoted half spread (%S) and proportional effective half spread (%ES) as the impact of tick size reduction can’t prove there is the influence of tick size reduction on market liquidity, because the parameter isn't significant. While the difference test of the average change in proportional first traded half spread (% TS1) and proportional second traded half spread (% TS2) can prove the effect of the tick size reduction to the decline in trading friction.
Keywords
Tick Size, Trading Friction, Proportional Half Spread, Liquidity.
Introduction
Liquidity is one of the important factors that are considered by traders in investing stocks through stock exchange. Liquidity is the main goal of almost all exchanges in the world, especially in providing convenience to convert stocks into the lowest cost cash. Liquidity means the ease of selling and buying securities at a fair price. The liquid stock market is the market there is always a bid and ask price for investors who will sell and buy stocks in a fast time, with a low bid-ask spread and can also be traded in small (large) stocks quickly (relatively longer) according to market prices (Endri, 2016). The study of liquidity in recent years has focused on asset pricing and market microstructure. In the context of the market microstructure, some researchers use the bid-ask spread as a proxy of liquidity and transaction costs as a proxy for asset pricing to determine the level of liquidity of an asset. Bid is the price at which traders are ready to buy and ask is the price when the market is ready to sell. The difference between the ask against the bid shows the spread, called the bid-ask spread. Bid-ask spreads on securities are determined by trading activities and securities prices. Demsetz (1968) says the bid-ask spread is a mark up paid for predictable exchanges in organizing markets. Bid ask spread is lack of liquidity. One of the causes of the lack of liquidity is the existence of friction in trade called bid ask spread (Amihud et al., 2006). Liquidity can be achieved by decreasing the tick size. Tick size is a unit of price change used in making a selling offer or buying offer (Nurhayati & Endri, 2020). A decrease in tick size has an impact on increasing liquidity and trading volume (Harris, 1994). Bessembinder (2000) shows that the reduction in tick size on Nasdaq will reduce bid-ask spreads and volatility.
The results of the research on the tick reduction policy of Rp. 5 in 2000 and Rp. 10 in 2005 gave the same conclusion, that the policy had an impact on reducing market spreads which meant the market became more liquid (Purwoto & Tandelilin, 2004; Ekaputra & Asikin, 2012). Research conducted by Setyawasih (2011) that investigated a new tick size of Rp. 1 on Desember, 2006 in Indonesian Stock Exchange was conducted using the cross sectional multiple regression from daily/intraday data can prove that the new tick size significantly enhance liquidity in term of market depth, but not to relative spread and depth-to-relative spread. The findings indicate that trading frequency significantly affect liquidity while stock price and volatility does not affect the relative spread (liquidity). Reduction of tick size in increasing liquidity is still inconclusive. For those who are pro-policy, they argue that the reduction in tick size will increase liquidity, but the contra states that reducing spreads will make traders use market orders instead of limit orders.
Hasbrouck & Schwartz (1988) examine the impact of market design on market The Indonesian Stock Exchange (IDX) uses a single absolute tick size (minimum price variation). The tick size implies that both quoted and trading prices to all traded stocks must be stated in terms of this basic unit. On July 3, 2000 the IDX reduced the tick size from Rp25.00 to Rp5.00. This change is implemented in order to create the fair, transparent and efficient trading and to increase the stock-market liquidity. Several researches which were conducted at the other exchanges showing that the lower tick price causing the increase of stock volume and the decrease of bid-offer spread. The trading system at the Indonesian Stock Exchange (IDX) is different from Nasdaq, American Stock Exchange and New York Stock Exchange. IDX is a fully order driven market without any designated market maker. At Nasdaq, American Stock Exchange and New York Stock Exchange, thera are market maker strategies that affect the tick size reduction. The precence of market maker is important because apart of can affect the tick size reduction they also can also affected the spread and other variables (Goldstein & Kavajecz, 2000). As order driven market IDX is a highly transparent market. Everybody can see the entire limit order book. There are no “hidden orders” that are invisible to traders. The purpose of this research is to examine the influence of tick-size reduction on the market liquidity using trading friction in Indonesian Stock Exchange as an emerging order driven market. The main objective of imposing a new tick size is to increase liquidity and market capitalization as well as to increase exchange competitiveness. This study focuses on analyzing the impact of changes in size tick on trading friction that can effects liquidity, which in this case is proxied by proportional quoted half spread, proportional effective half spread, proportional first traded half spread and proportional second traded half spread.
Literature Review
In a classic article on the theory of formation of securities prices-based information, Kyle (1985) defines liquidity based on three indicators (dimensions) including tightness, depth and resiliency. Tightness of the bid-ask spread is how much it costs to turn the position of the trader on the market in a short time, meaning how much the transaction costs for selling a security and then repurchasing the security or vice versa. Depth is a minimum order placement quantity that can cause price changes. Resiliency is how long the price returns to its original position after the shock. To enhance the market role as a facilitator and regulator, the Indonesia Stock Exchange (IDX) always strives to develop itself among others by paying attention to the high level of liquidity. One of the policies to increasing market liquidity is the policy of reducing tick size. Tick size is defined as a unit of price change used in making a selling offer or buying offer. A tick size is the minimum price movement of a trading instrument. The price movements of different trading instruments vary, with their tick sizes representing the minimum amount they can move up or down on an exchange. If the spread size is related to the tick size or price fraction, a relative spread will be obtained. In practice, the spread depends on the price fraction set by the exchange authority.As a result of this provision, in absolute terms, high-priced stocks tend to have larger spreads, but despite having larger spreads, high-priced stocks have smaller relative spreads than low-priced stocks (Stoll, 2000). Hypothesis 1 is established as follows.
H1 Low priced stocks experience larger declines in trading friction than high priced stocks.
Harris (1994) has cautioned that the economics of liquidity provision need to be considered carefully when evaluating the role of tick size. The rules of tick size potentially affects market makers’ and public investors’ willingness to supply liquidity in the form of binding quotations and limit orders. For example, in markets that enforce time priority, the cost of obtaining order precedence by improving on the existing quotation is reduced with a smaller tick size, which could adversely affect incentives to expose trading interest in the form of quotations or limit orders. The empirical results about the analysis of the influence of tick-size reduction and the relaxations of binding constraint probability on market liquidity in the Taiwanese Stock Market, an emerging order-driven market, starting on March 1, 2005 show that the spread, depth, market liquidity, and binding-constraint probability all decrease following the tick-size reduction, especially for low-priced stocks. These results can be attributed to relaxation of binding constraints. Additionally, stocks that are frequently traded, have larger market capitalization, or have restrictive binding constraints, experience considerable declines in spread, depth, and market liquidity following tick-size reduction (Hsieh & Lin, 2010; Goldstein & Kavajecz, 2000) investigate the impact of reducing the minimum tick size on the liquidity of the market using limit order data provided by the NYSE and find that both spreads and depths (quoted and on the limit order book) declined after decreasing tick size in New York Stock Exchange on June 1997. Goldstein & Kavajecz (2000) can prove that a decrease in bid-ask spread occurs because of a reduction in the NYSE tick size. The results of the study on reducing the tick size in world capital markets provide the conclusion that these policies will reduce the bid-ask spread and is expected to increase market liquidity.
On November 8, 2013, the Indonesia Stock Exchange (IDX) through the Decree of the Board of Directors of the Indonesia Stock Exchange Number Kep-00071/ BEI/11-23 regarding changes in trade units and price fractions. The trading unit, which was originally 500 shares per lot, is converted into 100 shares per lot. The original price fraction consists of five fractions converted into three fractions. This change is effective from the date January 6, 2014. The three fractions are Rp1 for a stock price of less than Rp. 500, a tick size of Rp. 5 for a stock price of Rp.500 to less than Rp. 5000 and a tick size of Rp 25 for a stock price of more than or equal to Rp. 5,000. Through the Decree of the IDX Board of Directors number Kep-00023/BEI/04-2016, the IDX applies 5 price fraction units from the previous 3 price fraction units. These five tick size categories used by the IDX in determining the listed stock price of the issuer, consist of a tick size of Rp1 for a stock price of less than Rp. 200, a tick size of Rp. 20 for a stock price of Rp.200 to less than Rp. 500, a tick size of Rp 50 for a stock price of less than Rp. 2,000, a tick size of Rp. 100 for the stock price of Rp. 2,000 to less than Rp. 5,000, and a tick size of Rp. 250 for a stock price of more than or equal to Rp. 5,000. The purpose of adjusting the price fraction is to increase liquidity and market capitalization and to increase the competitiveness of the Exchange.
Ekaputra & Asikin (2012) investigate the impact of tick size reduction on stock price efficiency and execution cost. The microstructure effect of the new tick size should only impact small capitalization traded at Rp. 200 or lower, for those stocks were previously traded at Rp.5 of tick size. Using OLS and quantile regressions can prove that the new tick policy significantly improves small capitalization price efficiency and partially reduces execution cost. The new tick size moderately reduces the mean of execution cost but does not reduce the median. The Execution cost is a cost of trading an asset quickly. Based on both studies that examine the effect of decreasing tick size can prove that the policy of decreasing tick size can reduce the market spread, which means the market becomes more liquid. Direct trading costs are lower when the tick size is reduced and as a result increases trading liquidity. A changes in the reduction of Lot Size Policy (LSP) and Tick Size Policy (TSP) has no impact on investor reaction. Using paired sample t-test with purposive sampling technique, the hypothesis of testing result in 10 (ten) the most active stocks LQ45 indicate there isn’t significant differences in average abnormal return before and after the change of LSP and TSP. These results indicate that the reduction of LSP and TSP has created a reaction reflection of investors who responded positively, which marked with the increasing volume of stock trading activity by investors, so that potentially create greater liquidity and greater market capitalization. Finally, it could encourage the development of Indonesian capital market industry (Endri et al., 2020).
The study about the impact of change of trade units and price fraction on stock liquidity in the Indonesia Stock Exchange (IDX) in case of on January 6, 2014, IDX implemented new lot size and tick size: 500 shares per lot become 100 shares per lot, and five ticks (Rp1, Rp5, Rp10, Rp25, Rp50) become three ticks (Rp1, Rp5, Rp25). Using daily data, non parametric sign test and parametric paired samples t-test, this study finds the new policy significantly reduces bid-ask spread and market depth, but doesn’t impact trading volume. From the viewpoint of width and immediacy, stock liquidity is enchanced; but from the viewpoint of depth, stock liquidity is diminished. The reduction of bid-ask spread is not followed by the enhancement of trading volume, meanwhile bid-ask spread in its relation with transaction cost should be negatively correlated with trading volume (Endri, 2016). Hypothesis 2 is established as follows.
H2 Tick size reduction can lower trading friction in Indonesian Stock Exchange
The measure of stock liquidity used by Copeland (1979) is a proportional change in stock trading volume and execution cost changes. Execution cost is the amount of costs that must be spent to convert stocks into cash or vice versa. Liquidity is influenced by several factors including execution cost and return. Both can cause stocks to become illiquid. The higher the return and execution cost, the smaller the liquidity (Hasbrouck & Schwartz, 1988). There are several components of transaction costs; (1) explicit transaction costs which consist of brokerage commissions, exchange admin fees and government taxes. Amihud et al. (2006) call it as exogenous transaction costs that can causes illiquidity or difficulties in trading assets; (2) implicit transaction costs which consist of bid-ask spreads. Bid ask spread is the difference between the highest purchase price (best bid) and the lowest bid price (best ask) If the bid-ask stock is low, the liquidity will be high; (3) missed trade opportunity costs: costs that arise when a trader fails to execute his order at the right time.
Unlike commissions and taxes, which are explicit, execution costs are the hidden cost of trading. They exist because trading is not frictionless process. The rules and protocols that govern the submission of orders, and the translation of orders into trades, affect the trades that are realized, the price that are established in the market, and the execution costs that market participants incur. Execution costs are related to the quoted bis ask spread and other variables like active traders, issue traded and the design of a market center matters (Hasbrouck & Schwartz, 1988). Stoll (2000) called the implicit transaction cost is trading friction. Follow the approach of Demsetz (1968), trading friction is viewed as the price concession paid for immediacy (Stoll, 2000). The sources of trading friction are studied there are real friction and informational friction. Real friction consists of order processing costs and inventory holding costs, while informational friction comes from adverse information. The trade friction view relies on real friction arguments such as; Garman (1976); Amihud & Mendelson (1980), and Laux (1995), while informational arguments such as; Copeland & Galai (1983); Glosten & Milgrom (1985) and Kyle (1985).
Order processing cost is defined as the cost charged by a securities trader for his readiness to bring together buying and selling orders and compensation for free time. Order processing cost is inversely proportional to trading volume. The order processing cost will decrease (increase) as the volume increases (decreases) (Tinic, 1974). Inventory holding costs are costs borne by securities traders to guarantee the availability of shares to be traded according to demand, including the costs of arranging trading, recording and clearing transactions. Inventory holding cost is the dealer opportunity cost in holding securities, the amount of which is directly proportional to the price of securities. Inventory holding costs will increase (decrease) along with increasing (decreasing) trading frequency (Tinic, 1974; Demsetz, 1968). Information costs are caused by adverse information costs are costs that describe a wage or reward given to securities traders to take risks when dealing with investors who have superior information. This component is related to information flow in the capital market (Copeland & Galai, 1983; Glosten & Milgrom, 1985; Kyle,1985).
Testing about the intraday trading and price change for frequently traded stocks in Indonesian Stock Exchange using bid and ask price, trade price, number of trade, trade volume, to measure and identify the source of trading friction and to infer what is the biggest component of trading friction to 50 most frequently traded stocks in the Indonesian Stock Exchange conclude that the average trading friction of high market capitalization and the most relatively liquid stocks, scattered in various fractions price is equal to 1% per year, and the highest trading frictions derived from the information and it is consistent with spread decomposition estimator (Nurhayati et al., 2018). In this study, the component of friction to be tested is only implicit transaction cost consist of proportional quoted half spread, proportional effective half spread, proportional first traded half spread and proportional second traded half spread, based on the models proposed by (Stoll, 2000) and does not take into account other costs (explicit costs such as broker and tax costs or trade opportunity costs), although brokerage taxes and commissions are a component of transaction costs, the bid-ask spread is widely used by researchers as the main proxy in measuring liquidity.
Friction in financial markets measures the difficulty with which an asset is traded (Stoll, 2000). Demsetz (1968), which is to view friction as the price concession paid for immediacy. Friction can be measured as a static concept observable at the moment of the trade as a cost of a round trip two trades use quoted and effective spreads. They measure total frictions that reflect both real and informational friction. The quoted and effective half spread is the spread is the cost of one trade. Quoted half spread defined as S = (A-B) / 2 while the effective half spread defined as ES|P -M| where is the ask price and B is the bid price, P is the trade price and M is the quote midpoint. Previous researches find that quoted half spread is higher than effective half spread (Cai et al., 2008; Huang & Stoll, 1996; Stoll, 2000; Nurhayati et al., 2018). Traded half spread is one of the model used to measure real friction. here are two version of the traded half spread, differing in the weighting of trades are calculated. The first weights each trade equally. The second weights by trade volume, the first traded half spread defined as 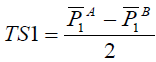 ((Stoll, 2000), where
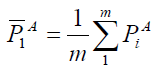 and
and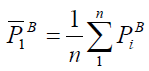 while the second traded half spread defined as
 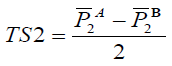 where
where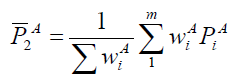 and
and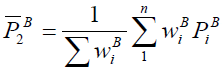 where m is number of trades on the side of ask,
 is price in trade in i in the side of ask, n is trade quantity in the side of bid, and
 is price in trade in i in the side of bid.
  is Stock volume of the first buy in i and
 is Stock volume of the first sell in i. In this studi we don’t use informational friction because it’s not relevan with the topic of this research about tick size. The previous research, which used spread as a proxy to measure liquidity, analysis the influence of tick size reduction and the relaxations of binding constraint probability on market liquidity in the Taiwanese Stock Market, show that the spread, depth, market liquidity, and bindingconstraint probability all decrease following the tick-size reduction, especially for low-priced stocks (Hsieh & Lin, 2010). Hypothesis 3 is thus established as follows.
H3 Tick size reduction has a significant impact on the reduction in real friction (% TS1 and% TS2) compared to the reduction in total friction% S &% ES).
Research Methodology
This work uses intraday transaction and quote data to examine the effect of tick-size reduction on various aspects of market liquidity. The data used in this research is secondary data consist of intraday trade transaction prices, composite stock price index, trading volume, number of trades, market capitalization. The intraday data and stock characteristics used in this work are taken from the IDX (Indonesian Stock Exchange) database and only include common stocks. Base on the availability of data, the pre-reduction period runs from August 1, 2015 to October 31, 2015, while the post-reduction period runs from August 1, 2016 to Ocotber 31, 2016 and August 1, 2017 to October 31, 2017. The research sample are stocks traded on the regular market, with closing prices below Rp. 200 and stocks are not delisted in the observation period (2015 - 2017).
To measure trading cost, this reserch uses percentage proportional half spread (%S, %ES, %TS1 and %TS2) too calculate the best bid and ask for each transaction, two data are needed are transaction data and order data. In evaluating these orders, not all orders are used, but only valid orders, while invalid ones are passed. Valid order criteria are the order is within the opening time range up to t-5 (t-5 mean five minutes before transaction). Order status is outstanding or matching provided that the matching time exceeds t-5, so at t-5 the order is still valid, not executed. While invalid order criteria are orders are within the timeframe after t-5 and order status is amend or withdraw or matching whose matching time is before or equal to t-5, because it means that the order has been executed. Problematic data which includes order data with prices outside the best bid and best ask while (can occur in transactions outside the OTC mechanism), order data with the number of shares outside lots and order data whose prices are based on program analysis have matched, but in reality the data is not executed.
The daily value of S and ES can be generated by adding trading friction (the quoted half spread (S), effective half spread (ES), first traded half spread (TS1) and second traded half spread (TS2)) per transaction divided by the number of transactions in one day. Based on the results of daily S, ES, TS1, TS2 quantities can also be generated according to the length of the observation period. This calculation is carried out for all stocks that are the research sample. The proportional half spread (%S, %ES. %TS1 and %TS2) is obtained by dividing the respective sizes of friction [quoted half spread (S), effective half spread (ES), first traded half spread (TS1) and second traded half spread (TS2) by the average closing price. The proportional half spread (average quoted half spread, effective half spread and traded half spread) is grouped based on the tick size and the average closing price per tick size.
Analysis and Results
This section examines the effects of the difference of tick-size on stock price. Low-priced stocks experience larger declines in spread and depth than high-priced stocks. Furthermore, the effects of tick-size reduction on the changes of trading friction during the pre- and post-period and the impact of tick size reduction on real friction (% TS1 and% TS2) compared to the reduction on total friction% S &% ES) are also examined. Table 1 shows that the higher the tick size has the lower the trading friction tendency, this tendency occurs in almost all friction measurements using the average proportional quoted half spread, the proportional effective half spread, the proportional first traded half spread and the proportional second traded half spread in the observation period both before and after the change in tick size. The results of the average proportional half spread measurements from 2015 to 2017 based on the stock price, number of transaction, bid and ask price, are presented in Table 1.
| Table 1 Average Proportional Half Spread in 2015, 2016 and 2017 | |||||||
| Year | Tick Size | Average Price | Number of Trades | Average Proportional Half Spread | |||
| %S | %ES | %TS1 | %TS2 | ||||
| 2015 | 1 | 171 | 135238 | 0.007607 | 0.007712 | 0.003501 | 0.002733 |
| 5 | 2746 | 141292 | 0.014235 | 0.013804 | 0.00671 | 0.007276 | |
| 25 | 8658 | 213842 | 0.00332 | 0.003411 | 0.001469 | 0.001242 | |
| 2016 | 10 | 117 | 164932 | 0.023027 | 0.023446 | 0.00499 | 0.00528 |
| 20 | 267 | 166240 | 0.008231 | 0.008704 | 0.004498 | 0.003953 | |
| 50 | 1726 | 439101 | 0.011888 | 0.01231 | 0.002545 | 0.002255 | |
| 100 | 4110 | 278276 | 0.013681 | 0.014312 | 0.003425 | 0.003416 | |
| 250 | 14788 | 132542 | 0.004411 | 0.004559 | 0.002433 | 0.00216 | |
| 2017 | 10 | 152 | 184902 | 0.018951 | 0.020808 | 0.011465 | 0.011033 |
| 20 | 308 | 169101 | 0.012562 | 0.01513 | 0.007589 | 0.007256 | |
| 50 | 1659 | 616329 | 0.006804 | 0.007139 | 0.003429 | 0.00323 | |
| 100 | 3097 | 412136 | 0.007272 | 0.007734 | 0.003931 | 0.003564 | |
| 250 | 9621 | 336707 | 0.007615 | 0.008 | 0.002988 | 0.002664 | |
Proportional half spreads are obtained by dividing each trading friction with closing price. Proportional half spread (quoted half spread, effective half spread and traded half spread) are grouped based on tick size and average closing price per tick size. It can be concluded that there is a tendency for the spread to increase in the tick size which is getting smaller at higher prices. The proportional half spread which tends to decrease means that there is a negative relationship between stock prices and all measures of friction. Based on the description of the spread with the size tick, it can prove the hypothesis 1 that low-priced stocks experience larger declines in trading friction than high-priced stocks.
To test the hypothesis about whether there is an influence of the policy to decrease the tick size to decrease in trading friction, the following Table 2 illustrates the impact of the decrease in tick size on changes in proportional half spread. Hypothesis testing will be conducted on several friction measurement models consisting of proportional quoted half spread (%S), proportional effective half spread (% ES), proportional first traded half spread (% TS1) and second traded half spread (TS2) to tick size. Table 2 presents the results of difference test of average trading friction (%S, %ES, %TS1, %TS2) caused of tick size change in 2015 and 2016. Based on the difference test of average trading friction (%S and %ES) caused of tick size change in 2015 and %S in 2016, it can be concluded that at the tick size of Rp. 250 (Rp 25) and Rp.50 & Rp. 100 (5) the change in friction is relatively fixed (very small), at the tick size of Rp.10 & 20 (1) have a decrease in friction, but the parameters are not significant. the difference test of average trading friction (%S and %ES) caused of tick size change in 2015 and %S in 2016 are different from the two previous test results (when using the% S and% ES measures, although there is a decrease in friction, it is not significant). Even though the tick size of Rp. 250 (Rp 25) and Rp.50 & Rp. 100 (5) the change in friction is relatively fixed (very small), but the change or trading friction the tick size of Rp.10 & 20 (1) had an impact on decreasing trade friction in that year and proved a significant decrease at α 1% and based on the all data, can prove the hyphotesis 2 that tick-size reduction can reduce trading friction in Indonesian Stock Exchange. The average difference test using real friction (%TS1 and %TS2) to determine the effect of decreasing tick size on friction can proved that the reduction of tick size can lower trading friction and significant at α 1%. This is because of real friction reflects order processing as relevant costs in the presence of tick size in trade transactions. The test uses total friction (%S and %ES) despite a decrease in friction but the change in tick size cannot explain the decrease in trade friction because the parameters prove to be insignificant. It can prove the hypothesis 3 that tick size reduction has a significant impact on the reduction in real friction (% TS1 and% TS2) compared to the reduction in total friction% S &% ES).
| Table 2 Difference Test of Average Trading Friction Caused of Tick Size Change | ||||
| Average Proportional Half Spread | Tick Size | |||
| 250 (25) | 50 & 100 (5) | 10 & 20 (1) | All Data | |
| %S 2015 | 0.0033 | 0.0142 | 0.0076 | 0.0114 |
| St. Dev. | 0.0014 | 0.0163 | 0.0036 | 0.0151 |
| %S 2016 | 0.0044 | 0.0147 | 0.005 | 0.0117 |
| St. Dev. | 0.0026 | 0.019 | 0.0013 | 0.0182 |
| Difference in Average | -0.0011 | -0.0005 | 0.0026 | -0.0003 |
| Sig | 0.1553* | 0.4782 | 0.0542** | 0.4676 |
| %ES 2015 | 0.0034 | 0.0138 | 0.0077 | 0.0115 |
| St. Dev. | 0.0014 | 0.0146 | 0.0035 | 0.0149 |
| %ES 2016 | 0.0046 | 0.0154 | 0.0051 | 0.0121 |
| St. Dev. | 0.0027 | 0.0197 | 0.0013 | 0.0185 |
| Difference in Average | -0.0011 | -0.0016 | 0.0026 | -0.0006 |
| Sig | 0.1504* | 0.4258 | .0487*** | 0.4333 |
| %TS1 2016 | 0.0015 | 0.0067 | 0.0035 | 0.0054 |
| St. Dev. | 0.0005 | 0.0091 | 0.0022 | 0.0068 |
| %TS1 2016 | 0.0024 | 0.0035 | 0.0027 | 0.0037 |
| St. Dev. | 0.0023 | 0.0024 | 0.0009 | 0.0031 |
| Difference in Average | -0.001 | 0.0032 | 0.0008 | 0.0016 |
| Sig | 0.1228* | 0.1765* | 0.2165 | 0.0804** |
| %TS2 2015 | 0.0012 | 0.0073 | 0.0027 | 0.0051 |
| St. Dev. | 0.0005 | 0.0099 | 0.0022 | 0.0072 |
| %TS2 2016 | 0.0022 | 0.0036 | 0.0023 | 0.0036 |
| St. Dev. | 0.0025 | 0.0025 | 0.0005 | 0.0027 |
| Difference in Average | -0.0009 | 0.0037 | 0.0005 | 0.0016 |
| Sig | 0.1571* | 0.1580* | 0.307 | 0.0937** |
The results of this study are consistent with the results of previous researches where a decrease in tick size can reduce trading friction which can have an impact on increasing stock liquidity. Ekaputra & Asikin (2012) can prove that tick size reduction have positif impact on stock price efficiency and decreasing execution cost. Research conducted by Setyawasih (2011) that investigated a new tick size of Rp. 1 on Desember, 2006 in Indonesian Stock Exchange can prove that the new tick size significantly enhance liquidity in term of market depth but not to relative spread and depth-to-relative spread. Tick size reduction on Taiwanese stock market, an emerging order-driven market, also can decrease spread, depth, market liquidity, and binding-constraint probability especially for low-priced stocks. Additionally, stocks that are frequently traded, have larger market capitalization, or have restrictive binding constraints, experience considerable declines in spread, depth, and market liquidity following tick-size reduction. Thus, tick-size reduction in the Taiwanese Stock Market can increase market efficiency and reduce the investors’ trading costs (Hsieh & Lin, 2010). Study about the implementation new policy about tick size reduction on IDX on January 6, 2014, find that this new policy significantly reduces bid-ask spread and market depth, but doesn’t impact trading volume. From the viewpoint of width and immediacy, stock liquidity is enchanced; but from the viewpoint of depth, stock liquidity is diminished. To resolve these contradictory results, trading volume is used for comparison. The reduction of bid-ask spread is not followed by the enhancement of trading volume, meanwhile bid-ask spread in its relation with transaction cost should be negatively correlated with trading volume (Endri, 2016). For the same issue of reduction tick size policy on IDX, for the most active stocks LQ45 indicate that there is no significant differences in average abnormal return before and after the change of Lot Size Policy (LSP) and Tick Size Policy (TSP). The results indicate that the reduction of LSP and TSP has created a reaction reflection of investors who responded positively, which marked with the increasing volume of stock trading activity by investors, so that potentially create greater liquidity and greater market capitalization. Finally, it could encourage the development of Indonesian capital market industry (Razak et al., 2020; Endri & Fathony, 2020)
Conclusion
This paper examine the influence of tick-size reduction on the market liquidity using trading friction in Indonesian Stock Exchange an emerging order driven market. The empirical results show that variable in determining the difference in performance of IDX stocks following the tick size reduction is the price of the stock. Low-priced stocks experience larger declines in trading friction than high-priced stocks. Tick size reduction has a significant impact on the real friction (% TS1 and% TS2) compared to the total friction (% S &% ES). The difference test of the average change in proportional quoted half spread (%S) and proportional effective half spread (%ES) as the impact of tick size reduction can’t prove there is the influence of tick size reduction on market liquidity, because the parameter isn't significant. While the difference test of the average change in proportional first traded half spread (% TS1) and proportional second traded half spread (% TS2) can prove the effect of the tick size reduction to the decline in trading friction. The average difference test of proportional quoted half spread (%S), proportional effective half spread (%ES), proportional first traded half spread (%TS1) and proportional second traded half spread (%TS2) as a proxy of liquidity caused of tick size change can prove the impact of tick size reduction against a decrease in trading friction. As a measure of real friction, the average difference test uses real friction (%TS1 and %TS2) prove that tick size reduction can impact the decrease of trading friction and significant at α 1%, this is because real friction reflects order processing as relevant costs in the presence of tick size in trade transactions. The test uses total friction (%S and %ES) despite a decrease in friction but the change in tick size cannot explain the decrease in trade friction because the parameters prove to be insignificant.
References
- Amihud, Y., & Mendelson, H. (1980). Dealership market, market making with inventory. Journal of Financial Economics, 8, 31-53.
- Amihud, Y., Mendelson, H., & Pedersen, L.H. (2006). Liquidity and asset prices. Foundations and Trends in Finance, 1(4), 269-364.
- Bessembinder, H. (2000). Tick size, spreads, and liquidity: An analysis of nasdaq securities trading near ten dollars. Journal of Financial Intermediation, 9(3), 213-239.
- Cai, C.X., Hillier, D., Hudson, R., & Keasey, K. (2008). Trading frictions and market structure: An empirical analysis. Journal of Business Finance & Accounting, 35(3-4), 563-579.
- Copeland, T. E. (1979). Liquidity changes following stock splits. The Journal of Finance, 34(1),115-141.
- Copeland, T.E., & Galai, D. (1983). Information effects on the bid-ask spread. The Journal of Finance, 38(5), 1457-1469.
- Demsetz, H. (1968). The cost of transacting. The Quarterly Journal of Economics, 82(1), 33-53.
- Ekaputra, I.A., & Asikin, E.S. (2012). Impact of tick size reduction on small caps price efficiency and execution cost on the Indonesian stock exchange. Asian Academy of Management Journal of Accounting and Finance, 8(1), 1-12.
- Endri, E., & Fathony, M. (2020). Determinants of firm’s value: Evidence from financial industry. Management Science Letters, 10(1), 111-120.
- Endri, E., Abidin, Z., Simanjuntak, P,T., & Nurhayati, I. (2020). Indonesian stock market volatility: GARCH model. Montenegrin Journal of Economics, 16(2), 7-17.
- Endri. (2016). Dampak perubahan satuan perdagangan dan fraksi harga terhadap likuiditas saham. MIX: Jurnal Ilmiah Manajemen, 6(1), 56-69.
- Garman, M. (1976). Market microstucture. Journal of Financial Economics, 3, 257-275.
- Glosten, L.R., & Milgrom, P.R. (1985). Bid, ask and transaction prices in a specialist market with heterogeneously informed traders. Journal of Financial Economics, 14(1), 71-100.
- Goldstein, M.A., & Kavajecz, K.A. (2000). Eighths, sixteenths, and market depth: changes in tick size and liquidity provision on the NYSE. Journal of Financial Economics, 56,125-149.
- Harris, L. (1994). Minimum price variations, discrete bid-ask spreads, and quotation sizes. The Review of Financial Studies, 7(1), 149-178.
- Hasbrouck, J., & Schwartz, R. (1988). Liquidity and execution costs in equity markets. Journal of Potfolio Management, 14(3),10-17.
- Hsieh, T.Y., & Lin, C.C. (2010). Impact of tick-size reduction on the price clustering: Evidence from the emerging order-driven market. Asia Pacific Management Review, 15(4), 517-532.
- Huang, R.D., & Stoll, H. (1996). Dealer versus auction markets: A paired comparison of execution costs on NASDAQ and the NYSE. Journal of Financial Economics, 41(3), 313-357.
- Kyle, A. (1985). Continuous auctions and insider trading. Econometrica, 53(6), 1315-1335.
- Laux, P.A. (1995). Economic dy namics & control dealer market structure, outside competition, and the bid-ask spread. Journal of Economic Dynamics and Control Dynamics and Control, 19, 683-710.
- Nurhayati, I., & Endri, E. (2020). A new measure of asset pricing: Friction-adjusted three-factor model. Journal of Asian Finance, Economics, and Business, 7(12), 605-613.
- Nurhayati, I., Ekaputra, I.A., & Husodo, Z.A. (2018). Trading friction and spread decomposition in indonesian stock exchange. In Proceedings International Conference Bksptis 2018.
- Purwoto, L., & Tandelilin, E. (2004). The impact of the tick size reduction on liquidity: Empirical evidence from the jakarta stock exchange. Gadjah Mada International Journal of Business, 6(2), 225-249.
- Razak, A., Nurfitriana, F.V., Wana, D., Ramli, R., Umar, I., Endri, E. (2020). The effects of financial performance on stock returns: Evidence of machine and heavy equipment companies in Indonesia. Research in World Economy, 11(6), 131-138.
- Setyawasih, R. (2011). The impact of tick size decrease on market quality and market liquidity determinants in the indonesia stock exchange (Case Study Tick Size IDR 1.00 for Shares with Prices Less than IDR 200.00). Optimal: Journal of the Faculty of Economics, Islamic University "45" Bekasi, 5 (1), 4437.
- Stoll, H.R. (2000). Presidential address: Friction. The Journal of Finance, 55(4), 1479-1514.
- Tinic, S.M. (1974). Marketability of common stocks in Canada and the USA: A comparison of agent versus dealer dominated markets. Journal of Finance, 29, 729-746.