Research Article: 2025 Vol: 29 Issue: 3
Impact of Macro-Economic Variables on Environmental Degradation in India: “Paving the Way towards a Green Economy”
Mehak Kohli, Shri Mata Vaishno Devi University Kakryal Katra
Roop Lal Sharma, Shri Mata Vaishno Devi University Kakryal Katra
Citation Information: Kohli, M., & Sharma, R.L. (2025). Impact of macro-economic variables on environmental degradation in India: “paving the way towards a green economy”. Academy of Marketing Studies Journal, 29(3), 1-16.
Abstract
Following the United Nations Sustainability Development Goals, this study explored the impact of macroeconomic variables on carbon dioxide emissions. By considering the significance of symmetries and asymmetries, this study investigates the symmetric (linear) impact of poverty, income inequality, population, economic growth, renewable energy consumption, and urbanization on CO2 emissions in India, spanning the data from 1991 to 2019. To this end, the autoregressive distributed lag (ARDL) model is used to examine the symmetric impact of the variables on the environment. The symmetric results of the current study show that poverty, economic growth, and urbanization increase carbon dioxide emissions in both the short run and long run but on the other side, there can be seen a mixed impact of income inequality, and population on the environment degradation. In light of these results, this study also suggested some policy implications regarding the United Nation’s sustainability development goals and future research avenues in the concluding section.
Keywords
Sustainability, Environment, Economic growth, Poverty.
JEL Classification
C50, Q56.
Introduction
In recent years, India has emerged as a dynamic economic powerhouse, experiencing rapid industrialization, urbanization, and technological advancement (George, 2023; Wang et al., 2020). This economic transformation has brought unprecedented growth and prosperity to the nation, but it has also raised concerns about its environmental footprint, particularly in terms of carbon dioxide (CO2) emissions (Ali et al., 2023; Akhter et al., 2021). It becomes increasingly important to understand how macroeconomic variables affect CO2 emissions in the context of India's pursuit of economic development and environmental sustainability. The economic expansion of rising nations hurts the environment by increasing the consumption of fossil fuels for industrialization and supporting economic growth (Li & Haneclaus, 2021; Yang et al. 2020; Hanif et al., 2019). On the other side, the argument that poverty is a cause and effect of environmental degradation has been discussed extensively, especially in developing nations where a sizable portion of the population lives at or below the poverty line and does not benefit from economic progress. A large portion of the impoverished population in emerging nations depends heavily on the agriculture sector, which relies heavily on natural resources (Masron & Subramaniam, 2019), due to which the poor people abuse the natural resources to make ends meet; for example, they clear forests to meet their energy demands and, in this way, it leads to an indirect contribution to the rapid depletion of natural resources (Farooq et al., 2020). Poverty and the environment both are declared the most multifaceted problems faced by most countries (UNICEF, 2016). To bring humanity out of poverty and to protect the environment for future generations, several industrialized and developed countries from around the globe have come together to achieve these goals (Baloch et al., 2020; Maji, 2019) and attained more success by inspiring more industrialization and production levels (Islam &Ghani, 2018). However, to promote green economic growth, certain economic activities demand energy, which further leads to an upsurge in environmental degradation, undesirably disturbing social welfare and sustainable development (Qamruzzaman & Jianguo, 2020; Danish, 2019). But in addition to the escalating environmental crises, the modern era is marked by social crises brought on by the unequal distribution of income. As per Grossman and Krueger (1995), the hypothesis of EKC revealed a convex relationship between income inequality and the environment (Zhao et al., 2021; Hafeez et al. 2019; Hafeez et al. 2018). This also hypothesizes that after they reach a specific income level, the richer people lower the pollution emissions because they can afford and have higher demands for a better environment (Li et al. 2020, 2021a, b; Hafeez et al. 2019; Chiu & Lee, 2019).
Currently, India incorporates a share of 17% of the world’s population but still emits only 7% of global emissions. Given that India's per-capita emissions are lower than the world average, this is encouraging from a sustainability standpoint (Itoo & Ali, 2022). India is currently the third-largest global CO2 emitter while emitting far less than developed countries like China and the US, which raises concerns for researchers and policy officials about how to combat this threat. On the other side, determining how urbanization affects a nation's green growth would enable identifying the necessary adjustments and tools for attaining green growth in light of urbanization (Kotowicz et al., 2022; Adamowicz, 2022; Rybalkin et al., 2021; Guo et al., 2020) because an increase in urbanization raises the concern in both energy consumption and environmental degradation. Firstly, most residents from urban areas straightly upsurge consuming coal, natural gas, oil, and other kind of energy. Secondly, these people are also influenced towards personal cards, tourist activities, and housing, which in further leads to an increase in energy consumption and CO2 (Yan et al., 2022). Therefore, with the rise in population and urbanisation, it can be analysed that it also increases the demand for energy consumption which becomes very important to maintain the harmony with all the ongoing distractions and revolutions in the world (Zhang et al., 2017). However, the whole world has initiated paying their attention towards the problems related to environment connected with rising carbon dioxide emissions, and in that way, various countries recognised the usage and consequences of renewable energies like solar energies, hydropower, wind, geothermal, biomass etc. (Sinha et al., 2017). At the same time, renewable energy consumption and its share in total energy are constantly rising. As the massive demand for renewable energy and the continuously growing green-house gas emission levels, the nexus of emission- growth-renewable energy consumption needs to be properly analysed, which can further proved to be useful in removing the problem of global warming by encouraging the progress in renewable energy sources (Dong et al., 2019).
Likewise, over the past 20 years, there is continuous research is ongoing on the determinants of CO2 emissions which has flourished (Dong et al., 2020; Andreoni & Galmarini, 2016). The main theoretical base behind this concept is to describe the long run relationships between various variables and CO2 emissions which implied that there is an inverted U-shaped linkage between GDP per capita and environment variable like CO2 emissions, also known as Environment Kuznet Curve (EKC) framework. An expansion of the Economic growth paradigm, green growth promotes environmental protection while fostering economic advancement. Put differently, green growth is thought to be a successful strategy for promoting EG and resolving environmental conflicts within a nation. The main goal of "green growth" is to advance the economy while protecting the environment (Tereshchenko et al., 2023). Various policies are announced by the institutions worldwide to fortify the governments so that they can implement the green growth practices. These policies highlighted three essential challenges: energy use, social development and environmental deprivation. Hence, the green growth can be measured as the efficient method of economic development through protecting the environment ((Wahab et al. 2022). Green economic growth consists of nine SDGs goals out of sixteen SDGs and this study focused on SDG1 (No poverty), SDG7 (Affordable and clean energy), SDG8 (decent work and economic growth), SD10 (reduced inequalities), SDG13 (climate action). The present study has focused on the role of institutions in providing several policies which helps to attain the green economy by achieving various SDGs in case of India. There are several studies who have focused on various macro-economic determinants of CO2 emissions (Farouq &Sulong, 2023; Anwar et al., 2023; Iqbal et al., 2023; Caglar et al., 2022; Shpak et al., 22; Aslam et al., 2021; Li et al., 2021; Cosmas et al., 2019). Defining the impact of macro- economic variables on the environment of a country permits the appropriate variations and tools for attaining the green growth in the country. Many studies have still not reached at an agreement with the green policies which directly shows that still some countries are facing this issue and their environment quality are continuously declining. As a result, it is very important for the countries to grab this opportunity so that they can initiate policies to gain the SDGs and the Green Deal policy.
In the previous perspective, this study is an effort to bridge the gap in literature in the context of India. The present study focuses on to incorporate various macro- economic variables in respect to the environmental degradation and develops an approach to achieve the “Green Economy” in the country India by extending the various parameters which has received very less or no attention before. Furthermore, the investigation is done by analysing the symmetric impact by applying the ARDL technique. To this extent, the outcomes from this study will help the policymakers, practitioners and researchers to suggest various green growth policies and aims to improve the environment sustainability within renewable energy consumption and economic progress without disturbing the environment quality.
The paper consists of following structure: Section 2 contains a review of literature. Section 3 consists of description of data and methodology incorporated in the study. Section 4 elaborate the empirical findings with proper justifications. Section 5 outlines the conclusion, suggesting the policy implications and future research aspects.
Literature Review and Hypothesis
Even though, there are large number of studies that have analyzed the impact of macro-economic variables on environment degradation but very few studies have targeted this examination towards achieving green growth. By considering this approach, we have divided the existing literature into the following broad titles and the latest studies under each section is assembled.
Poverty and CO2 Emissions
The poverty- environment connection has been analysed in the various literature but the relationship between them is quite complex and multifaceted because poverty exacerbates the strain on finite resources and degrades the environment when combined with rapid population growth and weak environmental regulations. (Kocak et al., 2019). Recent studies have shown that carbon emissions can be more than double with the poverty alleviation for both low and middle-income countries (Baloch et al., 2020; Dorband et al., 2019). It is also suggested that putting efforts to alleviate the poverty in these areas may lead to upsurge in CO2 emissions but globally its effect becomes relatively less (Proskuryakova & Ermolenko, 2022). However, research on global carbon inequality suggests that lifting the world's poorest people out of poverty will result in considerable increase in worldwide carbon emissions, with China and India seeing increases of 4% and 7%, respectively (Hubacek et al., 2017). Moreover, a study by Radoine, 2022 has analysed that the quest of economic progress and industrialization, which are viewed as means of escaping poverty, is frequently associated with rising CO2 emissions in emerging nations, especially those with high rates of poverty. But if left unchecked, this could result in worsening environmental damage. The main difficulty lies in striking a balance between environmental sustainability and economic development so that initiatives to combat poverty don't result in higher CO2 emissions. According to another group of researchers, there is a causal relationship between poverty and environmental degradation that exists in both directions (Amin et al., 2023; Dhrifi et al., 2022). They proposed that both rich and poor people contribute to the overuse of natural resources and environmental degradation but the effects on the former are greater than those on the latter because the former are perceived as both representatives and victims of environmental degradation. Few more studies had incorporated their association but still these approximations are indecisive, where as many researchers are unable to provide a relevant and clear picture on their estimation towards attaining the green economy.
H1: Poverty has an impact on CO2 emissions in India.
Income Inequality and CO2 emissions
Both the climate change and income inequality have become two persistent issues of the present time (Wolde-Rufaela & Idowub, 2016). Currently many researchers are interested in studying the relationship between income inequality and other economic indicators, such as economic growth. However, the association between income inequality and environmental degradation has not received enough attention, and as a result, it is now a popular topic of study in the empirical literature. Their relation can be understood with the two aspects. According to the first aspect, the positive association exists in between income inequality and environment degradation which in turn suggests that as income inequality increases, so do the emissions. (Khan et al., 2022; Zhou & Li, 2020; Zhang & Zhao, 2014). This is partly correct because the widening gap between the rich and the poor ones, which further leads to more extreme demands from low-income individuals, who are not motivated to contributing in reduction of climate change (Wollburg et al., 2023). Another study by Wang et al., 2024 concentrating on Africa and found that in the fastest-growing economies, there is a positive correlation between GDP per capita growth and CO2 emissions, suggesting that rising income disparity might be linked to economic growth, which frequently results in higher CO2 emissions. The intricate interactions of social justice, environmental sustainability, and economic development are highlighted by this relationship. Moreover, various studies analysed that economic development is positively correlated with an increase investment in human capital due to income inequality. Economic expansion also increases the supply and demand for services, which puts a brake on environmental deterioration (Pata et al., 2020; Cao et al., 2019). Che et al., (2023) found that income inequality has a positive and significant effect on carbon dioxide emissions in case of both developing and developed countries with a more significant impact in developed countries. The findings of Zhang and Zhang (2021) demonstrate a long-term positive correlation between China's carbon emissions and income disparity.
As per the second thought, some researchers suggested that income inequality have an extenuating impact on the environment degradation (Dada et al., 2023). To substantiate, a study by Yang et al., 2020 found that upsurge in income- inequality always results in better environmental outcomes which may be challenged by the possibility that increased income inequality could lower carbon emissions in both developed and developing nations. Some studies reported an insignificant effect of income inequality for all the regions of the country Japan (Sun et al., 2023; Kasuga and Takaya, 2017) and in case of USA (Pata et al., 2023). Heerink et al. (2001) and Gassebner et al. (2008) reported that income inequality lowers per capita carbon emissions, hence lessens the degradation of the environment. This aspect depends on the concept of marginal propensity to emit (MPE) in which both the income inequality and environmental degradation changes. Even though these two perspectives are dissimilar but both proved that there is a significant correlation between income disparity and environmental degradation as measured by CO2 emissions. The hypothesis can be considered as:
H2: Income inequality has an impact on CO2 emissions in India.
Population and CO2 Emissions
The study incorporated the population due to its complex and multifaceted impact on environment degradation, which various studies have highlighted. A substantial amount of research shows that there is a direct relationship between CO2 emissions and population size, indicating that CO2 emissions tend to rise as population grows (Lee & Zhao, 2023). Moreover, some of the results, which are demonstrating a strong and inverse association between population size and carbon emissions—CO2 emissions decreased by 0.17283% for every 1% rise in population size—underline this relationship (Zhang et al., 2023). The relationship between population and CO 2 emissions have been explored from various perspectives. Some of the studies have suggested that the primary ways by which the population growth impacts atmospheric carbon dioxide levels are through increased use of fossil fuels and forest destruction. Other research indicates that urban population and population growth dramatically reduce CO2 emissions on average by 13–38 units, emphasising the importance of public knowledge and literacy in encouraging the switch to lower-emission products like renewable energy sources (Ashenafi, 2022). There has also been a lot of attention in the connection between population-related issues and carbon emissions. Research has demonstrated that various factors, including population density, household size, urbanisation rate, and size of population impact energy consumption and carbon emissions (Lian et al., 2024). This suggests that one of the primary factors influencing the projected CO2 emissions is the population. In conclusion, a variety of factors, such as population increase, urbanisation, and demographic shifts, have an impact on the relationship between population and CO2 emissions. These results highlight how crucial it is to take population-related issues into account when attempting to reduce CO2 emissions and combat climate change.
H3: Population has an impact on C02 emissions in India.
Economic Growth and Co2 Emissions
There are numerous studies, which examined the relationship between economic growth and CO2 emissions on the basis of Environmental Kuznet’s Curve (EKC) framework and found that it is quite complicated and influenced by a number of variables, such as industrial activity, patterns of energy consumption, and the acceptance of green technologies (Adebayo et al., 2022). A distinct corelation exists between both economic growth and CO2 emissions in the long run which usually displays a positive association thereby showing an increase in economic growth rises the CO2 emissions (Hundie, 2021; Balsalobre-Lorente & Leitao, 2020). However, the strength of this relationship varies with the economic status as mostly the wealthy countries often having less of an impact on carbon emissions than developing countries (Zaman and Abd-el. Moemen, 2017). Some of the researchers have claimed that that when an economy is developing, CO2 emissions increase initially but then start to decline once a certain degree of development is attained (Xu et al., 2020; Chen et al., 2016; Kasperowicz, 2015). Moreover, Riti et al., (2017); Zhang et al. (2017); Han et al. (2018) explored the connection between economic growth and co2 emissions from the year 1970 to 2015 in the country China by incorporating the concept of environmental Kuznets curve (EKC). Bildirici (2017) proved a bi- directional relationship between the economic growth and environmental degradation. A study by Azam (2016) investigated the connection between economic expansion and the environmental damage caused by CO2 emissions between 1990 and 2011 and demonstrated that environmental deterioration has a detrimental impact on economic expansion. In Austria, particularly in case of small open and industrialized countries, a cubic link between green -house gas emissions and GDP has found from the period 1960 to 1999. An inverted U- shaped connection between economic growth and Co2 emissions has explored in both long and short run in the duration of 1980 to 2009 (Fujii & Managi, 2013). Zhao et al. (2017), demonstrated that the most crucial factor in raising CO2 emissions is investment scale; the most essential factors in lowering CO2 emissions are investment share, energy mix, process carbon intensity effect, carbon coefficient, and investment efficiency.
Few more studies explored the concept of decoupling the economic growth and co2 emissions as a way to accomplish sustainable economic development and indicating that their relationship can differ greatly depending on the national and regional circumstances (Han, 2021; Dong et al., 2020). Various research methods such as extended Kaya identity and the LMDI method have been used to investigate the elements that influence carbon emissions and found that, although the energy consumption structure effect can be useful in lowering emissions, the economic intensity impact and population size effect are the primary drivers of carbon emissions. This implies that regulating CO2 emissions may benefit greatly from policy initiatives aimed at these aspects. Research has also looked at the relationship between the use of renewable energy, economic growth, and CO2 emissions. The results show that, when combined with economic growth, the use of renewable energy can significantly reduce CO2 emissions (Imran et al., 2022). This emphasizes how crucial it is to switch to renewable energy sources to lessen the negative effects of economic activity on the environment. This proves how much economic growth analysis on environmental degradation is crucial. The hypothesis can be considered as:
H4: Economic growth has an impact on CO2 emissions in India.
Data and Methodology
After considering all the past studies, this empirical research incorporated variables like poverty, income inequality, population, and economic growth along with urbanization and renewable energy consumption to analyze their impact on environmental degradation in terms of CO2 emissions in India from 1991 to 2019. The explanation of these variables (measuring units, data sources, and their expected signs) is listed in Table 1. According to Worldometer, India ranks fourth in renewable energy consumption after China, the United States, and Russia and is the third largest country in case of carbon dioxide emissions after China and the United States. Therefore, this study attempts to examine the symmetric impact of the selected variables on the environment in the case of the country India.
| Table 1 Table of Parameters | |||
| Variables | Definition | Source | Expected Sign |
| CO2 emissions | CO2 emissions (metric tons per capita) | WDI | |
| POV | Poverty headcount ratio at $2.15 a day (2017 PPP) (% of population) | Poverty and equality platform | + |
| INE | Gini index | Poverty and equality platform | +/- |
| POP | Population density (people per sq. km of land area) | WDI | + |
| EG | GDP per capita (constant 2015 US$) | WDI | +/- |
| REC | Renewable energy consumption | WDI | - |
| URB | Urbanization | WDI | + |
The study incorporated the model CO2 emissions as a function of the variables under consideration is:
CO2 = f (POV, INE, POP, EG, REC, URB) (1)
Where CO2, POV, INE, POP, GDP, REC, and URB represent carbon dioxide emissions, poverty, income inequality, population, economic growth, renewable energy consumption, and urbanization, respectively. In addition, all the variables have transformed into logarithmic forms to eradicate the problem of heteroscedasticity.
For the analysis purpose, the study used the yearly data, where most of the variables are taken from the World Development Indicators (WDI) and Poverty and Equality Platform (PIP). For the missing data, the study has applied the technique of linear imputation (LI). Table 2 describes all the descriptive statistics of the variables.
| Table 2 Descriptive Statistics | ||||||
| Measures | LNCO2 | LNGDP | LNPOV | LNURB | LNREC | LNPOP |
| Mean | 0.0753 | 6.8816 | 3.1667 | 0.0103 | -0.0159 | 5.9463 |
| Median | -0.0158 | 6.8541 | 3.5751 | 0.0113 | -0.0145 | 5.9619 |
| Maximum | 0.5853 | 7.5726 | 3.8628 | 0.0129 | 0.0163 | 6.1424 |
| Minimum | -0.3811 | 6.2707 | 0 | 0.0077 | -0.0533 | 5.7003 |
| Std. Dev. | 0.3242 | 0.4055 | 0.9869 | 0.0018 | 0.0167 | 0.1351 |
| Skewness | 0.2082 | 1667 | -2.3314 | -0.4516 | -0.4044 | -2540 |
| Kurtosis | 1.5964 | 1.7982 | 7.953 | 1.5055 | 2.8296 | 1.8468 |
To assess the long run and short run dynamics of the model, the study has incorporated the unit root test to check the level of stationarity in each series. The previous studies revealed the concept of multiple tests in case of stationarity but in the current study, the most common unit root test i.e. “Augmented Dickey-Fuller” (ADF) along with “Phillips-Perron” (PP) has been used.
For the application of ADF test, the three forms of regression equations are generated:
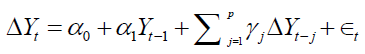
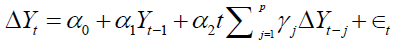 (2)
(2)
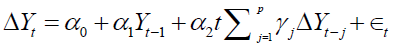 , here €t are white noise error terms.
The hypothesis on which the ADF test based is the following:
H0= Y0 is nonstationary.
H1= Y0 is stationary. And here the p value of the test is comparable for the results of the significance.
Empirical Model
Additionally, we calculated the empirical model following with the equation 1:
 (3)
(3)
Where the dependent variable LnCo2t represents the log form of CO2 emissions per capita and the independent variables that is: LnPOVt represents log form of poverty head count ratio, LnINEt represents the ginni coefficient measure of income inequality, LnPOPt signifies the population density, LnEGt epitomize the logarithm form of GDP per capita, LnRECt denotes the log form of renewable energy consumption, LnURBt indicates the urbanisation. In addition, small t represents the time period in terms of years, βi is the intercept and βis are the variable coefficients and ET denotes the error term and residual in equation 3.
Equation 3 can be written in the auto regressive distributed lag (ARDL) framework as follows:
 (4)
(4)
The ARDL model has some advantages over the other traditional cointegration methods as it can be used with the variables that are I(0) or I(1) of mixed of I(0) and I(1). The test is more efficient in small or finite sample data.
In line with the previous studies by Baloch et al. (2018), Khemili and Belloumi (2018), and Lau et al. (2014), critical value constructed by the Bound Test was adopted to compare the F-statistic to the by Pesaran and Pesaran (1997). It is crucial to remember that there is neither a long-run relationship in the model nor a bottom bound value - I (0) - if the F-statistic value is below it. Nonetheless, the outcome is ambiguous if the F-statistic value falls between I (0) and I (1). To make sure the model was stable and robust enough to generate an unbiased estimate, a diagnostic test was also carried out. This involved utilizing the Jarque-Bera, Breusch-Godfrey LM, and Breusch-Pagan-Godfrey tests, respectively, to examine normalcy, the absence of autocorrelation, and homoscedasticity. If the probability is higher than 0.05, the null hypothesis (H0) should be accepted for all assumptions. Additionally, the CUSUM and CUSUM Square (CUSUMQ) tests were used.
Results and Discussions
Descriptive Statistics
Table 2 presented a summary statistics of variables used in the analysis. The highest mean is of GDP and the lowest for REC. However, the standard deviation of URB was low compared to GDP.
The below table 3 shows that poverty and income inequality are stationary at the level while the rest are not stationary. At first order difference, all variables are stationary which satisfies the condition for applying the ARDL framework.
| Table 3 Unit Root Tests | |||||
| Variables | ADF | PP | Variables | ADF | PP |
| At level | t- stat | t- stat | At first difference | t- stat | t- stat |
| lnCO2 | 0.0951 | 0.0198 | ΔlnCO2 | -4.4321*** | -4.4885*** |
| lnPOV | -3.998*** | 4.1015*** | ΔlnPOV | ---- | ---- |
| lnGINI | -107.83*** | -18.145*** | ΔlnINC | ---- | ---- |
| lnPOP | 0.1289 | -4.8869*** | ΔlnPOP | -2.0749*** | ---- |
| lnGDP | 1.5134 | 3.194 | ΔlnGDP | -4.2192*** | -4.1243*** |
| lnURB | -0.6915 | -0.8181 | ΔlnINF | -3.5093*** | -3.4208*** |
| lnREC | -2.6342 | -2.5208 | ΔlnIND | -7.5664*** | -7.5664*** |
Table 4 indicates the results for optimal lag selection criteria. All the criteria’s under optimal lag selection that is, LR= sequential; modified likelihood ratio, FPF= final prediction error, AIC= akaike information criteria, SC= Schwarz information criterion, HQ= Hannan- Quinn information criterion) provides that lag length of 2 is optimal for the further estimation.
| Table 4 Lag Length Table | ||||||
| Lag | LogL | LR | FPE | AIC | SC | HQ |
| 0 | 539.5563 | NA | 3.82e-27 | -40.96587 | -40.62715 | -40.86833 |
| 1 | 744.8327 | 284.2290 | 2.65e-32 | -52.98713 | -50.27739 | -52.20682 |
| 2 | 831.8753 | 73.65137* | 3.82e-33* | -55.91348* | -50.83271* | -54.45040* |
Table 5 represents the results of the bound test. The null hypothesis is, that there is a non-existence of a long-run relationship. If the F-value falls between the lower bound and upper bound, the result is inconclusive and restricts further analysis. For model 1, the computed F-value (11.71634) lies outside the lower and upper bound values for ten percent, five, and one percent levels of significance, thereby, rejecting the null and supported the existence of a long-run relationship.
| Table 5 Bound Test | ||||
| F-Bounds Test | Null Hypothesis: No levels relationship | |||
| Test Statistic | Value | Signif. | I(0) | I(1) |
| Asymptotic: n=1000 | ||||
| F-statistic | 11.71634 | 10% | 1.99 | 2.94 |
| K | 6 | 5% | 2.27 | 3.28 |
| 2.5% | 2.55 | 3.61 | ||
| 1% | 2.88 | 3.99 | ||
As reported in tables 6 and 7, the results indicate the long-run and short–run impact of economic growth, income inequality, poverty, urbanization, renewable energy consumption, and population on CO2 emissions. From the long-run estimation it can be seen that there exists a positive association between GDP and CO2 emissions with a 1% rise in GDP there is a 2.6% increase in CO2 emissions that reveals the grave situation of rising CO2 emissions which is largely driven by the country's rapid economic expansion, which has led to a higher demand for energy, particularly from non-renewable fossil fuel sources such as coal. This is consistent with the findings of previous studies (Li et al., 2022; Ahmad, 2016; Ohlan, 2015; Ruiz, 2020). Similar findings exist for the short-run impact of GDP on CO2 emissions. The impact of income inequality is statistically significant on CO2 emissions in India. In the short-run there is negative relation between Income inequality and co2 emissions with 1 % increase in income inequality led to 0.35 % decline co2 emissions aligning with findings that suggest a redistribution of wealth could be beneficial for environmental quality (Grunwald, 2017; Liu et al., 2019; Ghazouani & Beldi, 2022; Huang & Duan,2020). While the findings also highlight that co2 emissions and income inequality have positive association (0.15 elasticity) in the long run which is in line with results of existing literature (Mahalik et al., 2018; Mohapatra & Giri,2022; Khan & Yahong, 2022). Overall, the relationship between income inequality and CO2 emissions is dynamic and subject to change over time, with no one-size-fits-all solution for policy implications. The poverty found to be significant in short-run estimation indicating the positive association while in long-run it is insignificant which is in conformity with the finding of Jiang (2021). Also the finding underpin the interesting fact that poverty causes lack of education and poverty induces poor people to use wood for cooking fuel thereby increasing CO2 emissions highlighted in the study by Nabi et al.(2020). Furthermore, urbanization and co2 emissions depict a statistically significant positive relationship in the long-run and short-run (0.34% and 0.72%) as revealed by other studies also (Haldar & Sharma, 2021; Solarin & Lean, 2016; Abbasi, Parveen, et al., 2020; Sikder et al.,2022). The findings also show the negative association between renewable energy consumption and co2 emissions in both the long-run and short-run (0.33% and 0.47%) which is very remarkable for India’s progress toward a green economy (Dong et al., 2017; Khattak et al., 2020; Anandarajah & Gambhir, 2014). The long-run impact of population was found to be non-significant on CO2 emissions on the other hand in the short-run 1 % rise in population leads to 0.13% increase in CO2 emissions which is consistent with existing literature (S. Babbar & R.Babbar,2018; Pachiyappan et al., 2021; Atmanti et al., 2022; Sikdar & Mukhopadhyay, 2017; Gurjar et al., 2016; Rahman, 2020). In addition to that the coefficient of error-correction mechanism (ECM) are negative and significant in the model (-0.36). This value signifies that the GDP, GINI, POV, URB, REC and POP adjust to their equilibrium with the speed of 0.36%.
| Table 6 Long-Run Estimation | |||
| Variables | Coefficient | t-stat | p-value |
| LnGDP | 2.602656 | 1.906968 | 0.0930*** |
| LnGINI | 0.15037 | 2.061639 | 0.0732*** |
| LnPOV | -0.742718 | -4.00435 | 0.1983 |
| LnURB | 0.34996 | -1.984677 | 0.0824*** |
| LnREC | -0.333589 | -3.258709 | 0.0115** |
| LnPOP | -0.10079 | -1.502269 | 0.1714 |
| Table 7 Short-Run Estimation | |||
| Variables | Coefficient | t-stat | p-value |
| COINTEQ01 | -0.361696 | -13.25689 | 0.0000* |
| LnCO2(-1) | -0.469464 | -6.600899 | 0.0002* |
| LnGDP | 1.678545 | 1.067342 | 0.0004 * |
| LnGINI | -0.357768 | -7.636052 | 0.0001* |
| LnPOV | 0.144381 | 5.069288 | 0.0010* |
| LnURB | 0.7291 | -2.878542 | 0.0206** |
| LnREC | -0.478268 | -14.27045 | 0.0000* |
| LnPOP | 0.13676 | 13.98308 | 0.0000* |
| Mean dependent var | 0.035126 | S.D. dependent var | 0.027575 |
| S.E. of regression | 0.006679 | Akaike info criterion | -6.883724 |
| Sum squared resid | 0.000669 | Schwarz criterion | -6.351452 |
| Log likelihood | 100.4884 | Hannan-Quinn criter. | -6.730449 |
The results of the diagnostic tests for serial correlation, Heteroskedasticity, and normality for the model are reported in Table 8. They confirm the absence of serial correlation and heteroscedasticity problems in the model. The result of the Jarque-Bera test of normal distribution shows that the variables are normally distributed.
| Table 8 Results of Diagnostic Test | ||||
| Diagnostic tests | F statistics | P-value | Hypothesis | Result |
| Serial Co-relation | 7.3757 | 0.26 | Null hypothesis: No serial Correlation | No serial correlation |
| (Breush-Godfrey test) | ||||
| Normality test | 2.847 | 0.24 | Null hypothesis: Normal distribution | Normal distribution |
| (Jarque-Bera test) | ||||
| Heteroskedasticity test | 1.6777 | 0.175 | Null hypothesis: Homoskedasticity | No heteroskedasticity |
| (Breusch-Pagan-Godfrey-test) | ||||
The study has also applied stability techniques to check the structural stability of the models. The cumulative sum (CUSUM) and cumulative sum of squares (CUSUMSQ) stability tests presented by Brown et al. (1975), which show that their statistics are significant at the 5% significance level, implying that the coefficients in the models are structurally stable Figure 1.

Figure 1 Structural Stability Tests
Conclusion and Policy Suggestions
The paper aims to investigate the impact of economic growth, income inequality, poverty, urbanization, renewable energy consumption, and population co2 emissions in India using the ARDL framework for the period of post-economic reforms of 1991 (1991-2019). The study comprehensively utilizes these variables to assess the progress of India towards a green economy and various sustainable development goals (SDG). The ARDL bound test result reveals the existence of a long-run relationship among the variables. The finding of the study shows that there is a positive association between GDP and CO2 emissions in the short and long run which indicates the grave situation of rising CO2 emissions which is largely driven by the country's rapid economic expansion, which has led to a higher demand for energy, particularly from non-renewable fossil fuel sources such as coal. However, in the short-run there is negative relation between Income inequality and co2 emissions with 1 % increase in income inequality led to 0.35 % decline co2 emissions aligning with findings that suggest a redistribution of wealth could be beneficial for environmental quality but on the other side in the long-run there is positive impact of income inequality on co2 emissions. The poverty found to be significant in short-run estimation indicating the positive association while in long-run it is insignificant. Furthermore, urbanisation and co2 emissions depict statistically significant positive relationship in long-run and short-run. In the long-run and short-run renewable energy consumption have negative association with co2 emissions which highlight that India is gradually moving towards renewable energy sources. The long-run impact of population found to be non-significant on co2 emissions on the other hand in short-run the expansion in population lead to rise co2 emissions. The study also highlight that in some aspects India is progressing towards green economy and SDG while on some part India is lagging behind.
The study suggests that a persistent population stabilization policy could help in decreasing CO2 emissions and sustaining long term economic growth. The findings stressed the concrete policy actions to utilise the renewable energy sources, and getting acclimatise towards greener technologies to mitigate CO2 emissions without compromising with the pace of economic growth. The study also recognizes the need for policymakers to emphasize more on reducing income inequality and poverty through redistributing transfers, financing universal health and education access, imposing progressive tax laws and upholding the Clean India mission. All of these measures will help to lessen environmental degradation in India. Moreover, government initiatives are needed to help the urban industrial and residential sectors adopt green technology. Hence, it is pertinent to maintain the balance between sustaining economic growth and restoring environment.
References
Adebayo, T. S., Oladipupo, S. D., Adeshola, I., & Rjoub, H. (2022). Wavelet analysis of impact of renewable energy consumption and technological innovation on CO2 emissions: evidence from Portugal. Environmental Science and Pollution Research, 29(16), 23887-23904.
Indexed at, Google Scholar, Cross Ref
Amin, A., Wang, Z., Shah, A. H., & Chandio, A. A. (2023). Exploring the dynamic nexus between renewable energy, poverty alleviation, and environmental pollution: fresh evidence from E-9 countries. Environmental Science and Pollution Research, 30(10), 25773-25791.
Indexed at, Google Scholar, Cross Ref
Anwar, A., Chaudhary, A. R., & Malik, S. (2023). Modeling the macroeconomic determinants of environmental degradation in E‐7 countries: the role of technological innovation and institutional quality. Journal of Public Affairs, 23(1), e2834.
Indexed at, Google Scholar, Cross Ref
Ashenafi, B. B. (2022). Greenhouse gas emission widens income inequality in Africa. Environmental Science and Pollution Research, 29(31), 46691-46707.
Indexed at, Google Scholar, Cross Ref
Aslam, B., Hu, J., Majeed, M. T., Andlib, Z., & Ullah, S. (2021). Asymmetric macroeconomic determinants of CO 2 emission in China and policy approaches. Environmental Science and Pollution Research, 28, 41923-41936.
Indexed at, Google Scholar, Cross Ref
Baloch, M. A., Khan, S. U. D., Ulucak, Z. Ş., & Ahmad, A. (2020). Analyzing the relationship between poverty, income inequality, and CO2 emission in Sub-Saharan African countries. Science of the Total Environment, 740, 139867.
Indexed at, Google Scholar, Cross Ref
Balsalobre-Lorente, D., & Leitão, N. C. (2020). The role of tourism, trade, renewable energy use and carbon dioxide emissions on economic growth: evidence of tourism-led growth hypothesis in EU-28. Environmental Science and Pollution Research, 27(36), 45883-45896.
Indexed at, Google Scholar, Cross Ref
Cao, K., Zhang, W., Liu, S., Huang, B., & Huang, W. (2019). Pareto law-based regional inequality analysis of PM2. 5 air pollution and economic development in China. Journal of environmental management, 252, 109635.
Che, C., Li, S., Yin, Q., Li, Q., Geng, X., & Zheng, H. (2023). Does income inequality have a heterogeneous effect on carbon emissions between developed and developing countries? Evidence from simultaneous quantile regression. Frontiers in Environmental Science, 11, 1271457.
Chen, P. Y., Chen, S. T., Hsu, C. S., & Chen, C. C. (2016). Modeling the global relationships among economic growth, energy consumption and CO2 emissions. Renewable and Sustainable Energy Reviews, 65, 420-431.
Indexed at, Google Scholar, Cross Ref
Dada, J. T., Ajide, F. M., & Arnaut, M. (2023). Income inequality, shadow economy and environmental degradation in Africa: quantile regression via moment’s approach. International Journal of Development Issues, 22(2), 214-240.
Danish. (2020). Moving toward sustainable development: The relationship between water productivity, natural resource rent, international trade, and carbon dioxide emissions. Sustainable Development, 28(4), 540-549.
Dhrifi, A., Jaziri, R., & Alnahdi, S. (2020). Does foreign direct investment and environmental degradation matter for poverty? Evidence from developing countries. Structural Change and Economic Dynamics, 52, 13-21.
Indexed at, Google Scholar, Cross Ref
Dong, K., Dong, X., & Jiang, Q. (2020). How renewable energy consumption lower global CO2 emissions? Evidence from countries with different income levels. The World Economy, 43(6), 1665-1698.
Dong, K., Hochman, G., & Timilsina, G. R. (2020). Do drivers of CO2 emission growth alter overtime and by the stage of economic development?. Energy Policy, 140, 111420.
Farooq, F., Chaudhry, I. S., Yusop, Z., & Habibullah, M. S. (2020). How do globalization and foreign direct investment affect environmental quality in OIC member countries?. Pakistan Journal of Commerce and Social Sciences (PJCSS), 14(2), 551-568.
Farouq, I. S., & Sulong, Z. U. N. A. I. D. A. H. (2023). Macroeconomic Determinants of CO2 emissions: Evidence from selected top African countries. Journal of Sustainability Science and Management, 18(8), 50-73.
Fujii, H., & Managi, S. (2013). Which industry is greener? An empirical study of nine industries in OECD countries. Energy Policy, 57, 381-388.
Indexed at, Google Scholar, Cross Ref
Gassebner, M., Gaston, N., & Lamla, M. J. (2008). Relief for the environment? The importance of an increasingly unimportant industrial sector. Economic Inquiry, 46(2), 160-178.
George, A. S. (2023). Evaluating India's economic growth: challenges and opportunities on the path to 5 trillion dollars. Partners Universal International Innovation Journal, 1(6), 85-109.
Grossman, G. M., & Krueger, A. B. (1995). Economic growth and the environment. The quarterly journal of economics, 110(2), 353-377.
Guo, M., Nowakowska-Grunt, J., Gorbanyov, V., & Egorova, M. (2020). Green technology and sustainable development: Assessment and green growth frameworks. Sustainability, 12(16), 6571.
Indexed at, Google Scholar, Cross Ref
Hafeez, M., Chunhui, Y., Strohmaier, D., Ahmed, M., & Jie, L. (2018). Does finance affect environmental degradation: evidence from One Belt and One Road Initiative region?. Environmental Science and Pollution Research, 25, 9579-9592.
Hafeez, M., Yuan, C., Yuan, Q., Zhuo, Z., Stromaier, D., & Sultan Musaad O, A. (2019). A global prospective of environmental degradations: economy and finance. Environmental Science and Pollution Research, 26, 25898-25915.
Han, J., Du, T., Zhang, C., & Qian, X. (2018). Correlation analysis of CO2 emissions, material stocks and economic growth nexus: evidence from Chinese provinces. Journal of Cleaner Production, 180, 395-406.
Heerink, N., Mulatu, A., & Bulte, E. (2001). Income inequality and the environment: aggregation bias in environmental Kuznets curves. Ecological Economics, 38(3), 359-367.
Indexed at, Google Scholar, Cross Ref
Hundie, S. K. (2021). Income inequality, economic growth and carbon dioxide emissions nexus: empirical evidence from Ethiopia. Environmental Science and Pollution Research, 28(32), 43579-43598.
Indexed at, Google Scholar, Cross Ref
Imran, M., Ali, S., Shahwan, Y., Zhang, J., & Al-Swiety, I. A. (2022). Analyzing the effects of renewable and nonrenewable energy usage and technological innovation on environmental sustainability: evidence from QUAD economies. Sustainability, 14(23), 15552.
Iqbal, S., Wang, Y., Ali, S., Haider, M. A., & Amin, N. (2023). Shifting to a green economy: Asymmetric macroeconomic determinants of renewable energy production in Pakistan. Renewable Energy, 202, 234-241.
Islam, R., & Abdul Ghani, A. B. (2018). Link among energy consumption, carbon dioxide emission, economic growth, population, poverty, and forest area: Evidence from ASEAN country. International Journal of Social Economics, 45(2), 275-285.
Itoo, H. H., & Ali, N. (2023). Analyzing the causal nexus between CO2 emissions and its determinants in India: evidences from ARDL and EKC approach. Management of Environmental Quality: An International Journal, 34(1), 192-213.
Kasperowicz, R. (2015). Economic growth and CO2 emissions: The ECM analysis. Journal of International Studies, 8(3), 91-98.
Kasuga, H., & Takaya, M. (2017). Does inequality affect environmental quality? Evidence from major Japanese cities. Journal of cleaner production, 142, 3689-3701.
Khan, H., Weili, L., Khan, I., & Han, L. (2022). The effect of income inequality and energy consumption on environmental degradation: the role of institutions and financial development in 180 countries of the world. Environmental Science and Pollution Research, 29(14), 20632-20649.
Indexed at, Google Scholar, Cross Ref
Koçak, E., Ulucak, R., Dedeoğlu, M., & Ulucak, Z. Ş. (2019). Is there a trade-off between sustainable society targets in Sub-Saharan Africa?. Sustainable Cities and Society, 51, 101705.
Indexed at, Google Scholar, Cross Ref
Kotowicz, J., Węcel, D., Kwilinski, A., & Brzęczek, M. (2022). Efficiency of the power-to-gas-to-liquid-to-power system based on green methanol. Applied Energy, 314, 118933.
Li, X., Yu, Z., Salman, A., Ali, Q., Hafeez, M. & Aslam, MS. (2021a). The role of financial development indicators in sustainable development-environmental degradation nexus. Environmental Science Pollution Research, 1–12.
Lian, Y., Lin, X., Luo, H., Zhang, J., & Sun, X. (2024). Distribution characteristics and influencing factors of household consumption carbon emissions in China from a spatial perspective. Journal of Environmental Management, 351, 119564.
Indexed at, Google Scholar, Cross Ref
Maji, I. K. (2019). Impact of clean energy and inclusive development on CO2 emissions in sub-Saharan Africa. Journal of Cleaner Production, 240, 118186.
Masron, T. A., & Subramaniam, Y. (2019). Does poverty cause environmental degradation? Evidence from developing countries. Journal of poverty, 23(1), 44-64.
Pata, U. K., Caglar, A. E., Kartal, M. T., & Depren, S. K. (2023). Evaluation of the role of clean energy technologies, human capital, urbanization, and income on the environmental quality in the United States. Journal of Cleaner Production, 402, 136802.
Proskuryakova, L., & Ermolenko, G. (2022). Decarbonization prospects in the commonwealth of independent states. Energies, 15(6), 1987.
Qamruzzaman, M., & Jianguo, W. (2020). The asymmetric relationship between financial development, trade openness, foreign capital flows, and renewable energy consumption: Fresh evidence from panel NARDL investigation. Renewable Energy, 159, 827-842.
Radoine, H., Bajja, S., Chenal, J., & Ahmed, Z. (2022). Impact of urbanization and economic growth on environmental quality in western africa: Do manufacturing activities and renewable energy matter?. Frontiers in Environmental Science, 10, 1012007.
Riti, J. S., Song, D., Shu, Y., & Kamah, M. (2017). Decoupling CO2 emission and economic growth in China: is there consistency in estimation results in analyzing environmental Kuznets curve?. Journal of cleaner production, 166, 1448-1461.
Rybalkin, O., Lavrinenko, O., Ignatjeva, S., & Danileviča, A. (2021). Introduction of EEPSE green economy index for the analysis of regional trends. Entrepreneurship and Sustainability Issues, 9(1), 415.
Sinha, A., Shahbaz, M., & Balsalobre, D. (2017). Exploring the relationship between energy usage segregation and environmental degradation in N-11 countries. Journal of cleaner production, 168, 1217-1229.
Indexed at, Google Scholar, Cross Ref
Sun, J., Guo, X., Wang, Y., Shi, J., Zhou, Y., & Shen, B. (2022). Nexus among energy consumption structure, energy intensity, population density, urbanization, and carbon intensity: a heterogeneous panel evidence considering differences in electrification rates. Environmental Science and Pollution Research, 1-20.
Tereshchenko, E., Happonen, A., Porras, J., & Vaithilingam, C. A. (2023). Green growth, waste management, and environmental impact reduction success cases from small and medium enterprises context: A systematic mapping study. IEEE Access, 11, 56900-56920.
Indexed at, Google Scholar, Cross Ref
Wahab, S., Imran, M., Safi, A., Wahab, Z., & Kirikkaleli, D. (2022). Role of financial stability, technological innovation, and renewable energy in achieving sustainable development goals in BRICS countries. Environmental Science and Pollution Research, 29(32), 48827-48838.
Wang, Z., Meng, J., & Guan, D. (2020). Dynamic driving forces of India's emissions from production and consumption perspectives. Earth's Future, 8(8), e2020EF001485.
Indexed at, Google Scholar, Cross Ref
Wolde-Rufael, Y., & Idowu, S. (2017). Income distribution and CO2 emission: A comparative analysis for China and India. Renewable and Sustainable Energy Reviews, 74, 1336-1345.
Xu, B., Zhong, R., & Qiao, H. (2020). The impact of biofuel consumption on CO2 emissions: A panel data analysis for seven selected G20 countries. Energy & Environment, 31(8), 1498-1514.
Indexed at, Google Scholar, Cross Ref
Yan, J., Dong, Q., Wu, Y., Yang, H., & Liu, X. (2023). The Impact of Urbanization on Carbon Emissions from Perspective of Residential Consumption. Polish Journal of Environmental Studies, 32(3).
Yang, B., Ali, M., Hashmi, S. H., & Shabir, M. (2020). Income inequality and CO2 emissions in developing countries: the moderating role of financial instability. Sustainability, 12(17), 6810.
Indexed at, Google Scholar, Cross Ref
Zaman, K., & Abd-el Moemen, M. (2017). Energy consumption, carbon dioxide emissions and economic development: evaluating alternative and plausible environmental hypothesis for sustainable growth. Renewable and Sustainable Energy Reviews, 74, 1119-1130.
Zhang, C., Zhou, K., Yang, S., & Shao, Z. (2017). On electricity consumption and economic growth in China. Renewable and Sustainable Energy Reviews, 76, 353-368.
Indexed at, Google Scholar, Cross Ref
Zhang, J., & Zhang, Y. (2021). The relationship between China's income inequality and transport infrastructure, economic growth, and carbon emissions. Growth and Change, 52(1), 243-264.
Zhang, J., Ahmad, M., Muhammad, T., Syed, F., Hong, X., & Khan, M. (2023). The impact of the financial industry and globalization on environmental quality. Sustainability, 15(2), 1705.
Zhao, W., Hafeez, M., Maqbool, A., Ullah, S., & Sohail, S. (2021). Analysis of income inequality and environmental pollution in BRICS using fresh asymmetric approach. Environmental Science and Pollution Research, 28, 51199-51209.
Zhao, X., Zhang, X., Li, N., Shao, S., & Geng, Y. (2017). Decoupling economic growth from carbon dioxide emissions in China: a sectoral factor decomposition analysis. Journal of Cleaner Production, 142, 3500-3516.
Received: 20-Dec-2024, Manuscript No. AMSJ-24-15581; Editor assigned: 21-Dec-2024, PreQC No. AMSJ-24-15581(PQ); Reviewed: 08-Jan-2025, QC No. AMSJ-24-15581; Revised: 20-Feb-2025, Manuscript No. AMSJ-24-15581(R); Published: 02-Mar-2025