Research Article: 2022 Vol: 26 Issue: 1S
Impact of Exchange Rate and Inflation Rate on Stock Market Return Volatility In India
Nenavath Sreenu, Maulana Azad National Institute of Technology KS Sekhar Rao, Presidency University
Suresh Naik, Institute of Insurance and Risk Management (IIRM)
Citation Information: Sreenu, N., Rao, K.S.S., & Naik, S. (2022). Impact of exchange rate and inflation rate on stock market return volatility in India. Academy of Marketing Studies Journal, 26(S1), 1-11.
Abstract
Market returns are volatile in India which is caused by various factors. The present research inspects the impact of the currency exchange rate and rate of inflation on volatility in Indian share market returns. The current study used annual inflation and obtained data of currency exchange rate from RBI. The market returns were computed from January 2000 to June 2020 and the data was taken from the Indian stock index. The research used the autoregressive distributed lag (ARDL), co-integration technique and it also used the error correction parameterization of the ARDL model for the investigation of the effect on Indian stock market returns. The study is also used GARCH and the corresponding Error Correction Model (ECM) to explore the long- and short-run relationship between the India stock market returns and exchange rate similarly, the India stock market returns and rate of inflation. The outcome of the research shows that there exist significant long-term relationships only. The outcome also revealed that there is a considerable long-term relationship between NSE returns and the currency rate of exchange. For the short-run the variable is examined is shown the negative effects on the stock market returns. The variables were tested for long memory and it was observed that such property did exist in these variables, making it a desirable feature of which investors can take advantage. This is due to the establishment of the long-run effect of inflation and exchange rate on stock market returns in India.
Keywords
Market Returns, Exchange Rate, Inflation, ARDL and GARCH.
JEL Classifications
G2; G23; F31; C12.
Introduction
The main objective of the study is to examine the effect of macro-economic variables such as the rate of inflation, currency exchange rate on the return of the stock market. The formation of the Indian Stock Exchange (NSE) and Bombay stock exchanges are the recommendations of economic development reforms 1994 and 1875 to create viable economic development. The economic upheaval caused due to the spread of the covid19 over the past few months has adversely affected various segments of the Indian economy, According to RBI report (2016), the GDP growth rate is day by day down falling due to high inflation rate and negative impact on the exchange rate when compared with the USD. It means if the US dollar is stronger than the rupee then it shows that the demand for dollars is more than the demand in Indian Currency.
The paper also inspects the outlook of the rate of inflation during covid19 and the effects of inflation rates on stock market volatility. The curve of inflation shows that the spread of inflation pressures more on food prices, particularly after the COVID-19 outbreak. Before covid19, the inflation rate was under control and in March 2020, the RBI conducted a survey to determine the inflation rate level in essential items and other essential things. In literary the study also discussed the behaviour aspect of the consummation of goods and viability of goods and services, and future inflation settings depend on the expectations of households and firms through price and wage-setting behaviour.
This research paper assesses the continuation of high stock market volatility in India, and the effects of the exchange rate, and inflation on Indian stock market returns. The inconsistent volatility hampers the stock market in satisfying its role of financial resources mobilization from available additional resources units to shortfall units and may cause a financial crisis in India. Stock market volatility is currently very high due to the outbreak of covid19 in India. The paper finds that inflation rate and stock market returns are negatively correlating, while the exchange rate has a positive association with stock market returns, the paper also highlights the important point consequently is, the Indian stock market returns are persistently volatile. The paper finds that the rate of inflation and currency exchange rates are impacting the volatility of Indian market returns considerably. According to Banny, (2000); Boateng, (2004) after his investigations with involvement in the economic activities, an accord emerged that the accomplishment of a vibrant economic enlargement needs a larger role for the stock markets and private sector. He also mentioned that sustainable growth in stock market returns and economic development is significant to the prosperity of governments, institutions and individual investors.
The majority of stakeholders invest in stock markets intending to maximize the profit on investment. Though, these kinds of decisions are taken without considering the effect of macro-economic variables such as exchange rate and inflation which have an impact on stock prices in the market. According to Tabak (2006), the stock market has a vital role to play in the economic development of a nation. He points out that stock markets act as the platform for mobilizing domestic and international level resources for dynamic investments plans. Additionally, also discuss the assessment of the stock market outcomes shown that a significant relationship with the economic development activity. Inflation is the enduring process of the rise in the estimation of the general price which is a general concern to any government. Ibrahim & Agbaje, (2013) Izuchukwu et al. (2015) find that the inflation rate rises despite rigid policies put into effect by the government to control the inflation rates. They also discuss other factors such as income, the nominal wage rate for labour, variance in revenue generation and the payment of loans which can have huge effects on inflation in an economy.
An experimental understanding of this association will help as an appropriate decision-making tool for policymakers and other users in the stock market. The investor usually agrees that the macroeconomic actions have a huge influence on the volatility of the stock prices (Gant, 2006). Macroeconomic assessment can be customary for the stakeholder to estimate the assessment of the stock markets (Talla, 2013). The economic development variables have been shown a negative impact on the development of GDP growth in the short run and positive shown in the long-run period, same as on the stock market returns from the investor behaviour point of view (Kumar, 2013). According to Fisher (1930) has illustrated in his research study that the nominal stock returns are a hedge against inflation, in this connection when it rises in present and future inflation should rise the expected nominal dividend payments also increased. Further, another paper illustrates inflation and expected returns from the stock market.
Gordon (1959) finds that the inflation rate must be calculated by the rate of return which an investor expects to get as a dividend or capital yield on the stock market. Dritsakis (2011) explain the existence of a long-term association between the demand for money, inflation and currency exchange rate. He also revealed that the flexibility of real income is positive when the rate of inflation and exchange rates are pessimistic. Tian & Ma discussed the use of the co-integration ARDL approach to determine the relationship between the yuan rate and the Chinese stock market returns. They find that, positive relationship. Qiao (1997) explored the stock price relationship among Tokyo, Hong Kong, and Singapore and found that, the continuation of a long-term relationship between exchange rate and stock price for three-nation markets. Ozlen & Ergun (2012) investigated macroeconomic variables and stock returns with the help of the autoregressive distributed lag (ARDL) methodology. They found the long-term relationship between the variables which was positively examined the consequences of exchange rate volatility on the stock market, using the data for the period from the year 1995 to 2005. Using GARCH, they find that there existed a negative relationship between the currency exchange rate and stock market returns, based on the literature review to prove the objective of the study framed hypothesis is Macroeconomic variables influence the stock market returns.
Methodology
The research is based on secondary data. Information is obtained from RBI, from January 30, 2010, to June 10, 2020, that contains monthly data for every macroeconomic variable. Share price information was sourced from NSE and BSE.
Explanation of Data
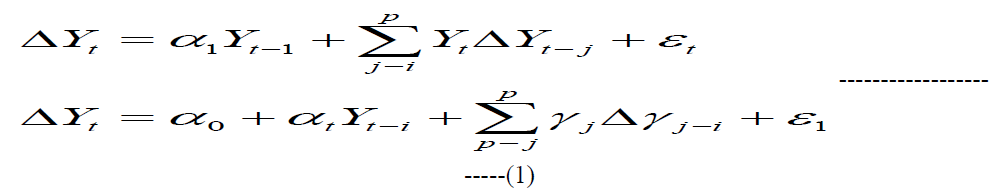
With help of the ARDL methodology the study identified the important macroeconomic variables (returns of the stock market, currency exchange rate and inflation. To find market returns for NSE NIFTY 50and BSE Sensex30 indices, we use the formula Ri = (Pi-Pt-1)/Pi × 100, where Pi is the price of a stock at time i and Pt-1 is the price of a stock at time t-1. Nevertheless, for exchange rates and inflation the study used the original values get from the RBI. Before using the statistical methods, each variable was checked for consistency by using Augmented Dicky Fuller test. Any variable of this study is not stationary is differed, the formula is ΔYt = Yt-Yt−1. All non-stationary dataset variables are differenced until they became stationary.
Unit Root Test
This method is used for the macroeconomic time-series data to determine the data stationary or non-stationary to find the variance and mean values are constant or not during the selected period, the research study used this method to calculate the value of the covariance, the period depended on the gap between the period and not actual periods with comparison this covariance. The time-series data stationarity can be examined by using the ADF test, PP test or KPSS test can be applied as an equivalent of ADF and PP tests. In this paper, the time-series data is used to select macroeconomic variables. This study applies the ARDL. ADF unit root test is used for determining the value. The function of the SDF will generate three regression forms.
ARDL Model to Co-Integration
In determination, ARDL model the best lag length (p) is preferred by using prediction error (PE) criterion, Akaike Information Criterion (AIC), while ensuring that the errors are white sound. After the assessment of the appropriate lag length, the ARDL model can be predictable. Underneath is an explanation of both the simple and generalized forms ARDL model. A simple ARDL Model:  ------------ (2)
From the above equation, the coefficients are interpreted as the long-term effects on the stock market. In an ARDL model, both dependent and independent variables have a lag of one. In long-term symmetry, the study expects that  Based on equation no 2, the paper has drawn the following formula

From the equation no 2 and 3 the study has framed the association between the macroeconomic variables for the long-run reaction to y of an alteration in x is illustrated by the following equation to determine the significant impact on the stock market returns.
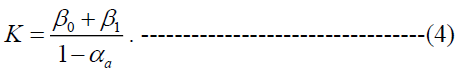
From equation no 4, the paper built the relationship between the ARDL method and the error correction model (ECM), deduct Yt−1 from equation (2) the value has derived  . This value has shown the impact on the stock market returns.

From equation no 5, the value has derived the  and also indicated value is substituted with the
  the outcome the values are based on the above equation, with help of the above substitute values the study has framed the equation no 6 the following

Garch Model Specification
Bollerslev et al., (1994) explained the GARCH and ARCH methods which are the most important instruments for measuring volatility dynamics in the stock market. The GARCH method makes present conditional variance dependent on lags of its preceding variance. One of the disadvantages of this method is that it enforces symmetric results of volatility to both positive and negative volatility in stock market returns in, particularly Indian context.

Based on equation no 7, we can infer that variance is a function of variables with an error term.  is a certain period forward of forecast variance based on precedent information. Indicates that is a constant term;
  that values of w it is determined the volatility from the previous period measured as a lag of squared residual from the mean equation.
  is the forecast variance.
Besides, by accumulation, the lagged  symbol indicated to both sides of the equation and affecting to model can be rewritten as a process for the squared errors:

Where  equation 8 has illustrated the significant effects on the stock values so the determination of the paper has indicated in this research study and the paper has been used the historic time series data sets to analyze the existence of volatility clustering between the stock market returns. Normality in the data was evaluated by stationary using the Augmented Dickey-Fuller (ADF) test.
Data Analysis and Discussions
The information used for the research paper consists of the inflation rate, monthly, daily and monthly exchange rate of Indian Currency and stock market returns. The research paper started with an analysis and discussion of the stationarity of the variables, viz., currency rate of exchange, market returns and inflation. After that the paper has followed the ARDL, GARCH model and error correction model (ECM). This model has been used for the assessment of the short-run and long-term relationship between the selected variables.
The above Table 1 explains the existence of stationarity among the macroeconomic variables, The ?? value of the share market, rate of inflation and exchange rate constant level was more than 0.05, which means, the values indicate significance. Variables negatively affect the overall development of the stakeholder returns. To evaluate the results of the ADF test the hypothesis must be framed. The results accepted the null hypothesis of unit root at a 5% level of significance. Based on the results in the above table above all equations, the study has concluded that the market rate of return is stationary in the study period from January 2000 to June 2020. The return of the Indian Stock market has integrated order zero (I (0)) since stock market returns are stationary without differing.
| Table 1 The Results of the Augmented Dickey-Fuller (ADF) Unit Root Test | ||||
| Variables | Method | Test | Critical value | Significance level (P-value) |
| Stock market returns | Constant | -0.410 | -0.730 | 0.320 |
| Constant+trend | -1.573 | -1.492 | 0.253 | |
| Non | -0.941 | 2.538 | 0.426 | |
| Inflation rate | Constant | 1.639 | -0.495 | 0.638 |
| Constant+trend | -0.381 | -1.730 | 0.052 | |
| Non | 1.462 | -2.749 | 0.206 | |
| Exchange rate (INR) | Constant | -5.720 | -2.859 | 0.005 |
| Constant+trend | -5.620 | -1.603 | 0.031 | |
| Non | -5.371 | -2.592 | 0.002 | |
Table 2 illustrates, the results of ADF tests of stationary for inflation and exchange rate in Indian stock markets, after applying the first difference. The P values indicated that both the variables are not stationary. To determine the significance level, the study used the ordinary differencing test, based on this test, the inflation and the currency exchange rate values were differed because the P values are less than 0.05, so, it can be concluded that the variables are stationary, i.e., after first difference, inflation and rate of exchange became stationary. It means the rate of inflation and currency rate of exchange are both integrated of order one I (1). Pearland has explained that it can be used for co-integration investigation in connection of the repressor is merely (0), and I (1), or both combination of this two-equation (0) and I(1). The outcome of the above table indicates that the returns of the stock markets are integrated of order with above mention equation no I (0) inflation and currency exchange rates are every integrated of order one I (1).
| Table 2 The Results of the ADF Unit Root Test for the Inflation Rate and Exchange Rate (Indian Rupees) AFTER The First Difference (Monthly Data has Taken for this Calculation) | ||||
| Variables | Method | Test | Critical value | Significance level (P-value) |
| Inflation rate | Constant | -3.502 | -3.381 | 0.005 |
| Constant+trend | -3.062 | -1.582 | 0.003 | |
| Non | -3.271 | -0.451 | 0.001 | |
| Exchange rate (Indian Rupees) | Constant | -2.721 | -2.382 | 0.001 |
| Constant+trend | -1.538 | -3.692 | 0.002 | |
| Non | -0.581 | -1.835 | 0.005 | |
The ARDL model is used for the determination of returns of the stock market against the exchange rate and inflation rate. The outcome of the Table 3 shows the association between NSE and BSE returns, exchange rate and inflation rate. The study examines the association between the short term and long-term effects on the stock market return in India. The outcome of the ARDL test for co-integration among the NSE and BSE market returns, inflation, and the exchange rate shows F static is 3.962. the value is above the critical value of 3.629 at the 50.05 significance level. The null hypothesis of co-integrating affiliation can be rejected. This suggests that Indian stock market returns are co-integrated with inflation and exchange rate. The outcome also indicates that there happens a long-term association between the variables.
| Table 3 The Results of the ARDL Method to test the Existing Relationship of Stock Market Returns, Currency Exchange Rate and Rate of Inflation | |
| No. of regressors | Value of statistic, K=2 |
| Computed F-statistic 0.05 level critical value | 3.962 |
| Lower value | 2.461 |
| Upper value | 3.629 |
The study estimates the ARDL values in the long-term coefficient for the method and that ECM also. Table 4 obtains the result of long-run estimated values after applying the ADRL and ECM methods, while the table also obtained the estimated values of ECM. The long-term coefficients and ECM estimates are also indicated in Tables 4 & 5 in the sequence of (0,1,1), which means, the dependent variable is the Indian stock market has a lag 0, while each of the independent variables, viz., exchange rate and inflation rate have a log of 1. The outcome of the long-term relationship among the Indian return of the market, rate of inflation and rate of exchange hurt stock returns in India, correspondingly, the values of macroeconomic variables and variables their P values are less than 0.05. The study finds that inflation and exchange rates have a considerable long-term impact on Indian market returns. The ECM coefficient of −0.0492 (P value = 0.005) is significant. The result of the analysis shows that the rate of inflation has no significant impact on market returns in the short-term., but the exchange rate has an effect on the Indian stock market in the short run.
| Table 4 The Results of Predictable Long-Run Coefficients of ARDL Selected by the Schwarz Bayesian Criterion | ||||
| Regressor | Coefficient | Standard error | T-Ratio | P-value |
| Exchange rate | 0.073 | 0.364 | 1.604 | 0.064 |
| INR | -0.284 | 0.073 | -2.083 | 0.003 |
| Constant | 0.693 | 0.027 | 2.056 | 0.001 |
| Table 5 The Results of the Error Correction Illustration of the Chosen ARDL Model Selected by the Schwarz Bayesian Criterion | ||||
| Regressor | Coefficient | Standard error | T-Ratio | P-value |
| d (Exchange rate) | 0.0492 | 0.0527 | 2.6902 | 0.005 |
| d (inflation rate) | -0.0638 | 0.7362 | -1.0694 | 0.476 |
| ECM (-1) | -0.3751 | 0.0682 | -1.9730 | 0.025 |
Table 6 shows that the estimation of VECM makes it possible to separate the long-term relationship between select economic variables from their short-run responses. The outcome shows that the error correction term VECM (-1) indicated in the equation is accepted statistically at a 5% level of significance. The P > chi2 of the error correction terms inflation rate and exchange rate are about 0.000 and 0.2147 with the expected negative impact on the Indian stock market returns. A significant error term with the right sign shows a strong effect of deviation of market returns from its long-run growth. The value of the coefficient of the error indicated the level of R-sq of adjustment. The coefficient value is indicating the impact level of the stock market 0.0534 and the error correction term shows that about 5.4% of the discrepancies between the exchange rate and inflation rate so in this connection, the stock market volatility has been showing a negative impact on returns of market stakeholder in the selected period of the study. The outcome of the long-run relationship between the Indian stock market returns, select macro-economic variables. Table 6 explored that, the coefficient of inflation and exchange rate harms returns of the stock market, their P - values are less than 0.05. This stock market index has shown a negative relationship with inflation and exchange rate and has an important long-term effect on stock market returns. The P>chi2 of market returns, inflation rate and the exchange rate has indicated insignificant expected inflation rate (P>chi2 = 0.0000) is significant and the research suggests that a reasonable speed of convergence need stability. The outcome from the above table shows that the rate of inflation has no significant impact in the short-term on market returns, while the currency exchange rate has a short-run effect on returns.
| Table 6 The Results of the Vector Error-Correction Model, VEC Market Returns Inflation Rate and Exchange Rate, Trend (Constant) | |||||
| Log likelihood =-1918.199 AIC=27.76318 Det (sigma_ml)=1.75e+08 HQIC=27.91944 SBIC=28.14783 |
|||||
| Equation | Parms | RMSE | R-sq | Chi2 | P>chi2 |
| D_Market returns (India) | 5 | 275.255 | 0.0534 | 6.769968 | 0.2383 |
| D_Inflation rate | 5 | 2.82003 | 0.6012 | 180.8698 | 0.0000 |
| D_exchange rate | 5 | 944.802 | 0.0557 | 7.080683 | 0.2147 |
The result from Table 7 shows that the continuation of cointegration implies a valid assessment of independent variables in long run. The outcome explored in Table 7, chi2 value is 5430.816 and it indicates a significance at 5% level. The Indian market returns include the components of the stock market which are the changes in stock prices measure the constant effects of inflation on returns of the stock market.
| Table 7 Co- Integrating Equations, Integrating for Market Returns in India, Inflation Rate and Exchange Rate | |||
| Equation | Parms | Chi2 | p>chi2 |
| _ce1 | 2 | 5430.816 | 0.0000 |
The outcome of the Johansen co-integration test explored in Tables 8 & 9 shows that both Trace and Maximum Eigenvalues confirm the existence of long-run stability between stock market returns, changes in stock prices due to inflation and exchange rate. Besides, the outcome in Tables 8 & 9 indicate that the coefficient of change in stock market returns due to inflation rate is negative and it is statistically significant (P>|Z| =0.0000), according to Fama (1981). Table 8 shows a positive association between exchange rate and stock volatility in the short run. On the other side, the significance of changes in stock market returns due to the exchange rate is affirmative and has statistical significance in the long run when compared to the USA dollar during covid19. The inflation rates indicate that the investors move stock prices affect the level of stock market returns in India according to changes in expected returns rates. Table 9 shows that a rise in inflation rates drives the investors to increase stock prices and will have a + ve impact on stock markets returns. Furthermore, the positive significance of change the returns in the Indian share market due to the stock exchange rate is emphasized by the efficient level of the variables for the high exchange rate only. The outcome is according to Nissim and Penman (2003) who have indicated in their report, which an affirmative coefficient exists between stock market returns and exchange rates. The present study indicates the existence of a pessimistic relationship between returns from the stock market and inflation.
| Table 8 Beta Coefficients and Standard Errors Johansen Normalization Restriction | ||||||
| beta | Coef. | Std.err | Z | P>|Z| | [95% conf. | Interval |
| _ce1 | ||||||
| Market returns in India | 1 | . | . | . | . | . |
| Inflation rate | -266.1179 | 21.64097 | -12.30 | 0.000 | -308.5335 | -223.7024 |
| Exchange rate | -.2960755 | .0040936 | -72.33 | 0.000 | -.3040988 | -.2880523 |
| _cons | -35.18507 | |||||
| Table 9 Johansen Normalization Restriction Imposed, VEC Rank Market Returns, Inflation Rate and Exchange Rate, Trend (Constant) | |||||
| Trend: constant Sample: 3-240 |
Number of observations=240 Lags=2 |
||||
| Maximum Rank |
Parms | LL | Eigen value | Trace statistic | 5% Critical value |
| 0 | 12 | -1769.3718 | . | 120.0165 | 29.68 |
| 1 | 17 | -1718.1985 | 0.55903 | 17.6699 | 15.41 |
| 2 | 20 | -1711.4591 | 0.10222 | 4.1910 | 3.76 |
| 3 | 21 | -1709.3636 | 0.03297 | ||
Table no 10 illustrated that the volatility of time series of the macroeconomic variables, the variables refer to the conditional variance of the data and the time-varying volatility of stock market returns, the GARCH model has shown the results in table no 10, the exchange rate values in the long run period it has shown very significant impact on the stock market returns, the coefficient value of inflation it has shown a negative impact on the stock market returns. the model of arch and arch (1,1)-M, it is assumed that the effects of negative and positive results on conditional variance are symmetric. Table 10 results explain how inflation affects Stock Market Return with the help of a GARCH model. In the GARCH model variance equation, the selected macroeconomic parameters are significant. In the same order, the ARCH model results have declared that the values negatively affect stock market return volatility. From Table 10 the study has drawn the conclusion and suggestion, the calculation of coefficient is less than 0.005 so the volatility fluctuation is quite constant in the short-run period but in the long run period the values negative effects on the shareholder returns. The coefficient is particularly high for NSE NIFTY 50 among all other indices.
| Table 10 The Results of Arch Regression | |||||||
| Distribution: Gaussian Log likelihood =565.2751 N=240 |
Sample : 2-240 Wald chi2(2)=37521.87 Prob>chi2=0.0000 |
||||||
| Variables | Coef. | OPG Std.Err. |
Z | P>|Z| | [95% conf. | Interval | |
| Marketreturns | -1.096627 | 0.3595004 | -3.05 | 0.002 | -1.801235 | -.3920189 | |
| Inflation rate | 0.2953547 | .0003509 | 841.64 | 0.000 | 0.2946669 | 0.2960425 | |
| Exchange rate | -82.27212 | 11.44803 | -7.19 | 0.000 | -104.7098 | -59.8344 | |
| ARCH Model | |||||||
| ARCH L1. | 1.220681 | 0.2788916 | 4.38 | 0.000 | 0.6740632 | 1.767298 | |
| ARCH L1. | -.0334731 | 0.0553391 | -0.60 | 0.545 | -0.1419357 | 0.0749895 | |
| _cons | 99.81056 | 47.37227 | 2.11 | 0.035 | 6.962612 | 192.6585 | |
Conclusion
The current research has concluded that the importance of the returns of the stock market and inflation and exchange rates affects the stakeholder expected returns. The study used the GARCH and ARDL methods to test the approach to build these relationships among the selected parameters like share market returns, inflation and rate of exchange. The study explores whether there is a continuous positive long-run association among the stock markets, exchange rate and inflation rate in India or not. In the short run, the relationship among the variables shows the existence of a significant impact on stock market returns. The research also explores the presence of a long- and short-term association between the stock markets returns in India, particularly during the period of the covid19 crisis. The ECM for the exchange rate and inflation rate in association with Indian stock market returns. The outcome of this study implies that the exchange rate and inflation rate are very important macroeconomic variables that control the movement of the investment cycle in India.
The selected variables explored the presence of long-term association among them, showing long run dependencies, that provides important information for prospective investors on the Indian share markets (NSE and BSE). The study further highlighted some important points by using statistical methods, such as Johansen co-integration test and VECM. The pragmatic findings make known a significant relationship, in terms of co-integration and causality, between market returns, inflation rate and exchange rate. Hence, increases in the exchange rate (In Indian Currency) drive investors to upsurge stock prices to sojourn in the stock market.
References
Banny, A., & Enlaw, S. (2000) The relationship between Stock Price and Exchange Rate: Empirical Evidence Based on the KLSE Market. Asian Economic Review. 39–49, 2000.
Dritsakis, N. (2011) Demand for money in Hungary: An ARDL Approach, Thessaloniki, Greece, 2011.
Fisher, I. (1930) The Theory of Interest, MacMillan, New York, NY.
Izuchukwu, C.D., Ifurueze, M.S. & Chude, N.P. (2015) Impact of some selected Macro-economic variables on stock market returns in Nigeria. International Journal of Economic and Business review 3(12).