Research Article: 2022 Vol: 21 Issue: 1
Impact of Environmental Structure on the Optimal Exploration-Exploitation
Joonkyum Lee, Sogang University
Gun Jea Yu, Hongik University Seoul Campus
Citation Information: Lee, J., & Yu, G.J. (2022). Impact of environmental structure on the optimal exploration-exploitation. Academy of Strategic Management Journal, 21(1), 1-13.
Abstract
The optimal decision on exploration-exploitation is critical for the success of organizations. The optimal strategy is determined by environmental structures, such as the difference in the success probability between good and bad alternatives, the sparsity of alternatives, as well as the relative value of selecting good alternatives. Nevertheless, the dynamics between different environment structures and the performance of exploration-exploitation strategies have been little explored. We use a simulation experiment based on the multi-armed bandit model to investigate the performance of exploration-exploitation strategies. We find that a high level of exploration is beneficial where success probabilities differ among alternatives and when superior alternatives are sparse. The relative performance gap between the optimal strategy and suboptimal strategies grows as the relative value of superior alternatives grows. We show the underlying mechanism of the pattern of optimal exploration level in different environmental structures.
Keywords
Exploration and Exploitation, Multi-armed Bandit, Simulation, Optimal Decision, Environmental Structure.
Introduction
Since March (1991) introduced the notion of exploitation and exploration in terms of learning, scholars have been sought to understand the optimal balance between the two activities (He & Wong, 2004; Jansen et al., 2009). It is widely accepted that the balance between exploitation and exploration is critical to the survival and prosperity of an organization (Levinthal & March, 1993, Gupta et al., 2006). Organizations that only pursue exploitation without exploration are stuck in suboptimal performance without expanding their knowledge (Levinthal & March, 1993), whereas organizations that pursue exploration without exploitation suffer from the cost of continuous searching without gaining the benefits of exploitation (March, 1991). Thus, organizations need the balance between two conflicting demands of exploration and exploitation to survive longer and to generate high performance (Smith & Tushman, 2005; Venkatraman et al., 2007). However, the understanding of the optimal balance is limited and lack of consensus. Levinthal & March (1993) suggested that resource be invested in exploration while exploitation is kept at minimal yet sufficient level. On the other hand, it might be feasible that resource is invested in exploitation while exploration is kept at minimal yet sufficient level (Lavie et al., 2010).
To resolve the problem of the above disagreement, scholars investigated the impact of factors, such as dynamism, exogenous shocks, and competition (Lavie et al., 2010), on the optimal level of exploration-exploitation. Regarding environmental dynamism and shocks, March (1991) argued that exploration is essential but learning is difficult under environmental changes. Jansen et al. (2006) showed that exploration is beneficial in dynamic environment. Sidhu et al. (2004) also empirically found that higher environmental dynamism is associated with exploration such as the search of new information that reduces managerial uncertainty. On the other hand, researches demonstrated that exploratory activities are damaged under certain environmental turbulences because it undermined the value of existing knowledge and disregarding new knowledge (Posen & Levinthal, 2012). Stieglitz et al. (2016) investigated different dimensions of environmental dynamism and showed that environmental variance benefits exploration but frequency of change harms exploration. Regarding competition, March (1991) argued that exploration is important in competitive environment because increasing the variability of performance is critical. Katila & Shane (2005) also suggested that exploration benefits in competitive environments. However, Jansen et al. (2006) and Uotila (2017) argued that exploitation is more effective in competitive environments because it can increase performance variability.
In an exploration-exploitation problem, an organization faces an environment consisting of a set of alternatives with different expected payoffs, and it needs to explore or exploit to determine good alternatives and to maximize the rewards received. Therefore, searching and learning interact with the environment (Sutton & Barto, 1998). While extant research examines the impact of environmental changes and competition structures as above, the impact of underlying environmental structure has been less explored. The environmental structure is the features of alternatives an organization facing, such as the difference in the success probability between good and bad alternatives, the sparsity of alternatives, as well as the relative value of good alternatives. Even though effectiveness of exploration-exploitation largely depends on the environmental structure, most research on exploration and exploitation has employed specific assumptions concerning the environmental structure and did not examine their impacts extensively. This implies that research results could alter if a different environmental structure is chosen.
Environmental structures typically differ in relation to the characteristics of industries. In the biopharmaceutical industries, organizations typically face a large number of alternatives, and the success probabilities of different alternatives vary a great deal. However, the payoff of a successful new product can be significant. Therefore, finding superior alternatives is critical for success. In commodity production industries, organizations face a limited number of alternatives, and success probabilities might not differ much. The optimal level of exploration and the penalty of not choosing the optimal strategy differ depending on the given industry.
A stream of research has developed to produce technical methods of finding the optimal or approximate solutions to exploration-exploitation balances (Sutton & Barto, 1998). However, the dynamics of different environmental structures, the performance of exploration strategies, and the related managerial implications have not been well explored. Thus, we investigate the impact of environmental structure on the balance of exploration-exploitation to provide the more complete picture of the optimal level of exploration and exploitation.
We investigate the exploration-exploitation problem with the multi-armed bandit model. In the bandit model, an organization facing a set of alternatives (represented as the multiple arms) need to select an alternative for each period. This selection results in success or failure. The probability of success is not known, and each alternative has a different probability. The success probability associated with a particular alternative is drawn from a payoff distribution which represents environmental structures. During the search, the organization obtains a feedback from each selection, and this feedback develops knowledge of the success probabilities of the alternatives. Organizations must balance exploration seeking new knowledge from a potentially better alternative and the exploitation of a current alternative that is known to have superior value (Levinthal & March, 1993). Therefore, environmental structures affect the effectiveness of an exploration-exploitation strategy. We study how differing environmental structures affect the performance of exploration-exploitation strategies.
This paper contributes to the learning and adaptation literature by analyzing the relationship between the environmental structure and the optimal balance in an exploration-exploitation strategy. We find that high levels of exploration are beneficial when the success probabilities among alternatives greatly differ each other and superior alternatives are relatively scare because a high exploration finds superior alternatives often and does not leave them frequently. In addition, the relative performance gap between the optimal strategy and suboptimal strategies is amplified as the relative values of superior alternatives grow because selecting good alternatives is critical.
Model
Simulation models are widely used to analyze organizational learning because such a process is difficult to test empirically (Burton & Obel, 2011). Here, we use the multi-armed bandit model (Robbins, 1952), one of the most commonly used simulation models in the literature, to formally represent the exploration-exploitation problem (March, 2010; Posen & Levinthal, 2012; Uotila, 2017). The multi-armed bandit model is constructed along the analogy of a slot machine environment, where a player needs to choose one of N arms of a slot machine to play within a given period. Each arm provides a reward from a different success probability that is unknown to the player. To maximize the total reward, the player needs to estimate information on the underlying success probability for each arm. An interesting point in this model is that the player can only gather the information from a course of selecting arms. In each such period, the player needs to decide which arm to play and can update the information on the arm, based on the result of the play. Therefore, the bandit model represents the reinforcement learning problem. At each trial, the player faces a tradeoff between exploitation and exploration. The player may wish to exploit the arm with the highest expected reward based on current information, but the problem is set up such that the information that the player has may not be accurate. To increase the accuracy of the information, the player must explore other arms that have been less examined because the reward to be received is probabilistic, but then she must forgo the arm that is known to be the best investigated so far. Thus, the multi-armed bandit model poses a version of the exploration-exploitation dilemma.
In the multi-armed bandit model, the organization faces a sequential choice problem where in each time period t, from 0 to T; it has to choose one of N alternatives. If a choice is successful, the organization receives a reward of 1, and otherwise, the reward is 0. The success probability of each alternative follows a Bernoulli distribution with the success parameters pi, i=1, …, N.
Typically, pi follows a payoff distribution specific to a research paper. For example, Posen & Levinthal (2012) used a beta distribution with the parameters alpha=2 and beta=2. Uotila (2017) used a distribution, where pi=xi10, and xi is a random draw from a uniform distribution, such that only a small number of alternatives have a high success probability. Typically, studies of this type have not explained their reasoning for choosing a specific payoff distribution. This study analyzes the impact of environmental structures, or the features of payoff distribution, on the learning process. Therefore, in this paper, each pi is a draw from a wide range of payoff distributions, including uniform, beta, and exponential distributions, to represent the environmental structure that firms are facing. In this way, we examine how the features of environmental structure affect the efficacy of learning strategies.
The true success probabilities of alternatives are unknown to organizations, although they must nevertheless estimate them based on their trial experience. The estimated success probability is called the belief, and it is refined during each period based on the result of each trial. If a given trial is successful then the belief in that alternative increases, and if a trial is not successful, then the belief in that alternative decreases. The belief about alternative i at time t is denoted by qi,t and Qt=[q1,t,…,qN,t]. We follow the belief-updating methodology used by March (1996): at time t alternative i is selected, then qi,t+1=qi,t+(σ–qi,t)/(ki+1), where σ, the resulting reward, is 1 if the trial is successful and otherwise 0, and ki is the number of trials of alternative i until time t.
The search and learning strategy of an organization is implemented by the level of exploration-exploitation. A high level of exploitation implies the selection of an arm with high belief to obtain an immediate reward. A high level of exploration means selecting an alternative that currently has low belief to enhance belief information and to find a potentially better alternative for later rewards.
To implement the exploration-exploitation strategy, we employ the softmax choice rule (Luce, 1959), which has been widely used in the exploration-exploitation literature (Posen & Levinthal 2012; Vermorel & Mohri 2005). It is also empirically shown that the softmax choice rule is a good approximation to human decisions in learning situations (Daw et al., 2006). There are other rules for choices, but the results are qualitatively the same (Sutton & Barto, 1998). The probability of selecting alternative i is m_i=e^((q_i/(τ/10)))/Σ_(j=1)^N▒e^((q_j/(τ/10))), where τ is the exploration level, which organization selects strategically. A strategy τ near zero means pure exploitation, which is a greedy strategy: choosing the alternative with the highest belief (Auer et al., 2002). The greedy strategy exploits current knowledge but it never explores potentially superior alternative, and therefore it needs adjustments (Brezzi & Lai, 2002). As τ increases or the exploration level increases, the probability of choosing an alternative with a lower belief increases. Still, the choice probability of a higher belief alternative is larger than that of a lower belief alternative. When τ is very large, meaning closer to pure exploration, the choice probabilities for each alternative become equal.
Analysis
We conducted simulation experiments to analyze the optimal balance of exploration-exploitation strategy under different environmental structures, defined by the shapes of a payoff distribution. We used 100 alternatives, similar to Uotila (2017). Before the initial period of experiments, the success probability of each alternative is drawn from a specific payoff distribution for each experiment. In each period, the selected alternative results in success or failure, with the probability of predetermined success probability (the failure probability is calculated as 1– the success probability).
The initial asset is set to zero, and for the performance analysis, we use the accumulated assets in the final period T, set to 1,000 in this study. The initial beliefs across 100 alternatives are identical and set to the mean of the actual payoff distribution in each experiment. The level of exploration in a strategy is identified by τ. We use three levels of strategies: EI=High Exploitation or low exploration (τ=0.1), MD=Moderate Exploration (τ=0.3), and ER=High Exploration (τ=0.5). Note that the objective of our simulation is not to find the exact optimal level of τ for the best performance but to analyze the relative performance pattern of different strategies. Three levels of exploration would be sufficient for that objective. Each strategy in each simulation experiment is run 10,000 times. Therefore, there are 30,000 organizations (10,000 for each of three levels of exploration) seeded in each experiment. Each organization faces alternatives with unique success probabilities drawn from a payoff distribution specific to each experiment.
Value of Exploration-Exploitation Balance
When the level of exploration, as indicated by the parameter τ, is low, the probability of selecting an alternative that shows relatively higher belief is high. As the exploration level increases, the probability of selecting an alternative with a lower belief will increase. For instance, consider five alternatives with beliefs Q=[0,0.25,0.5,0.75, 1]. When τ is 0.1, the choice probabilities are M=[0.00,0.00,0.01,0.08,0.92], but when τ is 0.5, M is [0.06,0.10,0.16,0.26, 0.43]. Therefore, as the exploration level increases, a firm tends to investigate more alternatives currently believed best.
There is a trade-off between exploration and exploitation. Extreme exploitation tends not to investigate potentially better alternatives and so does not generate new knowledge. By contrast, extreme exploration tends not to exploit the best belief alternative and so does not leverage accumulated knowledge. Therefore, a balanced strategy for the best performance is optimal, not an extreme one (Sutton & Barto, 1998). However, the optimal level of balance is dictated by the environmental structure. In this paper, we focus on the impact of the environmental structure on the optimal level of exploitation-exploration.
Impact of the Dispersion of Alternatives
We define the environmental structure as the shape of this payoff distribution and begin the analysis with the dispersion of alternatives which represents the differences in the success probabilities between good and bad alternatives. The dispersion can be defined as the length of the range of the support of payoff distributions, or the difference in success probabilities between the best alternative and the worst alternative. For example, alternatives with success probabilities of [0, 0.5, 1] have a wide dispersion of 1, but alternatives with [0.4,0.5,0.6] have a narrow dispersion of 0.2.
The choice probabilities are affected by the differences among the beliefs across alternatives. When the differences get smaller, a firm tends to explore lower belief alternatives more at a given τ. Following the previous example, when the range of Q is 1 with Q=[0,0.25,0.5 0.75,1], corresponding M is [0.00,0.00,0.01,0.08,0.92] at τ=0.1. However, if the range of Q shrinks to 0.4 with Q=[0.3,0.4,0.5,0.6,0.7], M is [0.01, 0.03,0.09,0.23,0.64]. At τ=0.5, M changes from [0.06,0.10,0.16,0.26,0.43] to [0.13,0.16,0.19,0.23,0.29]. The probability of selecting alternatives with high beliefs decreases as the range of Q decreases. In other words, greediness, or the degree of not selecting the highest belief strategy, grows as the range of Q shrinks.
As the time period increases, the range of Q approaches to that of the payoff distribution because Q is updated to estimate the corresponding payoff distribution. Therefore, the range of payoff distributions has a similar impact on the greediness.
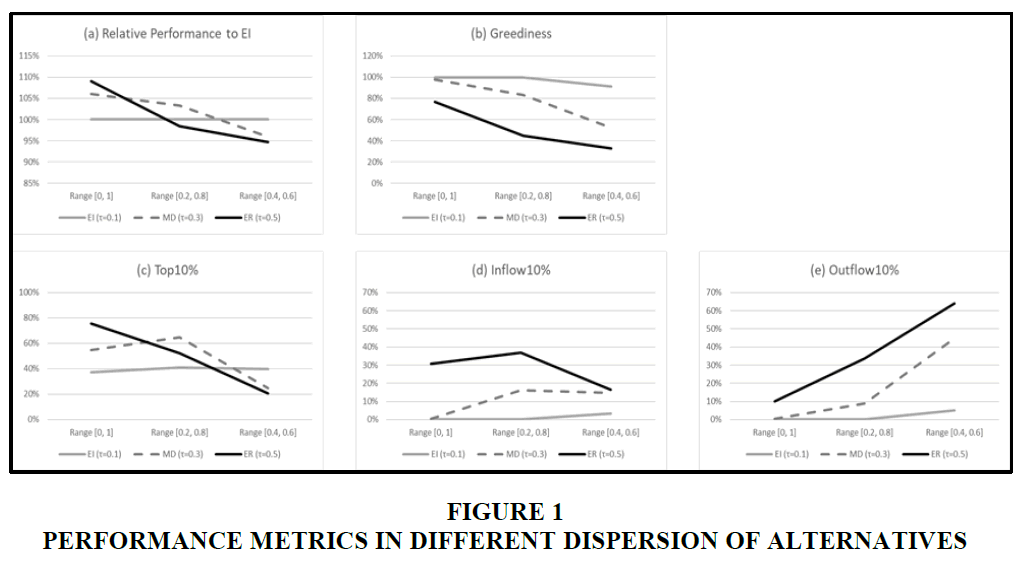
In the first experiment, we examine the impact of the dispersion using uniform distributions with different ranges: [0,1], [0.2,0.8], and [0.4,0.6]. A uniform distribution is widely used in the bandit literature (e.g., Posen & Levinthal, 2012). Figure 1(a) shows the results of relative performances under different dispersions. The performance of a strategy is measured as the accumulated asset stock in the final period, and we calculate the relative percentage of the performance of each strategy relative to the performance of EI. As the dispersion narrows, the best strategy alters from ER through MD to EI. Figure 1(b) shows the implications of the ranges of payoff distributions on the level of greediness. Greediness is calculated as the probability of not selecting alternatives with the highest beliefs averaged across all time periods. In each range, the greediness decreases as exploration level τ increases. Greediness decreases as the dispersion decreases at any τ. As dispersion decreases, the relative distances of success probabilities among alternatives become shorter, resulting in low greediness and an exploration of more alternatives.
To achieve high performance, alternatives must be selected that have high success probabilities. We examine three measures related to this: 1) Top 10% (the proportion of selecting top 10% alternatives in terms of success probability), 2) Inflow 10% (the proportion of selecting non-top 10% alternatives in t and top 10% alternatives in t+1), and 3) Outflow10% (the proportion of selecting top 10% alternatives in t and non-top 10% alternatives in t+1).
Figure 1(d) and (e) shows that Inflow10% and Outflow 10% increase as τ increases in a given range. At a low level of exploration, organizations do not often find good alternatives, but the organization tends to remain with good alternatives once it finds them. However, at a high exploration level, an organization finds good alternatives more often but tends to leave them. The important factor is the changes of Inflow 10% and Outflow 10% according to ranges. At τ=0.5 and range=[0, 1], Inflow 10% of 30.9% is much larger than Outflow 10% of 10.0% resulting in Top 10% of 75.4% in Figure 1(c) which is much larger than Top 10% at τ=0.1 and 0.3. However, at τ=0.5 and range=[0.4, 0.6], Inflow 10% of 16.5% is considerably smaller than Outflow10% of 63.8%. As a result, Top 10% at τ=0.5 is smaller than that at τ=0.1.
In summary, when the dispersion of alternatives is wide, a high exploration strategy is effective because it finds good alternatives often and does not leave them often. However, when the dispersion is narrow, high exploration is less effective because it leaves good alternatives frequently and cannot exploit acquired knowledge.
Impact of the Sparsity of Good Alternatives
The implications of the above simulation are that as the distance of success probabilities among alternatives increases, the level of greediness increases. The distances among good alternatives, or the sparsity of good alternatives, are especially important, as selecting good alternatives is directly related to the performance of a strategy. As good alternatives become sparse, the relative distance among good alternatives in terms of success probability increases. The sparsity of good alternatives can be represented by the shape of the right tail of a payoff distribution. When good alternatives are sparse, the payoff distribution has a long and thin right tail. For example, good alternatives are sparse and the right tail is long with success probabilities of [0,0.1,0.3,0.5, 1], but good alternatives are dense and the right tail is short with [0,0.5,0.7, 0.9, 1]. Note that the two sets of alternatives have the same range of 1.
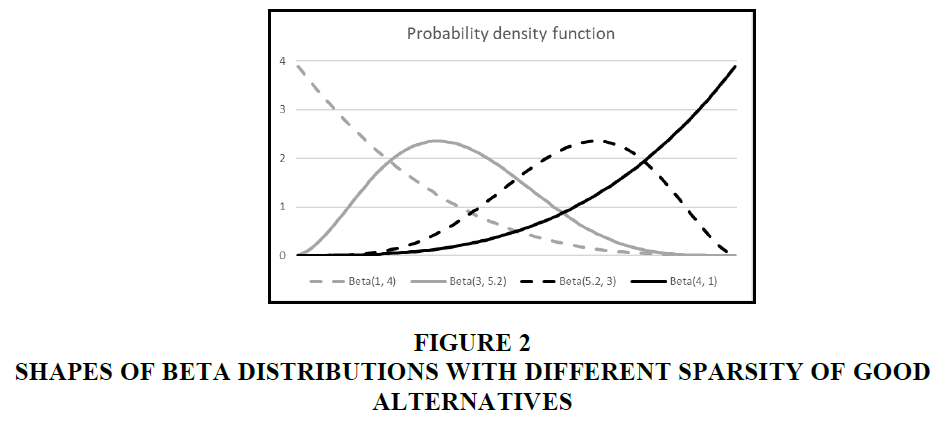
We use beta distributions for the experiment. A beta distribution with parameters alpha=a and beta=b is denoted by Beta (a, b). We examine four beta payoff distributions with different right tail lengths: Beta (1,4), Beta (3,5.2), Beta (5.2,3), and Beta (4,1). The distributions have similar ranges of support about 0.68. Here, we truncate the range to success probability of top 1% alternative - success probability of bottom 1% alternative so that we can more effectively represent the meaningful range. Figure 2 shows the shape of beta distributions. Beta (1,4) has a long right tail, and Beta (3,5.2) and Beta(5.2,3) have moderately long and short right tail respectively. Beta (4, 1) has a short right tail.
The sparsity of good alternatives can be approximately measured by Length 10%= success probability of top 1% alternative - success probability of top 10% alternative, a simple measure that modifies the measure of the heaviness of tails of a distribution in Jordanova & Petkova (2017). The Length 10% of Beta (1,4) is 0.246 whereas Length 10% of Beta (4,1) is 0.024. That means that the distance between top 1% and top 10% alternatives of Beta (1,4) is ten times that of Beta (4,1). Therefore, when the good alternatives are sparse, the distances among good alternatives are long.
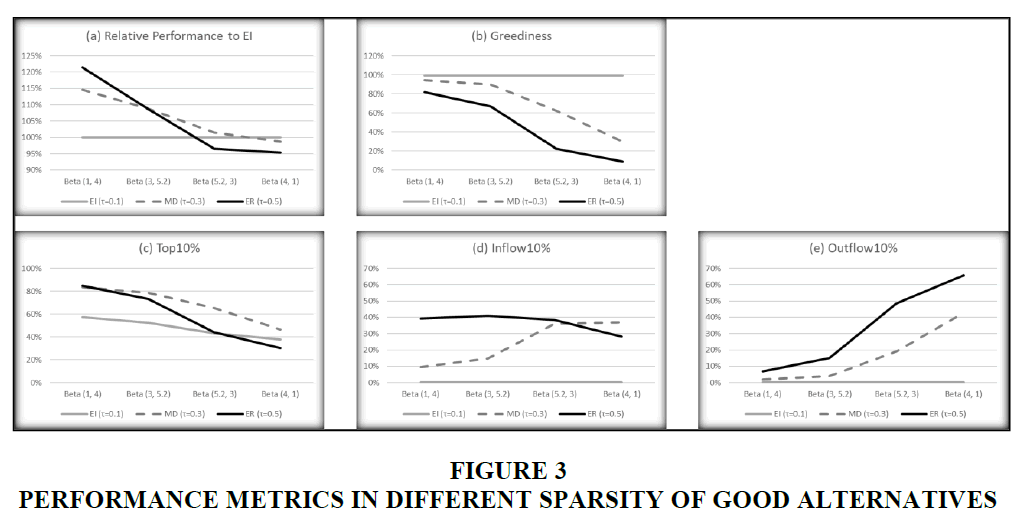
Figure 3 shows the simulation results for the various payoff distributions. As the sparsity of good alternatives decreases, the most effective strategy shifts from ER through MD to EI, and greediness decreases in each strategy. When the right tail is long, the greediness and Top 10% of ER reach 81.6% and 85.0%, respectively, which indicates that ER finds and stays on good alternatives effectively. High Inflow 10% (39.2%) and low Outflow 10% (6.8%) are the main sources of the result. As the right tail shortens, Outflow10% of ER rises significantly, resulting in a sharp drop in the greediness and Top 10% of ER, because it is easy to deviate from good alternatives. On the contrary, the greediness, Inflow 10%, and Outflow 10% of EI do not change much along with the right tail length, which shows that EI is relatively insensitive to the sparsity of good alternatives.
Impact of the Relative Value of Good Alternatives
Beyond the dispersion and the sparsity, the relative value of good alternatives is a vital factor that affects the efficacy of exploration-exploitation. As mentioned, the proportion with which good alternatives are selected is critical for performance. When the values of good alternatives are high relative to average ones, that proportion gets more significant. For example, with success probabilities of [0,0.3,0.6], the best alternative is 2 times better than the average. With success probabilities of [0.4,0.7,1], the best alternative is 1.43 times better than the average. Therefore, selecting good alternatives is more important for the first set. Note that the two sets of alternatives have the same range of 0.6 and the same sparsity of good alternatives.
We measure the relative value for good alternatives using Value 1%= (success probability of top 1% alternative) / mean success probability. When Value 1%=2, the expected payoff from top 1% alternative is twice the mean payoff. When Value 1%=10, selecting a top 1% alternative is 10 times valuable than the mean. Therefore, when Value 1% is large, selecting good alternatives is significantly important.
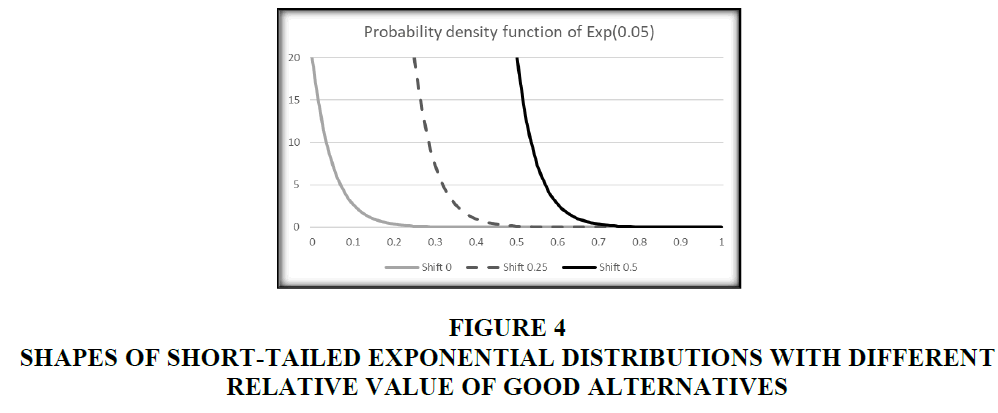
To examine the implications of the relative value of good alternatives, we analyze two sets of simulation experiments. In the first, the success probability of an alternative is drawn from an exponential distribution with mean 0.05 denoted by Exp (0.05) and is then increased by different shift values. We use shift values of 0, 0.25, and 0.5. The success probability exceeding one is truncated to one. In Figure 4, the shapes, ranges, and the lengths of right tails of the distributions are the same, but the distributions with shift values 0.25 and 0.5 are moved to the right side. In this case, the relative distances among alternatives remain the same probabilistically. However, the Value 1%s of the distributions is different: 4.61, 1.60, and 1.33 for shift value of 0, 0.25, and 0.5 respectively. As the distributions move to the right, the relative values of good alternatives decrease.
Figure 4 Shapes of Short-Tailed Exponential Distributions with Different Relative Value of Good Alternatives
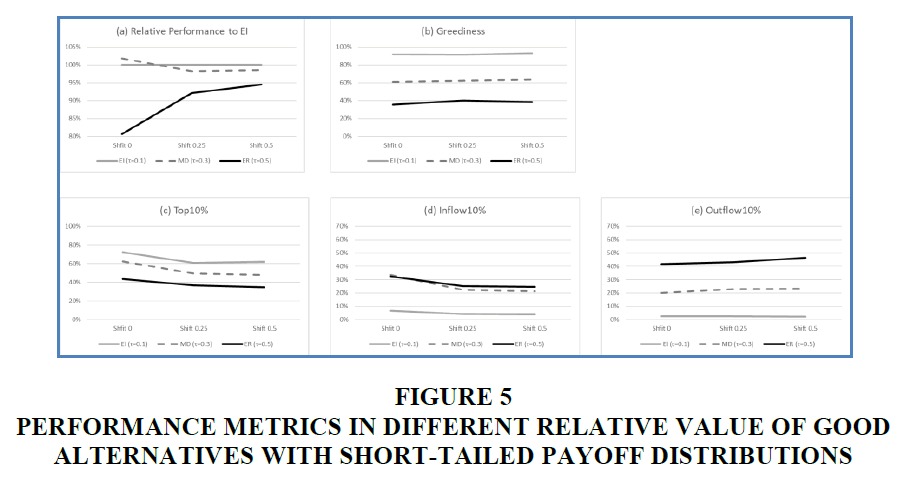
In Figure 5, the greediness, Top 10%, Inflow 10%, and Outflow 10% of each strategy do not change much across shift value. Thus, we can infer that the performance changes mainly result from Value 1%. When the relative values of good alternatives to the mean are large (shift 0), it is critical to select good alternatives but ER does not achieve this. Thus, the relative performance of ER to EI is as low as 80.7%. However, it increases to 94.5% when shift is 0.5 even though the relative Top 10% proportion does not change much. When Value 1% is low, failure to select good alternatives is not penalized much.
Figure 5 Performance Metrics in Different Relative Value of Good Alternatives with Short-Tailed Payoff Distributions
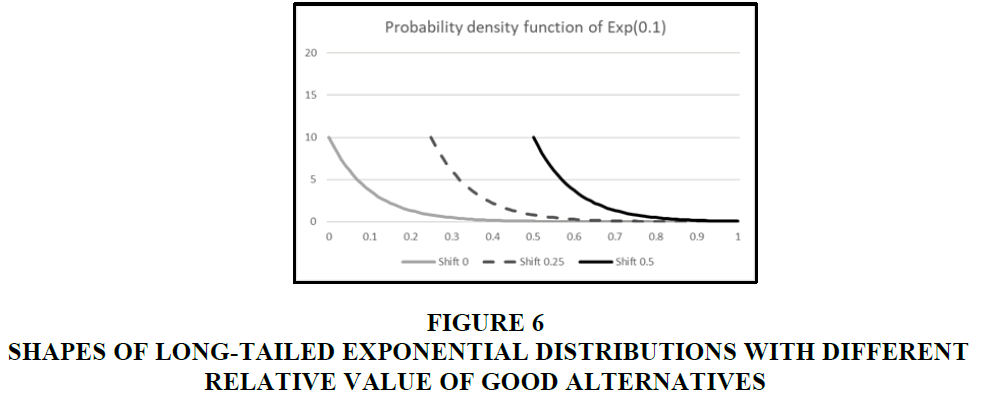
In the second experiment, we use Exp (0.1). Figure 6 illustrates the payoff distributions with three shift values. Exp (0.1) has a longer right tail than Exp (0.05), so it is expected that ER performs better than in the first experiment.
Figure 6 Shapes of Long-Tailed Exponential Distributions with Different Relative Value of Good Alternatives
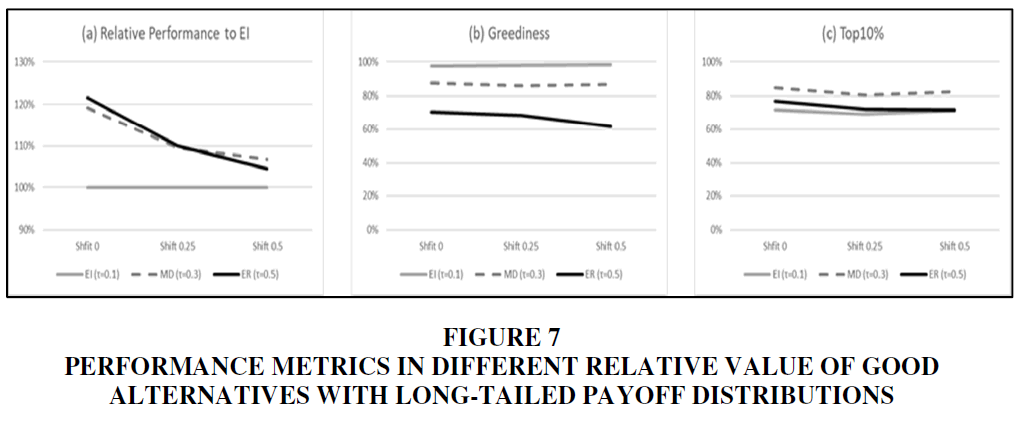
In Figure 7, the greediness and Top 10% do not change as much across the shift value as in the first experiment. This means that the relative proportion of the selection of good alternatives for each strategy change less. However, the relative performance of ER to EI does change a great deal: it is 121.5% under shift 0 but it deceases to 104.6% under shift 0.5. As in the first experiment, the relative performance gap diminishes as the relative value of good alternatives decreases.
Figure 7 Performance Metrics in Different Relative Value of Good Alternatives with Long-Tailed Payoff Distributions
From the two sets of experiments, we conclude that the performance gap among strategies is magnified when the values of good alternatives are larger than those of average alternatives because selecting good alternatives is critical. Therefore, finding an optimal strategy is essential in that environment. However, the relative performance gap among strategies is diminished when good alternatives are not significantly more attractive than the average alternatives
Robustness Analysis
We examine the robustness of our simulation results for the number of periods, the number of alternatives, and the payoff distributions, and we find that the results are qualitatively similar in each case. First, we examine periods of 500 and 2,000 rather than 1,000. Second, we examine 20, 50, and 200 alternatives rather than 100 alternatives. Third, for the dispersion of alternatives, the sparsity of good alternatives, and the relative value of good alternatives, we examine various payoff distributions including 100 beta distributions (alpha and beta parameters from permutations of 0.5,1,2,3,4,5,7,10,15,20), 10 exponential distributions (with parameters from 0.02 to 0.2), and 10 normal distributions (with means from 0.3 to 0.7 and standard deviations from 0.05 to 0.15). All distributions are truncated between 0 and 1 if necessary. The results are robust to these experiments.
Discussion
We investigate the ways in which the environmental structure affects the optimal balance of exploration-exploitation strategies. The exploitation of existing knowledge focuses on certain benefits but forgoes the opportunity of finding potentially better alternatives. By contrast, exploring new knowledge focuses on experimenting potential candidates but forgoes current performance. Due to this tradeoff between exploration and exploitation, maintaining a balance is critical for knowledge teaching (Luger et al., 2018).
Even though the optimal balancing point is determined by the environmental structure, such as in the case of payoff distributions, there has been little research in this area. Using simulation experiments with the multi-armed bandit model, we examined the relationship between environmental structures and the optimal level of exploration-exploitation.
The performance of a learning strategy is directly linked to the rate with which good alternatives are found and remained with, which is determined by the distances among success probabilities of alternatives. When the dispersion of alternatives is narrow, or the best and the worst alternatives do not differ much qualitatively, the choice probability of trying new alternatives is high because the alternatives are relatively similar to each other. Therefore, exploration is costly, as it does not remain on good alternatives after finding them. However, when the dispersion is wide, exploration is beneficial because it remains on good alternatives after finding them. Therefore, it is worth trying many alternatives.
The sparsity of good alternatives is determined by the length of right tail of payoff distributions. When the right tail is long, the distances between good alternatives are large, and the probability of remaining on better alternatives is large. In this case, the benefit of acquiring new knowledge is larger than the cost of not exploiting the best current alternative. Thus, exploration is more effective. However, when good alternatives are not sparse, exploration is more effective.
Another critical factor that affects the performance of the exploration-exploitation strategy is the relative value of good alternatives to others. When the relative value of good alternatives is high, finding and remaining on them is more significant and failure of them leads to a heavy penalty. Accordingly, the relative performance gap between the optimal and a suboptimal strategy is amplified. On the other hand, when the relative value of good alternatives to others is low, the penalty is small, and therefore, the difference among relative performances of varied exploration-exploitation strategies is marginal.
In summary, the optimal level of exploration-exploitation strategy and the relative performance gap among different strategies are determined by the structure of environment, that is, the shape of the payoff distributions. A high level of exploration is more beneficial when the alternatives are widely dispersed in terms of success probabilities and when good alternatives are relatively sparse. The relative performance gap between the optimal strategy and suboptimal strategies becomes magnified as the relative value of good alternatives increases.
The results of this paper entail managerial implications for practice. The structure of the environment differs in various industries. For example, the success rate of new product development in commodity-type productions tends to be relatively high. By contrast, the success rate of new product development in the biopharmaceutical industry is substantially low. Out of about 10,000 candidates for a new drug, typically ten qualify for tests on humans (Stratmann, 2010), and only about one of them were approved for marketing (Thomas, 2016). The overall success rate is only about 0.01%. Companies in the biopharmaceutical industry face a huge number of alternative candidates for new medicines or vaccines, but success probabilities among those candidates differ considerably. In addition, only a very few candidates are highly successful, and their relative value is much higher than the ordinary. Accordingly, the performance gap between the optimal strategy and suboptimal strategies is enormous. This makes it exceptionally important to find the optimal level of knowledge exploration-exploitation for companies in this and similar industries.
Conclusion
This study has also limitations. First, we assume a stable environment. However, environments continue to change and thus are needed to be reflected into simulation models. Therefore, we suggest that one might model a dynamic environmental structure where the number of alternatives and the success probabilities of alternatives change over time. Those changes will erode the value of existing knowledge, which might alter the impact of environmental structures on the optimal level of exploration. Second, the competitive conditions are not considered in this study, but the degree of competition affects the appropriate metric of performance. In a non-competitive game, the average accumulated reward in the final period is used to measure organizational performance. However, in competition for primacy with a large number of competitors, the frequency of winning games determines performance. Therefore, the variability of performance distribution is more important than the average.
References
Luce, R. (1959). Individual choice behavior: A theoretical analysis, Wiley, New York.
March, J.G. (2010). The ambiguities of experience. Cornell University Press.
Robbins, H. (1952). Some aspects of the sequential design of experiments. Bulletin of the American Mathematical Society, 58(5), 527-535.
Stratmann, H.G. (2010). Bad medicine: when medical research goes wrong. Analog Sci Fict Fact, 130(9), 20-30.
Sutton, R.S., & Barto, A.G. (1998). Reinforcement learning: an introduction MIT Press. Cambridge, MA, 22447.
Thomas, D.W., Burns, J., Audette, J., Carroll, A., Dow-Hygelund, C., & Hay, M. (2016). Clinical development success rates 2006–2015. BIO Industry Analysis, 1, 16.
Venkatraman, N., Lee, C.H., & Iyer, B. (2007). Strategic ambidexterity and sales growth: A longitudinal test in the software sector. In Unpublished Manuscript (earlier version presented at the Academy of Management Meetings, 2005).
Vermorel, J., & Mohri, M. (2005). Multi-armed bandit algorithms and empirical evaluation. In European conference on machine learning. Springer, Berlin, Heidelberg, 437-448.
