Research Article: 2019 Vol: 23 Issue: 1
Identification of the Main Risk Factors in Infrastructure Projects of Transporting People on Rail by Public-Private Partnerships
Filipe Quevedo Silva, University Nove de Julho
Ricardo Leonardo Rovai, University Nove de Julho
Márcia de Mello Costa De Liberal, Federal University of São Paulo
Chennyfer Dobbins Abi Rached, University Nove de Julho
Abstract
The traffic jams index in big cities of Brazil grows every year, bringing about economic, environmental and social debt. One way to revert this tendency is by investing in public transport; and aiming at making it viable, the Brazilian government approved in 2004 a Law that regulates Public-Private Partnerships (PPP). Nonetheless, due to the great volume of investment and the long deadlines involved in these projects, one must thoroughly analyze the risk-return relationship for the private partner. This paper has developed an explanatory research, evaluating an in-depth analysis of four studies pertaining to PPP projects in Brazil, identifying the risk factors involved in each one of those.
Keywords
Management, Infrastructure Projects, Transporting People, PPP, Risks.
Introduction
The greater the physical dimensions of a country, the greater the relevance of transport infrastructure in the development and efficiency of its whole economy; that is even more evident in a country of continental dimensions, as is the case of Brazil, (Padula, 2008). Pastori (2007) correlates the stimuli of development and wellbeing in society with the infrastructure enterprises in transport and logistics, which may contribute to the sustainable growth of cities and regions. Looking from another angle, the lack of efficient transport systems, be it for the lack of planning and/or priority of public transport, generate urban chaos and the growth of automobile use, increasing traffic jams and pollution, affecting, in turn, the economy of the country and people (Resende & Souza, 2009; Padula, 2008).
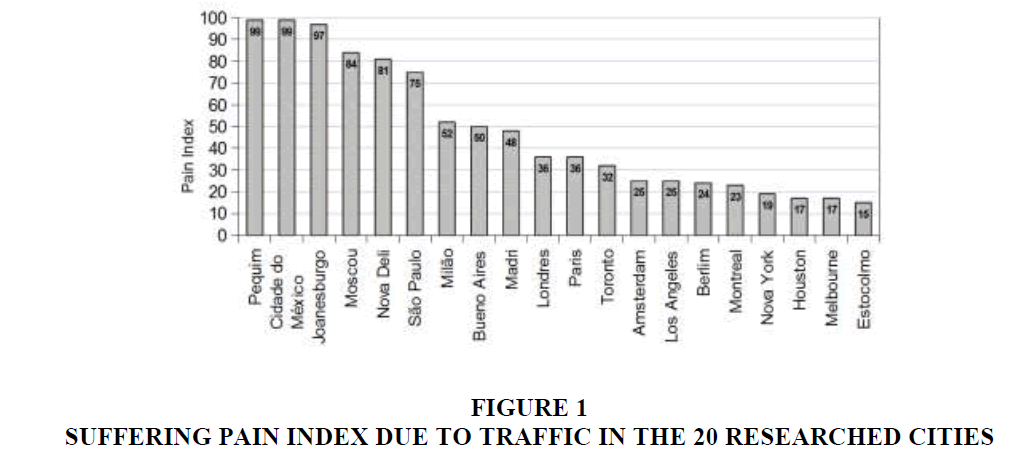
A research made in 2010, which interviewed 8,192 drivers in 20 cities in all continents, including São Paulo, has brought light to the negative effects of traffic jams into health and people’s performance, finding, amongst others, that: i) 57% of the interviewed state that traffic jams have negatively affected their health; ii) 29% of the respondents have associated a negative effect of traffic with their performance, be it studying or working; and iii) 14% of the respondents in the city of São Paulo would work longer hours if the travelling time to work were smaller. The research has also showed that, according to Figure 1, the six cities with the worst results are in developing nations, and that São Paulo is the sixth worst traffic jam recorded in the cities researched (IBM, 2010).
Aiming at making evident the positive aspects for society of investments in public transport, Silva et al. (2012) have calculated prices of the benefits of investment measuring effects of pollution associated to cardiorespiratory diseases in the city of São Paulo. The measurements was performed during the strikes in the metro system in the city, in the years of 2003 and 2006, allowing for the comparison of pollution indexes and deaths by cardiorespiratory diseases in the scenarios with and without operating metro. The research has shown that, on average, without a running metro, the concentration of particulate material has risen 52.5%, increasing the number of deaths by cardiorespiratory problems, priced at US $18.5 billion in 2003 and US $13.3 billion in 2006.
In this same line, Companhia do Metropolitano de São Paulo (Metrô) priced the benefits of its transport links in the metropolitan area of São Paulo, with the objective of quantifying the economy generated with the investments on its system: for the valuing the following variables were taken into account: i) Reduction of travel hours; ii) Fuel consumption; iii) Pollution; iv) Accidents; v) Operational costs of vehicles (automobiles and buses); and vi) Maintenance and operation of bus routes. The results from the benefits reached R $7.2 billion annually for the city and its inhabitants (Metrô, 2012).
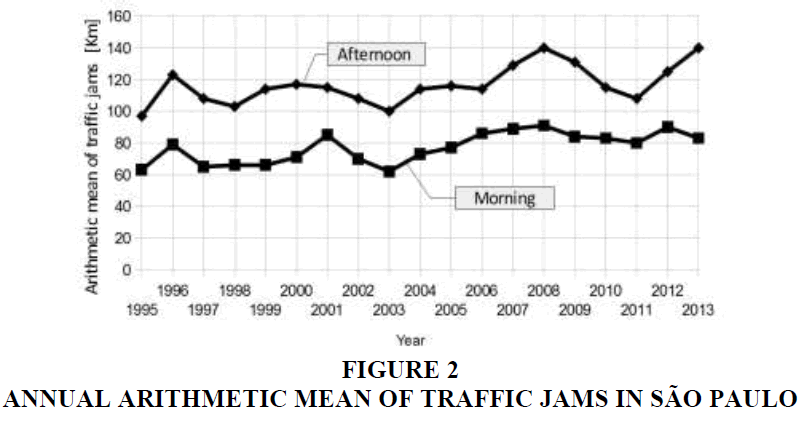
In spite of the proven benefits for society of the investment in public transport, Alvim et al. (2010) state that in the case of enterprises of system to transport people of rail, the rate of construction is not satisfying the necessary demand, which brings about the overload capacity on the current systems, causing a significant increase in the level of traffic jams in the main metropolitan regions of Brazil, as well as serious economic and social debt. These statements are seconded by the research of Resende and Sousa (2009), which between 2005 and 2008 have monitored the traffic jams indices in four big Brazilian capitals: São Paulo; Rio de Janeiro; Belo Horizonte; and Porto Alegre, so that in all of them there was an increase of the indicator at a rate larger than 10% per year, and the evolution itself of the traffic jam indices for São Paulo, measured daily by Companhia de Engenharia de Tráfego (CET), in the morning and in the afternoon, presented in Figure 2. It is important to register that the decrease in traffic jams observed between 2008 and 2011 took place due to severe restrictions imposed on lorries, brought to effect by municipal decree n. 49,487, of May 12th, 2008.
Ways to revert this trend are: i) investment in public transport, in its several kinds (metro, trains, monorail, BRT, busses, among others), so that the choice of model depends on the demand of passengers required by the system, according to Brinco (2012), and the total lifecircle cost of the enterprise; and ii) the use and occupation of land the most rational way.
With the objective of increasing the volume of investments in infrastructure in the country, the federal government has launched in 2004 the Law n. 11,079, also known as Public-Private Partnerships (PPP) (Talamini & Justen, 2005). According to Saraiva (2008), one of the objectives of PPP is to enable investments in infrastructure that were, in principle, not attractive to private companies due to the involved risks. In this same line of thinking, Willoughby (2013) states that the combined action of the public and the private sector may impulse the enterprises in infrastructure, even though, involving great investments and risks.
One key point in PPP are the involved risks for this modality of projects, also considering, as mentioned by Bonomi and Malvessi (2008), that one of the main activities in implementing an enterprise is knowing and dimensioning the risk in order to quantify them and establish instruments of mitigation, so that, the question of research of this paper is: which are the main risk factors in infrastructure projects of transporting people on rail under the modality of PPP? The general objective of this study is, by means of an in-depth analysis, identifying the main risk factors of investing in projects of transport under this modality of contract.
This paper is divided as follows: initially a short conceptual revision of the main theoretical axis of this work is performed, afterwards the methodological procedures, results and discussion are presented, and finally, the conclusions and final considerations of the study.
Literature Review
In this section, the theoretical axes of this study are presented, being: infrastructure projects of transporting passengers on rail; public-private partnerships; and risk management in projects. All of them were obtained through an in-depth analysis and are directed at answering the research question: which are the main risk factors in infrastructure projects on transporting people on rail under the modality of Public-Private Partnerships?
Transport of People on Rail
The investments in infrastructure are thought to supply basic services to the industry and society. They are the main economic inputs, are essential for economic activities and for the growth of the country. However, what is basic, key and essential depends on the referred nation and even its moment and circumstance. Normally, activities considered as infrastructure investment involve: energy; transport; sanitation; telecommunications; and social infrastructure such as: hospitals, prisons, courts, among others (Grimsey & Lewis, 2002).
According to Brandão and Saraiva (2007), some of the peculiarities of infrastructure projects with regards to traditional investment projects are: the great volume of capital involved; the long term maturation time; covering services considered essential for society; and the low liquidity. These enterprises are often classified as megaprojects, according to the typology defined by (Merrow, 2011; Motta, 2013): “The megaprojects, technically called capital projects, are projects of great magnitude, generally complex, and normally defined as enterprises of budget superior to US$ 1 billion”. Brandão and Saraiva (2007) complete: “[…] these characteristics make the projects become strongly affected by political and regulatory considerations, which increase significantly the risk of this investment for the private investor. Therefore, the private investor will make the necessary adjustments to risk […]”.
The characteristic of infrastructure projects being normally complex, quoted by Motta (2013), is in line with the definition of complexity proposed by Baccarini (1996), where complex projects possess several interrelated interdependencies. In this same line of thinking, interrelation of parts, Shenhar and Dvir (2010) use the hierarchy of systems and subsystems to graduate the level of complexity of projects, typifying three different levels of complexity: i) assembly projects, which involve one only component or gadget, or yet a complete set, e.g. set of train brakes; ii) project of systems that deal with whole platforms, e.g. the train; and iii) matrix projects, also known as systems of systems or even program of projects, where several systems work together to reach the same common goal, e.g. a rail line. Thus, one can say that the infrastructure projects of transporting passengers on rail can be classified as complex projects, according to the Baccarini (1996) classification, reaching the higher complexity level in the typology of Shenhar and Dvir (2010).
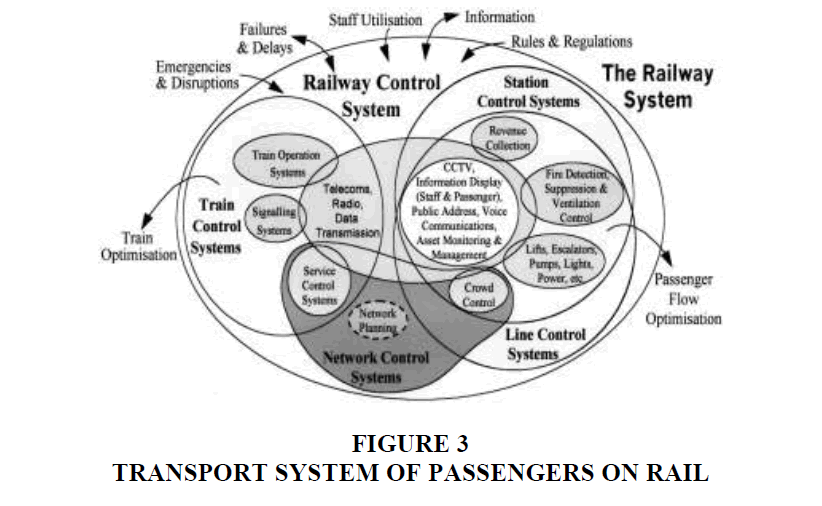
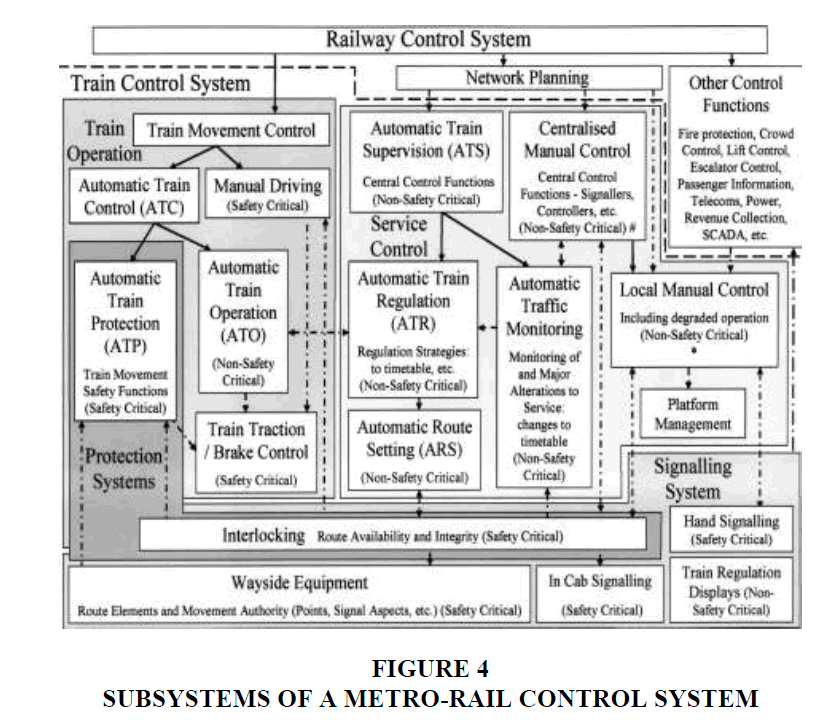
The Figure 3 presents the subsystems of a typical transport of passengers on rail system and its interrelations and the Figure 4 details the typical subsystems of a metro-rail control system.
Basically, the transport systems of passengers on rail are constituted by the following systems: i) Permanent path, the railway, gadgets to change paths, etc.; ii) Rolling material, which are the trains themselves, which, on turn, are formed by various subsystems; iii) Signaling, which is the system that ensures the safe maneuver of trains; iv) Stations for boarding of passengers, formed by several subsystems, such as: blockages, CCTV, escalators, and others; v) Energy feeding for the stations, yards and trains; and vi) Yards, where trained can be stored and maintained.
Public-Private Partnership (PPP)
For Brandão et al. (2012), PPP is a new modality of contract where the risk of the project might be mitigated by forms of governmental support, such as: payment of consideration; demand guarantee; exchange rate guarantee; and return on investment guarantee.
According to Thamer (2013), the basic premises for the framing of a contract in the PPP modality are: i) The contract contemplates the realization of the projects’ construction, financing, operation and transferring of goods to the public power; ii) The duration of the contract must be at least 5 years and at most 35 years, being the minimal value R.20 million; iii) There must exist the possibility of complementing tax revenue collection with public transfer; iv) public payment conditioned to the effective service provision and performance of the private partner, that is, performance indicators are necessary; v) the public payment must be guaranteed by insurance or other forms of guarantee issued by a guarantor fund.
The term PPP has different interpretations, models and functions in different countries where this modality of contract can be found. According to FGV, 2006; Thamer, 2013: “Brazil has opted for a model of PPP based on the legal meaning of concession in the French tradition and in the Anglo-Saxon economic sense”. There are two ongoing models of PPP in the country, being: i) Administrative PPP, where payment is made through public budget, and services destined at the public administration, and ii) Sponsored PPP, where payment takes place via payment of fares accompanied by public budget resources, this model is destined for the users who pay the fares (Thamer, 2013).
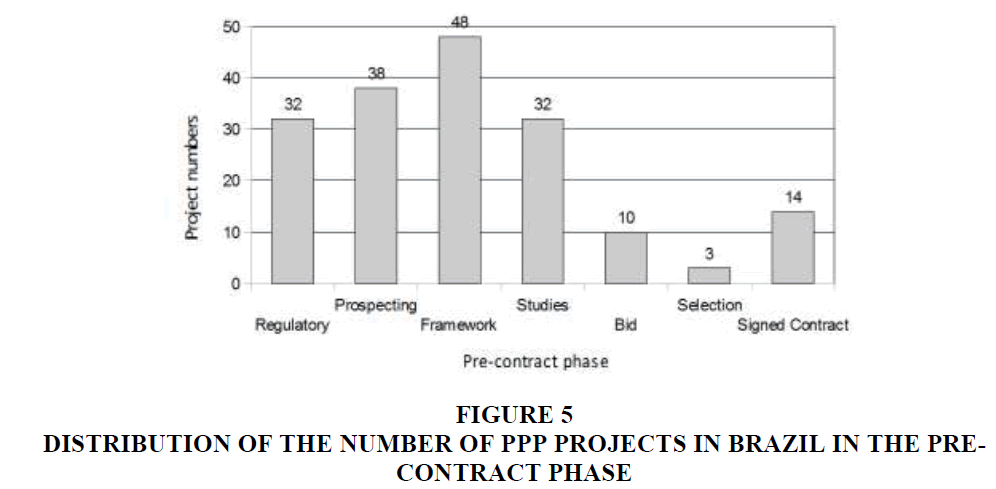
In his research Thamer (2013) identifies 17 Critical Success Factors (CSF) of projects in the modality PPP, being: i) Strong private consortium; ii) Allocation and division of the appropriate risks; iii) Competitive bidding process; iv) Responsibility and commitment from the public and private sectors; v) Study of realistic and extensive cost-benefit; vi) Technical viability of the project; vii) Transparence in the bidding process; viii) Good governance; ix) Favorable regulatory framework; x) Available financial market; xi) Public support; xii) Provision of guarantees by the public power; xiii) Stable macroeconomic environment; xiv) Well-organized public agency; xv) Shared authority between the public and the private sector; xvi) Social support; and xvii) Transparency of technology. The author has also mapped, since the effectiveness of the PPP Law in 2004, projects in Brazil that had some kind of study or modeling in the PPP modality, identifying 177 projects, distributed in 18 states and the Federal District, so that, in only 14 of those (7.91% of the total) obtained success, that is, the contract was signed, in accordance to exposed in Figure 5.
With regards to the risk involved in projects in PPP modality, Nóbrega (2010) quotes that risk sources are factors that might influence the profitability of a infrastructure project.
Risk in Projects
One of the capital activities in the implementation of project finance or of a green field project is knowing and dimensioning the risks of the enterprise and, thereon, aiming at quantifying them to mitigate them effectively (Pollio, 1999; Campos & Gomes, 2005). For these authors, project finance is defined as the implementation of an enterprise based in economic and financial gains of the enterprise via cash flow, as source of repayment of their loans. Already, green field project is a kind of project that is characterized as a completely new enterprise, which is still in the pre-operational development phase.
Nonetheless, only after the publication of the research made by Ibbs and Kwak (2000) did the project management community show concern with the management of risks in projects (Rabechini & Carvalho, 2012). In that research, 38 people from 4 economic sectors were interviewed, and management of risk obtained the worse evaluation in the eight areas of knowledge considered.
Wideman (1992) relates the concept of risk with that of uncertainty, so that, for risks, the probability of the causing event is known, whereas for uncertainty one does not know the probability of occurrence (Perminova et al., 2008); in this sense, risks are events that one might think of as feasible, while uncertainty falls in the realm of unpredictable, that is, that which cannot be foreseen.
For Thamhain (2013), on turn, the risk is the composition of a complex group of variables, parameters and conditions with the potential of impacting adversely on one activity or particular event, such as a project. For the author, the selection of an adequate method of risk management must take place with the understanding that, at least, three groups of interrelated variables affect cost and general capacity of dealing with risk, namely: the degree of uncertainty, the complexity of the project; and the impact.
The risks and opportunities, normally, vary as a function of the kind of project, so that the greater the risk offered by a project, the greater their opportunities (Shenhar & Dvir, 2010). The identification of risk depends on perception, sensitivity, and the moment of the analyst. Therefore, something classified as a risk for one analyst, may not be so by another, or even the original in a different context. Rovai (2005) states that there are two factors that influence the perception of risk: the fear factor, which is how much one fears the impact of potential risk; and the control factor, the point up to which one can control events. That is, there is some subjectivity in the analysis of risk by the decision maker; furthermore, the analysis depends on the area of knowledge in which the analyst acts; so that risks are classified/typified in different ways according to the area. In the project area, normally, risks vary according to characteristics, such as: its nature; its size; its degree of uncertainty; its duration; its complexity; the profile of the involved parts; the degree of aversion to risk of the sponsors, among others (Rovai, 2005).
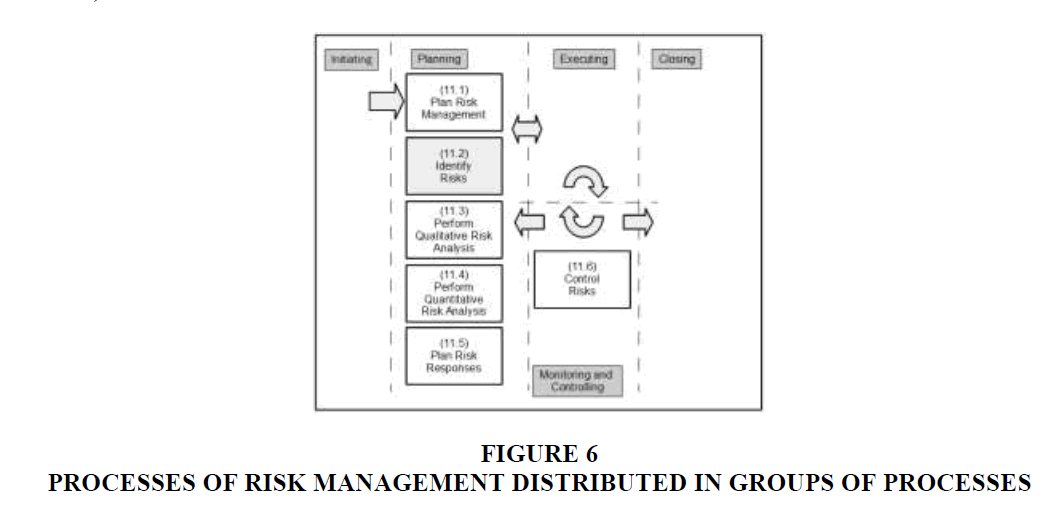
The guide of good practice in project management PMBOK®, compiled by the Project Management Institute (PMI) has six processes for the management of risks in projects, being: i) Planning the management of risks; ii) Identifying the risks; iii) Performing a qualitative analysis of risks; iv) Performing a quantitative analysis of risk; v) planning the response to risk; and vi) Monitoring and controlling risk. As one may observe in Figure 6, the great majority of this processes take place in the phase of planning of a project, that is, before its execution (PMI, 2013).
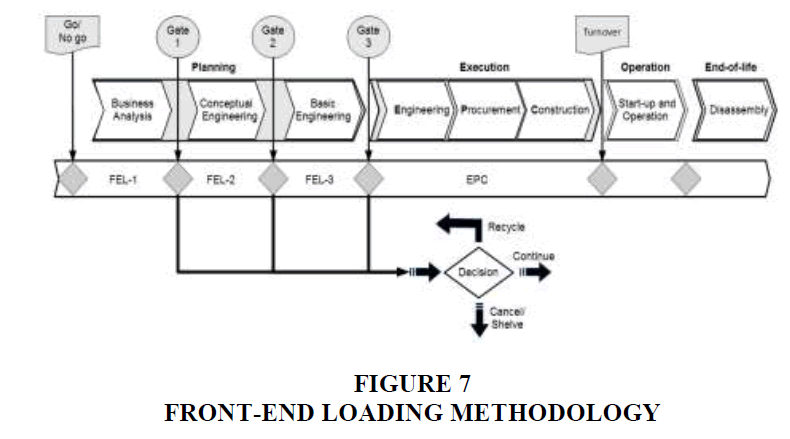
The analysis of risk takes place in an instance prior to the PMI (2013) in Figure 6; in the methodology FEL, the risk analysis already takes place in the phase known as FEL-1, which deals with the business on a macro level. The guide BABOK® IIBA (2011) defines the analysis of business as: “The group of activities and techniques used to serve as connection between the interested parts, with the goal of understanding the structure, policies and operations of an organization and to recommend solutions that allow the organization to reach its goals”.
The methodology of management of mega-enterprises Front-End Loading (FEL), presented schematically in Figure 7, is according to Ribeiro et al. (2013): “[…] it is used in megaprojects, where investments reach high values, with the intention of minimizing the risk of investment in projects of this nature. Normally, it is used in industries such as mining, petrol, energy and in projects of high complexity and excessive costs”.
One of the tasks in phase FEL-1 is the development of a business plan of the opportunities, also known as Business Case: According to PMI (2013), the business case describes the justification for the enterprise in terms of added value as a result of its implementation. Bonomi and Malvessi (2008) present a script for the development of the Business Plan, which, besides several details, must contain a risk analysis.
As presented earlier, depending on the area of analysis, the typifying of risks may vary. Bonomi and Malvessi (2008) present three forms of classification/typification of risks, being:
1. By dividing risks into two groups, namely: i) Systemic or conjuncture risks, which are those that an enterprise is submitted to due to the economic, political or social system; and ii) Own risks, which are risks intrinsic to the activity.
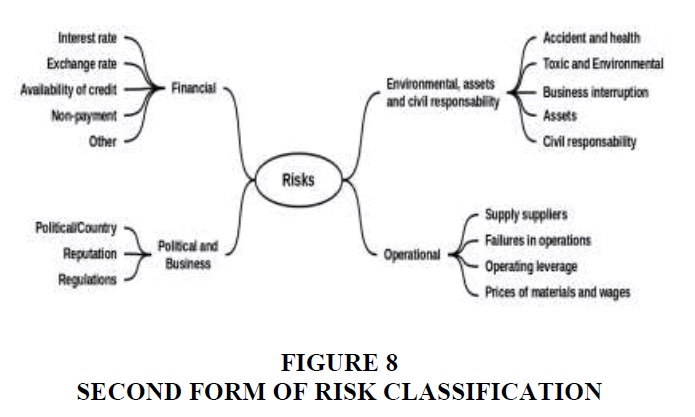
2. By grouping risks into four groups, namely: i) Financial risks; ii) Environmental risks, state risk or risk of civil responsibility; iii) Operational risks; and iv) Political and business risks. These four are subclassified according to Figure 8.
3. By dividing as a function of the mitigation capacity of the risk, which can be divided into three types: i) Strategic risks contractually covered, which are those that can be mitigated by the revision of strategic priorities or by the legal form of contract; ii) Insurable risks, which are those that may be mitigate by insurance coverage; and iii) Risks covered by derivatives, which are those that can be mitigated by use of derivatives.
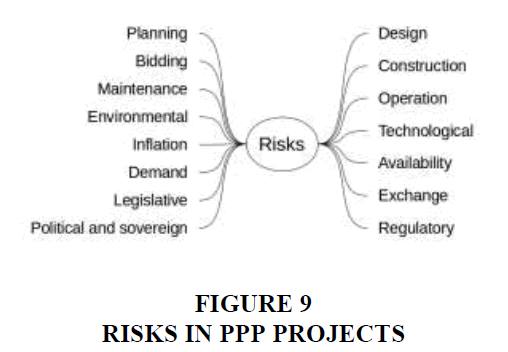
In projects in the PPP modality, Grilo et al. (2004) have indicated the risks presented in Figure 9.
With regards to the quantification of risks, Bonomi and Malvessi (2008) present two methodologies, respectively: i) The one employed by rating agencies, such as Standard & Poor’s, that basically make use of structural analysis, evaluating bonds, companies and even nations; and ii) Through Fischer’s formula, which was originally conceived to quantify inflation risk and that might be employed for a risk/return evaluation of the financial structuring of an enterprise.
Materials And Methods
Due to the general objective of this paper, identifying the main risk factors of investing in infrastructure projects of transporting people on rail in the PPP modality, the research made was explanatory, according to the classification of Gil (2002), allowing for a greater familiarity with the problem in question, in order to make it more explicit. According to (Selltiz et al., 1967; Gil, 2002) normally, an explanatory research involves: an in-depth analysis; interview of experienced personnel; and the analysis of examples that stimulate comprehension. However, this author states that explanatory research, in most cases, takes the form of an in-depth analysis or case studies.
With regards to the design, this research has performed an in-depth analysis of four studies pertaining to PPP projects in Brazil, dealing with the risk in transporting-people-on-rail systems that were selected. These risks were grouped into four categories, according to Campos and Gomes (2005), establishing the most common risks in this contract modality.
Even though passenger-transporting infrastructure projects are essentially for the promotion of development and social well-being, they normally require great capital investment and, nearly always, offer low profitability or a long-term investment return, thus, not always insure satisfying financial attractiveness to private investors, despite its undeniable social and economic reach (Pastori, 2007). Therefore, identifying the risk factors in projects of this nature is fundamentally important for companies that aim to act in this sector. With such information, they may qualify, quantify and mitigate risks involved in order to determine if the risk/return relationship of the enterprise in question is aligned with the company’s investment strategy, helping the decision making process whether or not to participate in the bidding.
Four academic studies were analysed, all dealing with rail transport systems in Brazil, and in each the risks were identified. The following section presents the studied cases:
Public Granting Process of Line 3 of Rio de Janeiro (RJ)
In this study, Campos and Gomes (2005) evaluated and priced the existing risks in the process of public granting of Line 3 of Rio de Janeiro Metro. According to the authors, in this project, the public partner was responsible for the financial intake; the civil construction; the expropriation; the urbanization; the executive/managerial project; the environmental control actions, the restitution, when appropriate, being the deadline of execution 4 years. The private partner, on its turn, was responsible for the implantation of sub-systems; and the acquisition of the trains.
Using a project risk matrix analysis and helped by the Decision Making Tree, a graphical tool that allows for a sensitivity analysis, the quantification and prioritizing of the potential impact of each risk in the projects objectives (Rabechini & Carvalho, 2012), the authors identify three groups of risks: i) Construction risks; ii) Supply risks; and iii) Operation risks. They have quantified the risks of the groups identified, reaching the conclusion that the risk of construction is numerically equal to risk of operation. The supply risk, on its turn, is roughly half the construction/operation risk; and also that the quantifying of the risk decreased by 5% the Internal Rate of Return (IRR) and increased circa 12.5% the projects payback.
The authors highlight that although the construction risk in an onus of the public partner, the private concessionaire may undergo specific risks, such as need for authorizations; lack of public resources; cost overrun (exceeding costs comparing to the projects budget); delays in payments and difficulties in acquiring funding for the corresponding investment.
The risk of operation, on the other hand, were split in costs more elevated than the predicted; smaller demand; insufficient fare for lack of appropriate use; higher degree of gratuity than originally planned; and exchange rate devaluation.
Government Incentives in PPP: An Analysis of Line 4 of São Paulo (SP) Metro
In this study, Brandão et al. (2012) model the government incentives existing in the concession contract over the project’s value, determining the degree of risk reduction obtained and its cost to the public partner. According to the authors, in this project the public partner was responsible for the financial input: of the construction, of stations and of control and command systems. The private commissionaire would provide the necessary intakes for the acquisition of trains and the operation of the system.
The following risks were identified: i) Civil construction; ii) Competition between other transport means; iii) Implantation, operation and maintenance; iv) Exchange rate; and v) Users demand (traffic). In this project, the government was responsible for the risks of construction, being compulsory the indemnity in case of details in launching. The private partner, on turn, is responsible for the risks of implementation, operation and maintenance of the systems’ under its responsibility, including delays in the delivery of equipment and obtaining funding for the investment.
The risks relative to the exchange rate and users demand were shared between partners, so that the authors state that the main uncertainty in this project refers to the number of users that would demand the system.
CPTM Airport Express
In this study, Oliveira and Carvalho (2008) analyzed the project Airport Express from Companhia Paulista de Trens Metropolitanos (CPTM); a train that would connect directly Barra Funda to the International Airport of Guarulhos. The authors evaluate the enterprise, considering a governmental guarantee of 75% of passengers demand and exchange rate.
Brandão and Cury, 2005; Oliveira and Carvalho, 2008 highlight the political and regulatory risks that strongly affect this kind of project, due to the volume of investments and the long maturation deadline. Hence, the governmental guarantees are used to improve the attractiveness of this kind of enterprise.
In this project, the passenger’s estimated demand was calculated by three different companies; they have reached similar values of passengers/day, however, this value was obtained as a percentage of users coming from the airport and there was great difference in the prediction of airport users, as well as in the capitation percentage. Due to these discrepancies, the passengers’ demand was considered an important risk factor for the project; it was model stochastically and a sensitivity analysis using the Decision Making Tree was performed.
The authors’ state that the pricing methodology used in the process of road concession (minimum traffic) is similar to the demand in passengers’ transportation on rail. The conclusion of the study was that, considering the governmental guarantee of demand, there was an increase of 131% in the VPL of the project.
High-Speed Train between SP and RJ
In this study, Massa (2011) had as main goal applying the adequate methodology for quantifying the impact of governmental guarantees in the attractiveness of infrastructure projects of transporting people on rail in the PPP modality for private investors. Charoenpornpattana et al. (2002), Massa (2011) identified the following risks in transport infrastructure projects: i) Prebuilding; ii) Construction; iii) Traffic and revenue; iv) Exchange rate; v) Force majeure; vi) Civil responsibility; vii) Political; and viii) Financial, so that the ones that represent the greatest impact in the success of the projects are: traffic and revenue; exchange rate; political; and financial.
About the project of the high-speed train Campinas/SP/RJ, Massa (2011) states that since the first study performed, the main criticism deals with regards to the viability refers to the premises in users demand.
Results And Discussion
The Table 1 presents the synthesis of the identified risks in the four studies research, and one may note that the demand and exchange rate risk were identified in all studies.
According to Finnerty (1999), Silva & Zotes (2012), the exchange rate risk occurs when the project’s cash flow has two or more different currencies, thus, an expressive variation in the exchange rate in one of the currencies affects the cash flow of the project, possibly causing problems for payment of the existing debt. For the author, the best ways to mitigate these risks are: hedge operations, using forward and future contracts of the currencies present in the contract; and currency swap contracts.
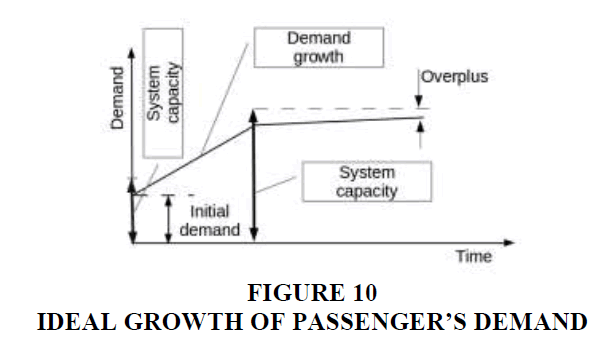
The passengers’ demand risk may be analysed in three moments: i) The initial demand, estimated in the beginning of commercial operations; ii) Demand growth throughout the operation of the system; and iii) Maximum capacity of the system.
1. Initial demand: For Lemes (2005), the prediction of initial demand is made by modeling of the transport system, helped by mathematical computational resources, behavioral resources, among others. According to Souza and D’Agosto (2012) a model traditionally employed for demand prediction in the transport segment is the four stage model: i) Generating trips; ii) Trips distribution; iii) Modal division; and iv) Traffic allocation.
2. Demand’s growth rate: according to the studies presented under 3.2 and 3.3 demand growth is traditionally modeled by Brownian Geometric Equations (BGE).
3. System’s maximum capacity: the maximum capacity of the system is a function of the quantity of passengers supported by the trains and the headways between them; it is normally measured in passengers/hour/route.
Figure 10 illustrates the three moments of passengers demand. In this ideal scenario, demand for initial operation is predicted; it grows up to a point where it stabilizes so that the metro-system is capable of attending to the maximum required demand.
Nonetheless, other scenarios are possible, such as: i) An initial demand substantially different from the predicted; if the demand is lower, it will affect the cash flow of the project; if bigger, it may overload the system, once only the necessary goods (trains and signalling systems) may have been bought; ii) The same way, demand growth very much inferior to the predicted will negatively influence the project’s cash flow, and superior, will cause system overload. This shows the importance of demand prediction in the process of transport systems planning.
Comparing the identified risks in the analysed studies, synthetized in Table 1, to the risks mentioned, one may observe a deep alignment, so that the only risk that appeared in the review and not in Table 1 was the technological risk. This risk may influence principally the third moment of passengers’ demand (capacity saturation, Figure 10) once technology employed is chosen for the signalling and control systems, it affects directly the trains headways, and thus, the system’s capacity. The choice of technology may also influence the system’s accountability, affecting its availability. Except for technological risk, Table 1 answers to the research question of this paper, given that the risk factors in infrastructure projects in transporting people on rail in the PPP modality have been identified.
| TABLE 1: Synthesis Of Identified Risks | |||||
| Risks | Linha 3 | Linha 4 | Expresso Aeroporto | TAV | |
|---|---|---|---|---|---|
| Metr� RJ | Metr� SP | CPTM | SP/RJ | ||
| Construction | Preconstruction | X | |||
| Civil works | X | ||||
| Lack of government resources | X | ||||
| Cost over run | X | ||||
| Disputes between the government and the contractor responsible for the work | X | ||||
| Competition from other means of public transport in town | X | ||||
| Supply | Implantation | X | |||
| Design problems | X | ||||
| Capacities term | X | ||||
| Problems in testing equipment | X | ||||
| Delays in capital injections | X | ||||
| Difficulties in hiring the funding for the corresponding investments | X | ||||
| Operation | Operation | X | |||
| Maintenance | X | ||||
| Cost over run | X | ||||
| Demand smaller than the estimated | X | X | X | X | |
| Insufficient rate because there is no appropriate update | X | X | |||
| Gratuity level higher than originally designed | X | ||||
| Exchange rate devaluation | X | X | X | X | |
| Other | Force majeure | X | |||
| Civil responsability | X | ||||
| Political | X | X | |||
| Regulatory | X | X | |||
The exchange rate risk rises in this kind of project because great part of the equipment employed in the passengers transport rail system is imported, hence the company acquires a debt in foreign currency (normally dollar), while its revenue is in local currency (reais), remaining exposed to exchange rate variation. The way to incentivize the participation of the private sector is by offering more guarantees, particularly in the case of Line 4 of Metro in São Paulo, the government has offered partial guarantees for passengers’ demand and exchange rate risk. The analyses of the cases studied has also shown great similarity between the PPP processes in transporting people on rail and road PPPs.
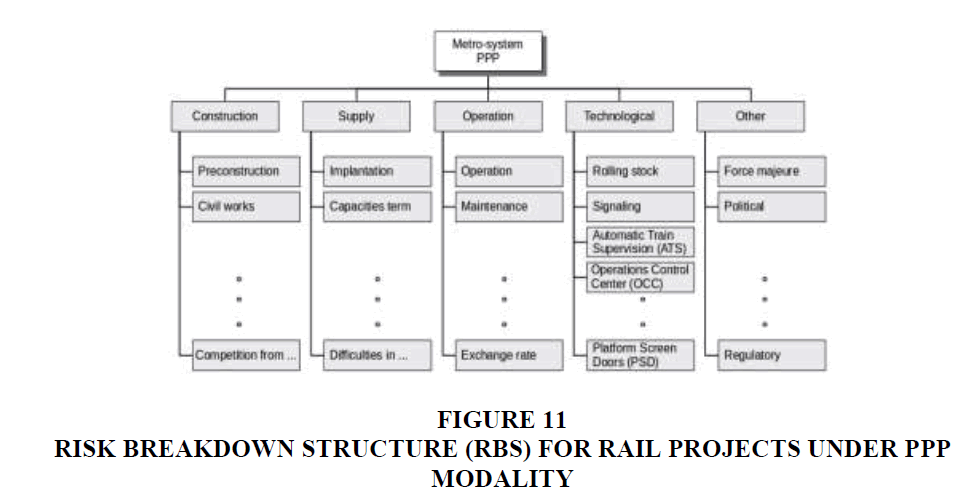
Based in Table 1, Risk Breakdown Structure (RBS), presented in Figure 11, for projects of infrastructure of transporting people on rail in the Private-Public Partnership modality.
Conclusion
The objective of this study was reached, once the risk factors of infrastructure projects of transporting people on rail in the PPP modality were indicated and presented in Table 1, as was proposed a risk breakdown structure in Figure 11.
The identification took place analysing four academic studies on projects of transporting people on rail, where the risks identified were proved, with the exception of the technological risk, which did not appear in any of the four studies researched. This risk must be carefully considered, as it may influence directly the capacity and accountability of the transport system. From all the identified risks, the passengers’ demand risk and the exchange rate risk were common to all cases.
For the exchange rate risk, some possible ways of mitigating are: hedge operations and swap contracts. For the passengers’ contract risk three different moments were perceived, namely: i) initial demand: estimated by predicting models, the four stages being the most common; ii) demand growth: estimated by Brownian Geometric Movement (BGM); and iii) saturation of the system’s capacity: calculated as a function of the train capacity (number of passengers) and the headway.
The similarities between the analysis of PPP projects of transporting people on rail and PPP road projects became evident in the cases studied. Thus, a further analysis of PPP road projects, given that they take place in Brazil for longer. It is also recommended the quantitative and qualitative analysis of the risks identified in this paper, as well as its forms of mitigation; and even, a better detailing of the users’ demand, once this is the main involved risk.
References
- Alvim, B.G., de Bilt, K.V., & Darido, G.B. (2010).Evolution and trends in the implementation and financing of public transportation systems on railways (51). S�o Paulo: Association of Engineers and Architects of-AEAMESP
- Baccarini, D. (1996). The concept of project complexity-A review. International Journal of Project Management, 14(4), 201-204.
- Bonomi, C.A., & Malvessi, O. (2008). Project finance in Brazil: Fundamentals and case studies. Atlas.
- Brand�o, L.E.T., & Saraiva, E.C.G. (2007). Private risk in public infrastructure: A quantitative risk analysis as a modeling tool for contracts. RAP-Revista de Administra��o P�blica. Rio de Janeiro, 41(6), 1035-1067.
- Brand�o, L.E.T., Bastian-Pinto, C., Gomes, L.L., & Salgado, M.S. (2012). Government Incentives in PPP: An analysis by real options. Journal of Business Administration, 52(1), 10-23.
- Brinco, R. (2012). Urban mobility and public transport: On the opportunity to install metro systems. Economic indicators, FEE, 40(1), 105-116.
- Da Silva, C.B.P., Saldiva, P.H.N., Amato-Louren�o, L.F., Rodrigues-Silva, F., & Miraglia, S.G.E.K. (2012). Evaluation of the air quality benefits of the subway system in S�o Paulo, Brazil. Journal of Environmental Management, 101, 191-196.
- De Campos, L.C.S., & Gomes, L.F.A.M. (2005). Risk assessment in urban transport: An application to the Rio de Janeiro subway. Journal of Contemporary Management, 9(1), 103-124.
- De Oliveira, F.N., & de Carvalho, M.M. (2008). Use of real options for pricing of contracts guarantees: The expresso airport case. Journal of Economics and Management, 7(1), 32.
- De Souza, C.D.R. & de D?Agosto, M.A. (2012). Four-step model applied to freight transport planning. Journal of Transport Literature, 7(2), 207-234.
- Gil, A.C. (2002). How to elaborate research projects, (4th ed). S�o Paulo: Atlas.
- Grilo, L., Melhado, S., Silva, S.A.R., Hardcastle, C., & Junior, A.B.P. (2004). The implementation of Public-Private Partnerships as an alternative for the provision of infrastructure and public services in Brazil: Overview.
- Grimsey, D., & Lewis, M.K. (2002). Evaluating the risks of public private partnerships for infrastructure projects. International Journal of Project Management, 20(2), 107-118.
- Ibbs, C.W., & Kwak, Y.H. (2000). Assessing project management maturity. Project Management Journal, 31(1), 32-43.
- IBM (2010). IBM global commuter pain study reveals traffic crisis in key international cities. CTB10.
- IIBA (2011). A guide to the business analysis knowledge body (TM) (Guia BABOK�). IIBA.
- Lemes, D.C.S.S. (2005). Generation and analysis of the future scenario as an instrument of urban planning and transportation. Master Degree Dissertation, Faculty of Civil Engineering, Federal University of Uberl�ndia, Uberl�ndia.
- Massa, A.O.N. (2011). Use of the real option theory for valuing government guarantees in infrastructure projects: an application in the case of the high-speed train between Rio de Janeiro and S�o Paulo. Master's Dissertation in Administration, COPPEAD Institute of Administration, Federal University of Rio de Janeiro, Rio de Janeiro.
- Merrow, E.W. (2011). Industrial megaprojects: Concepts, strategies and practices for success. New Jersey: John Wiley & Sons.
- Metr�. (2012). Sustainability report (managerial). Sao Paulo.
- Motta, O.M. (2013). Study of practices with emphasis on business strategy for the management of megaprojects: the case of the organizations involved with engineering and construction. Master Degree Dissertation in Management Systems, Niter�i.
- N�brega, M. (2010). Risks in infrastructure projects: Contractual incompleteness; public service concessions and PPPs. Brazilian Journal of Public Law, 8(28), 69-92.
- Padula, R. (2008). Infrastructure I: Transport. Brasilia: CONFEA.
- Pastori, A. (2007). PPPs as a Tool to Enable Railway Infrastructure Projects A study to reactivate the Rio-Petr�polis passenger train (Serra Train). Masters Dissertation, UCAM.
- Perminova, O., Gustafsson, M., & Wikstr�m, K. (2008). Defining uncertainty in projects-A new perspective. International Journal of Project Management, 26(1), 73-79.
- PMI. (2013). A guide to the project management body of knowledge: PMBOK guide, (5th ed). Pennsylvania: Project Management Institute, Incorporated.
- Rabechini Jr, R., & de Carvalho, M.M. (2012). Relationship between risk management and project success. Production, (ahead), 12.
- Resende, P.T.V., & Sousa, P.R. (2009). Urban mobility in large Brazilian cities: A study on the impacts of congestion. Simpo-Symposium on Production, Logistics and International Operations Administration.
- Ribeiro, R.L.O., do Valle, A.B., Soares, C.A.P. & dos Santos, J.A.N. (2013). From idea to benefit: Project portfolio management using front end loading, the standard for portfolio management and PRINCE2. International Journal of Management (IJM), 60-68.
- Rovai, R.L. (2005). Structured model for risk management in projects: Multiple case study. Doctoral Thesis, Polytechnic School, University of S�o Paulo, S�o Paulo.
- Saraiva, E.C.G. (2008). Public infrastructure projects: Risk, uncertainty and incentives. Doctorate Thesis in Economics, Getulio Vargas Foundation, Rio de Janeiro.
- Shenhar, A.J., & Dvir, D. (2010). Reinventing project management-The diamond approach to successful growth and innovation. S�o Paulo: Harvard Business School Press-M. Books.
- Silva, J.L.P.D., & Zotes, L.P. (2012). Project Finance: Risks and mitigating factors in structuring projects. In VIII National Congress of Excellence and Management, Rio de Janeiro.
- Talamini, E., & Justen, M.S. (Orgs.) (2005). Public-private partnerships: A multidisciplinary approach. Journal of the Courts.
- Thamer, R. (2013). Public-private partnership projects: Factors that influence the success of these initiatives. Dissertation (Master's) in Administration, Insper-Institute of Education and Research, S�o Paulo.
- Thamhain, H. (2013). Managing risks in complex projects. Project Management Journal, 44(2), 20-35.
- Wideman, R.M. (1992). Project and program risk management: A guide to managing project risks and opportunities. Project Management Institute.
- Willoughby, C. (2013). How much can public private partnership really do for urban transport in developing countries? Research in Transportation Economics, 40(1), 34-55.
