Research Article: 2021 Vol: 25 Issue: 6
How Important A Role does Branding and Packaging Play In the Choices of the Youth
Boopalan Balu, National Institute of Technology, Tiruchirappalli
Rajesh Jayapal, SRM Institute of Science and Technology, Tiruchirappalli
Ramanjaneyulu Mogili, National Institute of Technology, Tiruchirappalli
Citation: Balu., B. & Jayapaul., R. (2021). How important a role does branding and packaging play in the choices of the youth? Academy of Marketing Studies Journal, 25(6), 1-15.
Abstract
Keywords
Branding, Packaging, Consumer, Consumerism, Quality Perception, Buying Behaviour.
Introductions
Attracting consumers into habitual buying of a replaceable product in an oligopoly market is an ardent task for sellers. Along with creating an unforgettable experience of usage and differentiation of similar products from competitors of consequence, they need to create a need in the mind of a buyer to use the same product again and again. For this purpose, a brand would break through the sub-conscious barrier of seller anonymity.
Packaging, on the other hand, will be used to please the senses of a buyer by having an attractive, colourful, novel, and aesthetic appearance. Many researches of the past and present have proven that a certain quality perception leads to a positive affirmation of buying behaviour as an action of the consumer, researched upon accepted by this paper as a linear relationship. Further, a non-convenient sample of the youth market of India was used for data provision in a survey conducted for the purpose of this research.
Through the course of this paper, an overview of the literature review in association with brand equity, brand awareness, quality perception (a part of consumer buying behaviour), brand association and brand loyalty are covered. The research methodology is discussed to give further details like data collection, sample size etc., in the study.
The study used SPSS software for carrying one way ANOVA to deal with the empirical findings of the study. The conclusion and suggestions are provided from the study to identify the gap and enable the future research.
Literature Review
According to Ferrel and Pride (2003), brand equity includes the strength of the brand in market, including propriety brand assets responding to the brand’s marketing and financial values. According to Keller (1993) brand equity is about value added to the products and services over a period. The brand value simply reflects how consumers positively or negatively respond to brand, quality and prices leading to a higher or lower market share and profitability gain for the firm. (Keller, 1993).
Aaker (1991) brand equity is something providing value to the name and symbol of the brand and in-turn providing value to the organization, it also provides value to the consumers. He defined brand equity as an asset and liability aspect associated to the products name and symbol which is having correlation with the benefit added or deprived to its customers.
According to Aaker (1991), brand equity can be defined as ‘a set of brand assets and liabilities linked to the symbol and name of a brand, which is directly correlated to the value added or removed from a product or service.
Positive, client-based brand equity has the ability to lead to higher revenue, lower costs; thus, creating a higher profit for the organization. This has a direct correlation towards the organization’s ability to increase prices, consumer willingness to seek or reject them via various channels of distribution, effective communication between the parties, effective marketing and success of various brand extensions and licensing opportunities.
The Consumer behaviour analysis involves how a consumer, or a group of consumers make buying decisions, purchase, use or throw away products, services, or experience to satisfy their needs, wants and desires (Solomon et al, 2008). A brand is a mix of its name, logo, package design, term, or combination of above all to differentiate its offerings from the competitor and providing a distinctive value to the product.
Malapropism between the terms brand and product is extremely common, but they add two different values into the life of a consumer. McQuiston (2004) defined product as a goods produced in a factory outlet and the final value of any product depends on customer perception and their buying experience to it. He also explained that successful brands have an enduring quality and will be able to sustain for a long time in the market and creating better customer satisfaction than others.
Further, Aaker (1991) claimed that brand equity could be classified into five different levels as brand loyalty, brand awareness, customer perceived quality, brand association elements and finally assets of the brands like patents, trademarks designed to it.
Among the above mentioned five brand equity categories, customers’ choices, and decision-making process, along with reactions to the brand that can be readily adopted by consumers (Barwise, 1993; Yoo et al, 2000. Tong & Hawley (2009) took a quantitative approach to brand equity by linking customer satisfaction to it. Aaker & Joachimsthaler (2000) cited those consumers tend to associate positive attributes to the items that they can recall and informed to them through an effective promotional channel.
Brand associations of a product is highly impacted by the customer perceived quality while buying the goods or services. Customers tend to link the brand association with attributes like images, attributes, symbols, and organizational factors. The brand equity of any successful brands has a strong customer loyalty which increases the customer satisfaction. It also carries a strong brand image among the buyers to carry a distinctive positioning element in the brand.
Aaker (1991) defines brand awareness as the recall value and ability of a consumer to recognize a brand and helps to identify the specific product category by means of quality perception of product or marketing effectiveness of brand. Aaker claims that brand awareness plays the biggest role in influencing a consumer’s buying decision, as he/she would feel more comfortable in making a purchase decision about a product, brand or known brand-associated product of quality. Unknown brands do not create trust in the minds of customers due to seller anonymity.
In finality, consumers who identifies and recalls the brand name are more likely to recognize and make a purchasing decision in favour of the known brand than an unknown brand.
Grewal et. al (1998) opined that consumer decision making process is highly influenced by brand awareness of the buyers. It is also a crucial factor in the buying process of habitual customers behaviour favouring the brand. In certain products, Brand awareness is strongly amalgamated in the consumers' mind to influence their buying behaviour. The benefit of brand awareness is that customers exhibit a greater degree of trust while making their buying decision. Hoyer & Brown, (1990) felt that brand awareness helps to develop a relatively positive opinion about the well-known brand among the consumers. The unknown brands must face an intense competition from the popular and established brands in the market.
According to various authors like Herbig & Milewicz (1993), Janiszewski & Osselaer (2000), Turley & Moore (1995), brand awareness of any buyer is strongly influenced by elements like Brand Name and Logo of the product designed. This mainly helps the buyers to understand the symbolic elements designed in the product and easily helps them to recognize in the market. It also helps the consumers to identify the service providers who distinctively function and offers superior values to them in the buyer's market.
According to Aaker (1991), the brand name is the fundamental element to recognize the distinctiveness of any product offered to the consumers. Moreover, the name of brand is the most important ingredient in raising brand awareness about the brand. Keller (2008) maintains that brand name helps to identify the theme and association of the product in a most simplified manner to its customers. Brand names can be the most important and helps to design the communication elements very effectively in the minds of consumer. Some companies brand name may not have a strong emotional connection with the buyer but still it is captivating and a name that people can remember with ease.
Symbols build brand awareness, hence brand equity in the long run. From the above discussion, we can put forward us,
First hypothesis: Buying behaviour of consumers is dependent on brand awareness.
Quality perception was defined by Zeithaml (1998) as consumer understanding of the product quality and service with respect to its purpose and his/her requirement. Quality perception is a powerful strategic tool, with many organizations using Quality perception statistics to improve the quality of product and service. It helps in understanding majority of consumer requirements and modify product or service in accordance with that. It even helps a company in deciding a pricing strategy, proving to add multi-purpose value to an organization.
An organization which is ambitious about gaining a high market share within their segmented market must take Quality perception of consumers into account, as a bad image and a lack of awareness of product can be mortifying for a brand or brand association. Perceived quality depends on a consumer’s knowledge, previous experience, risk perception etc. It also depends on the current situation and mind-set of a consumer such as purpose of purchase, purchase power etc. (Jacoby & Olson, 1985).
The look, feel, touch and experience of a product plays important roles in building a brand’s quality perception in the minds of consumers. As Ajay and Murthi (2008) claim in their quality perception research, consumers prefer buying from well-known brands due to previous experiences, better marketing and good word-of-mouth, leading to a favourable. Quality perception in the minds of a consumer.
This results in a belief that branded products and aesthetically sound products are qualitatively superior due to the presence of funds being spent on it. They believe that the risk present in an unknown product does not exist in a well-known brand.
Therefore, our second hypothesis can be stated as: Perceived quality based on branding and packaging affect the choices of consumers.
Methodology
The questionnaire was administered using online data collection forms prepared by the utility of Google forms. Age group of consequence sampled in the questionnaire was 15-29. Only those products were considered which are easily replaceable and doesn’t have a lasting impact in the pocket of the consumer.
Products which will be considered for this research was Toothpastes, soaps, cosmetics, stationary, soft drinks. Questions based on their preferences, reasons for preferences, thought process before switching interests between brands, frequency of buying replaceable items, paid price range, importance given to price, significance placed on quality, importance placed on marketing were administered via the online data collection form. Regression analysis, cross-tabulations were majorly will be used to analyse the data.
The data collection lasted thirteen days. The questionnaire was sent to more than two hundred people, out of which response was received from 120 people belonging to the required age group. Anonymity was maintained throughout the process of filling and submitting the questionnaire. A few demographic details such as age (a prerequisite of 15-29 was mentioned) and gender was asked in the questionnaire.
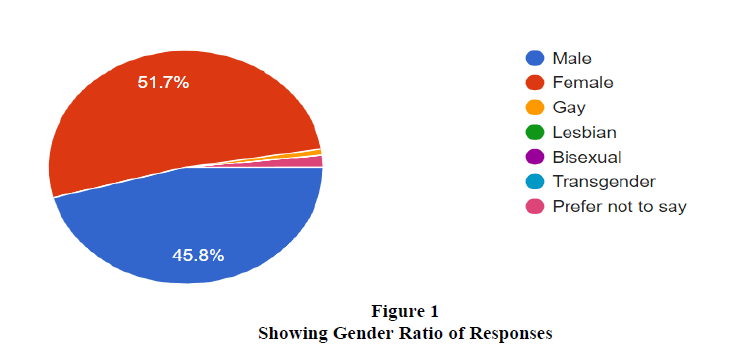
Thirteen Questions based on their buying behaviour was recorded using the responses and spreadsheet option of google forms. Among those who answered the questionnaire, 51.7% were females and 45.8% were males.
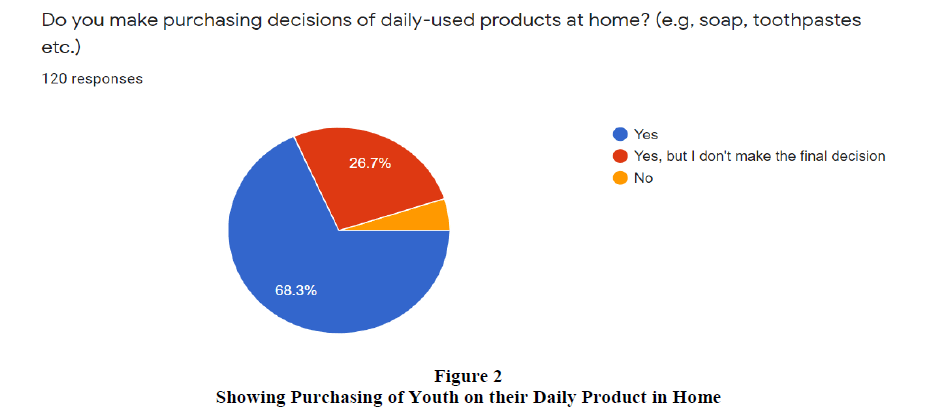
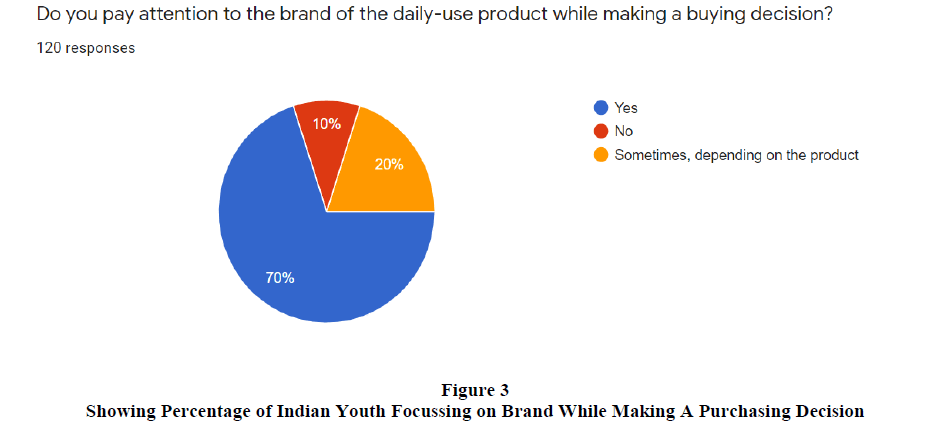
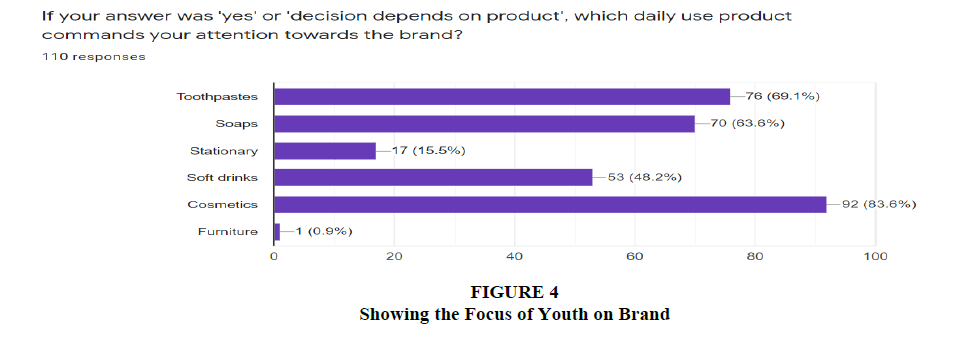
A few questions which were asked were ‘Do you make purchasing decisions of daily-used products at home? (e.g, soap, toothpastes etc.)’ ; ‘Do you pay attention to the brand of the daily-use product while making a buying decision?’; ‘If your answer was 'yes' or 'decision depends on product', which daily use product commands your attention towards the brand?’ etc. Their responses based on packaging influencing their buying decision was also noted and analysed.
The responses can be noted in ‘https://docs.google.com/forms/d/1w9MKlxfO-OUAfJVlmtyLGG4PhwOw0Thqn2gkFELY5uo/edit#responses’ in Figure 1.
Data Analysis and Findings
As stated above, the gender ratio of responses is as mentioned in the graph.
Percentage of youth making purchasing decisions at home is as mentioned below in Figure 2.
The above results show that majority (68.3%) of Indian Youth do have purchasing power in their families, irrespective of financial independence.
Those who don’t make a final decision alone would make if after consultation with their families in Tables 1 and 2.
| Table 1 ANOVA Single Factor: Purchasing Decision |
|||||
| Groups | Count | Sum | Average | Variance | Standard Deviation |
|---|---|---|---|---|---|
| Female Purchasing Decision | 53 | 133 | 2.509434 | 0.408563 | 0.639189436 |
| Male Purchasing Decision | 54 | 144 | 2.666667 | 0.339623 | 0.582771517 |
| Table 2 ANOVA on Purchasing Decision |
||||||
| Source of Variation | SS | df | MS | F | p-Value | F crit |
|---|---|---|---|---|---|---|
| Between Groups | 0.661259 | 1 | 0.661259 | 1.769186 | 0.186364813 | 3.931556 |
| Within Groups | 39.24528 | 105 | 0.373765 | |||
| Total | 39.90654 | 106 | ||||
Using a single factor ANOVA testing on the Youth populace divided based on gender for a 95% level of confidence and giving a quantitative magnitude of 3 for “Yes”, 2 for “Sometimes” and 1 for “No”. From the mean of the data, we can see a partiality towards “yes” in both the genders, with the male youth showing more purchasing power than the female youth as they have a higher mean. Males also show a lower variance and standard deviation and are clustered around the mean with fewer outliers, when compared to the female gender Tables 3 and 4.
| Table 3 ANOVA Single Factor: Branding Importance |
||||
| Groups | Count | Sum | Average | Variance |
|---|---|---|---|---|
| Female Branding Importance | 63 | 167 | 2.650794 | 0.359959 |
| Male Branding Importance | 55 | 144 | 2.618182 | 0.462626 |
| Table 4 ANOVA on Branding Importance |
||||||
| Source of Variation | SS | df | MS | F | p-Value | F crit |
|---|---|---|---|---|---|---|
| Between Groups | 0.03123 | 1 | 0.03123 | 0.076591 | 0.782464636 | 3.922879 |
| Within Groups | 47.29928 | 116 | 0.407752 | |||
| Total | 47.33051 | 117 | ||||
The p value, F value and F critical value show that there is a lack of interdependence on purchasing decisions based on gender.
Percentage of Indian Youth focussing on brand while making a purchasing decision is as mentioned below in Figure 3.
From the above graph, it can be noted that 70% of the Indian Youth place emphasis on branding while making a buying decision in Table 4.
Using the previous study of single factor ANOVA and giving a quantitative magnitude of 3 for “Yes”, 2 for “Sometimes” and 1 for “No”, Females give more importance to branding of daily use products than males, gaining a score of 2.651, while males scores 2.62. Also, females have proven to show lesser deviation from the mean (more importance to branding) in comparison to males. The p value, F value and F critical value show that there is a lack of interdependence on branding decisions based on gender. Among the youth focussing on brand, the habitually bought items which require brand focus in the minds of the consumer is as mentioned below in Tables 5 and 6 and Figure 4.
| Table 5 ANOVA Single Factor: Various Daily Use Products |
||||
| Groups | Count | Sum | Average | Variance |
|---|---|---|---|---|
| In case of toothpastes, will you choose a known brand which charges higher than an unknown cheap brand? | 120 | 427 | 3.558333 | 1.542787 |
| In case of Soaps, will you choose a known brand which charges higher than an unknown cheap brand? | 120 | 458 | 3.816667 | 1.680392 |
| In case of Stationary, will you choose a known brand which charges higher than an unknown cheap brand? | 120 | 371 | 3.091667 | 1.731022 |
| In case of Cosmetics, will you choose a known brand which charges higher than an unknown cheap brand? | 120 | 459 | 3.857143 | 2.089588 |
| In case of Soft Drinks, will you choose a known brand which charges higher than an unknown cheap brand? | 120 | 413 | 3.441667 | 1.794888 |
| Table 6 ANOVA on Various Daily Use Products |
||||||
| Source of Variation | SS | df | MS | F | p-Value | F crit |
|---|---|---|---|---|---|---|
| Between Groups | 46.3804 | 4 | 11.5951 | 6.561306 | 3.6E-05 | 2.386935 |
| Within Groups | 1049.71 | 594 | 1.767194 | |||
| Total | 1096.09 | 598 | ||||
Many findings can be noted in this answer. Firstly, brands are given most importance in cosmetics (83.6%) and least importance to brand is given while buying stationary items (15.5%). Brands of toothpastes and soaps are almost given equal importance in the minds of a consumer. Soft drinks are cattle classified, maintaining a position in the middle; showing that branding of soft drinks is important, but need not be given the most attention by an organization in Table 7 and Table 8.
| Table 7 ANOVA Single Factor: for Toothpastes |
||||
| Groups | Count | Sum | Average | Variance |
|---|---|---|---|---|
| Male for Toothpastes | 55 | 194 | 3.527273 | 1.513131 |
| Female for Toothpastes | 63 | 229 | 3.634921 | 1.558116 |
| Table 8 ANOVA on Toothpaste |
||||||
| Source of Variation | SS | df | MS | F | p-Value | F crit |
|---|---|---|---|---|---|---|
| Between Groups | 0.334028 | 1 | 0.340277 | 0.221365 | 0.638885 | 3.922879 |
| Within Groups | 178.312 | 116 | 1.537175 | |||
| Total | 178.653 | 117 | ||||
With a sample of 120 customers, the following daily use items were surveyed: toothpastes, soaps, stationary, cosmetics and soft drinks. 5 for “Irrespective of price difference, I will choose the known brand if I had a good experience using it or have seen it in advertisements”, 4 for “I will go for the more expensive branded option as higher price means higher quality.”, 3 for “If the hike in price is between 10-40%, I will go for the known brand”, 2 for “I will go for cheaper product” and 1 for “I will choose the unknown brand”. In accordance with the results, customers show maximum brand consciousness for cosmetics, and least for stationary.
The p value is below 0.05, showing high interdependence between all groups. A brand conscious customer is most likely to show brand consciousness for all the daily use products. The same is indicated in f test too.
In accordance with the results for a 95% confidence interval, toothpastes show an above average brand consciousness in the minds of the customer, with them going for the branded option above the unbranded one.
The p value, F value and F critical value show that there is a lack of interdependence on branding decisions based on gender in Table 9 and Table 10.
| Table 9 ANOVA Single Factor for Soaps |
||||
| Groups | Count | Sum | Average | Variance |
|---|---|---|---|---|
| Male for Soaps | 55 | 200 | 3.636364 | 1.86532 |
| Female for Soaps | 63 | 255 | 4.047619 | 1.336406 |
| Table 10 ANOVA on Soaps |
||||||
| Source of Variation | SS | df | MS | F | p-Value | F crit |
|---|---|---|---|---|---|---|
| Between Groups | 4.966432 | 1 | 4.966432 | 3.3138099 | 0.079109 | 3.922879 |
| Within Groups | 183.584 | 116 | 1.582624 | |||
| Total | 188.551 | 117 | ||||
In accordance with the results for a 95% confidence interval, soaps show a high brand consciousness in the minds of the customer, with them going for the branded option above the unbranded one. Females have shown an extremely high brand consciousness in comparison to males. Males also show a higher variance in their decisions compared to females, making females target customers for branded soaps. The p value, F value and F critical value show that there is a lack of interdependence on branding decisions based on gender in Table 11 and Table 12.
| Table 11 ANOVA Single Factor for Stationary |
||||
| Groups | Count | Sum | Average | Variance |
|---|---|---|---|---|
| Male for Stationary | 55 | 180 | 3.272727 | 2.164983 |
| Female for Stationary | 63 | 187 | 2.968254 | 1.353815 |
| Table 12 ANOVA on Stationary |
||||||
| Source of Variation | SS | df | MS | F | p-Value | F crit |
|---|---|---|---|---|---|---|
| Between Groups | 2.7222 | 1 | 2.722198 | 1.57227 | 0.212405 | 3.922879 |
| Within Groups | 200.846 | 116 | 1.731428 | |||
| Total | 203.568 | 117 | ||||
Stationary has shown the least brand decision making requirements in the minds of a consumer, with females showing a below average preference for branded stationary; although males show a higher variance in their decisions compared to females; making branded stationary a questionable decision in the minds of young consumers in Table 13 and 14.
| Table 13 ANOVA Single Factor for Cosmetics |
||||
| Groups | Count | Sum | Average | Variance |
|---|---|---|---|---|
| Male for Cosmetics | 55 | 209 | 3.8 | 2.237037 |
| Female for Cosmetics | 62 | 246 | 4.467742 | 1.933369 |
| Table 14 ANOVA on Cosmetics |
||||||
| Source of Variation | SS | df | MS | F | p-Value | F crit |
|---|---|---|---|---|---|---|
| Between Groups | 0.82007 | 1 | 0.820072 | 0.395032 | 0.530912 | 3.923599 |
| Within Groups | 238.735 | 115 | 2.075961 | |||
| Total | 239.556 | 116 | ||||
In accordance to the results for a 95% confidence interval, cosmetics show a high brand consciousness in the minds of the customer, with them going for the branded option above the unbranded one. Females have shown an extremely high brand consciousness in comparison to males. Males also show a higher variance in their decisions compared to females, making females target customers for branded cosmetics in Table 15 and 16.
| Table 15 ANOVA Single Factor: Soft Drinks |
||||
| Groups | Count | Sum | Average | Variance |
|---|---|---|---|---|
| Male for Soft Drinks | 55 | 198 | 3.6 | 1.911111 |
| Female for Soft Drinks | 63 | 212 | 3.365079 | 1.622632 |
| Table 16 ANOVA on Soft Drinks |
||||||
| Source of Variation | SS | df | MS | F | p-Value | F crit |
|---|---|---|---|---|---|---|
| Between Groups | 1.62055 | 1 | 1.620554 | 0.922382 | 0.338848 | 3.922879 |
| Within Groups | 203.803 | 116 | 1.756924 | |||
| Total | 205.424 | 117 | ||||
In accordance to the results for a 95% confidence interval, toothpastes show an above average brand consciousness in the minds of the customer, with them going for the branded option above the unbranded one from Tables 17-20.
| Table 17 ANOVA Single Factor: Branded or Unbranded |
||||
| Groups | Count | Sum | Average | Variance |
|---|---|---|---|---|
| Female: Branded or Unbranded | 63 | 123 | 1.952381 | 0.046083 |
| Male: Branded or Unbranded | 55 | 108 | 1.963636 | 0.03569 |
| Table 18 ANOVA on Branded or Unbranded |
||||||
| Source of Variation | SS | df | MS | F | p-Value | F crit |
|---|---|---|---|---|---|---|
| Between Groups | 0.00372 | 1 | 0.00372 | 0.090193 | 0.764469 | 3.922879 |
| Within Groups | 4.784416 | 116 | 0.041245 | |||
| Total | 4.788136 | 117 | ||||
| Table 19 ANOVA Single Factor for known + Cost |
||||
| Groups | Count | Sum | Average | Variance |
|---|---|---|---|---|
| Female: Known + Cost | 63 | 62 | 0.984127 | 0.015873 |
| Male: Known + Cost | 55 | 52 | 0.945455 | 0.052525 |
| Table 20 ANOVA on known + Cost |
||||||
| Source of Variation | SS | df | MS | F | p-Value | F crit |
|---|---|---|---|---|---|---|
| Between Groups | 0.043916 | 1 | 0.043916 | 1.333408 | 0.250573 | 3.922879 |
| Within Groups | 3.820491 | 116 | 0.032935 | |||
| Total | 3.864407 | 117 | ||||
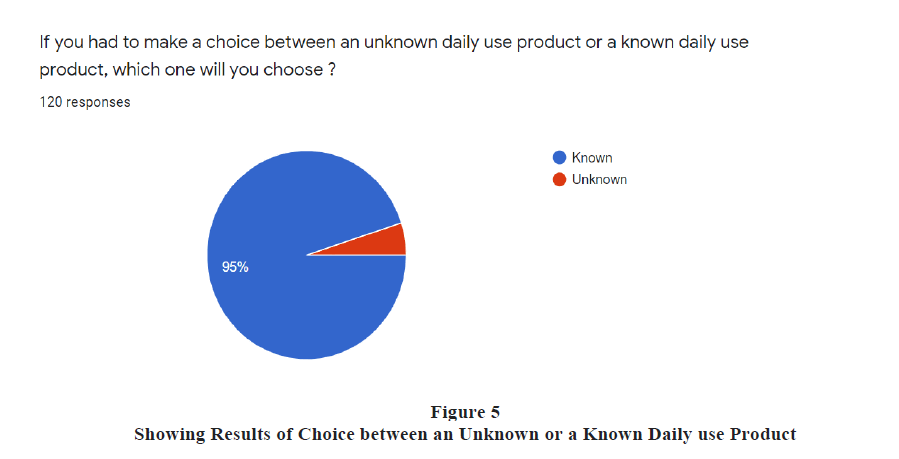
The following two questions was intended to recognize the importance of branding in the minds of the consumer in Figure 5.
If you had to make a choice between an unknown daily use product or a known daily use product, which one will you choose?
When given a choice between branded product and unbranded product with no other information such as cost, quality etc., both genders show an extremely high partiality towards the branded product. With an extremely high mean and a very low variance, Branded products have proven to be chosen by consumers irrespective of gender. The p value, F value and F critical value show that there is a lack of interdependence on branding decisions based on gender.
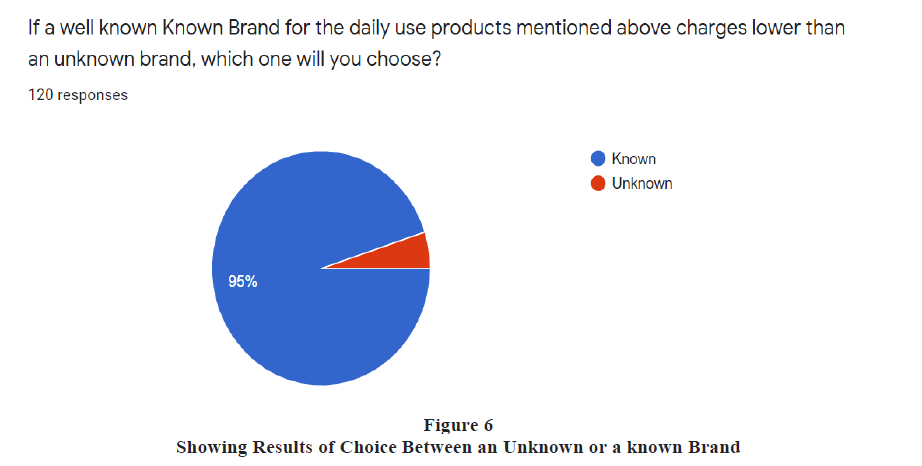
If a well-known Known Brand for the daily use products mentioned above charges lower than an unknown brand, which one will you choose in Figure 6.
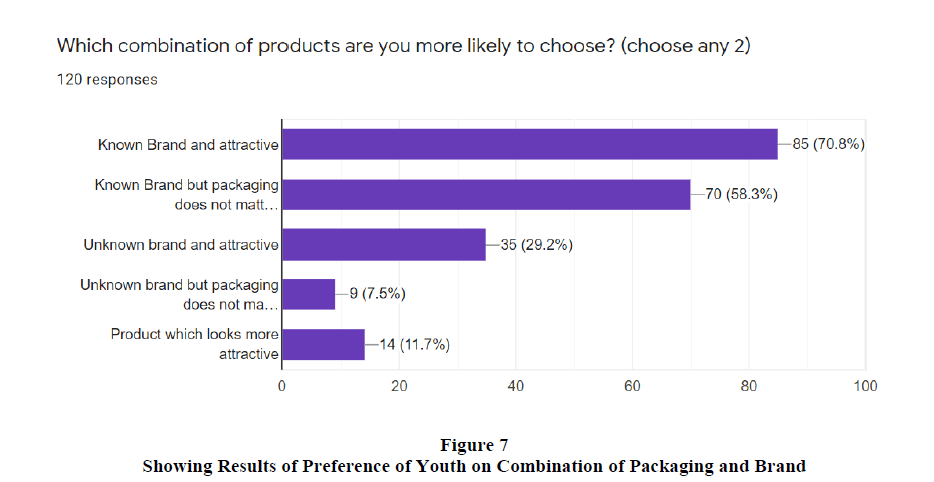
From the above two questions, the importance of brand awareness and its influence in making a purchase decision can be clearly noticed. 95% people would choose a branded product over an unknown product if they are unaware of the quality of both products, and 95% people will choose a branded product if it is cheaper than an unknown product. Price made a negligible difference in this case; brand awareness is clearly the most important factor in Figure 7.
The remaining two questions focus on the importance placed on packaging by consumers of a product in Tables 21-24.
| Table 21 ANOVA Single Factor for amount of Importance is placed on Packaging |
|||
| Groups | Count | Sum | Average |
|---|---|---|---|
| Packaging more important than branding | 49 | 196 | 4 |
| Banding and packaging equally important | 85 | 255 | 3 |
| Only branding important | 70 | 140 | 2 |
| Both unimportant | 9 | 9 | 1 |
| Table 22 ANOVA on amount of Importance is placed on Packaging |
||||||
| Source of Variation | SS | df | MS | F | p-Value | F crit |
|---|---|---|---|---|---|---|
| Between Groups | 147.8592 | 3 | 49.28638 | 65535 | - | 2.647801 |
| Within Groups | 0 | 209 | 0 | |||
| Total | 147.8592 | 212 | ||||
| Table 23 Showing the High Interdependency between the Groups |
|||
| Groups | Count | Sum | Average |
|---|---|---|---|
| Packaging + higher cost | 58 | 116 | 2 |
| No packaging + lower cost | 52 | 52 | 1 |
| Table 24 Showing the High Interdependency between the Groups |
|||||
| Source of Variation | SS | df | MS | F | F crit |
|---|---|---|---|---|---|
| Between Groups | 27.41818 | 1 | 27.41818 | 65535 | 3.929012 |
| Within Groups | 0 | 108 | 0 | ||
| Total | 27.41818 | 109 | |||
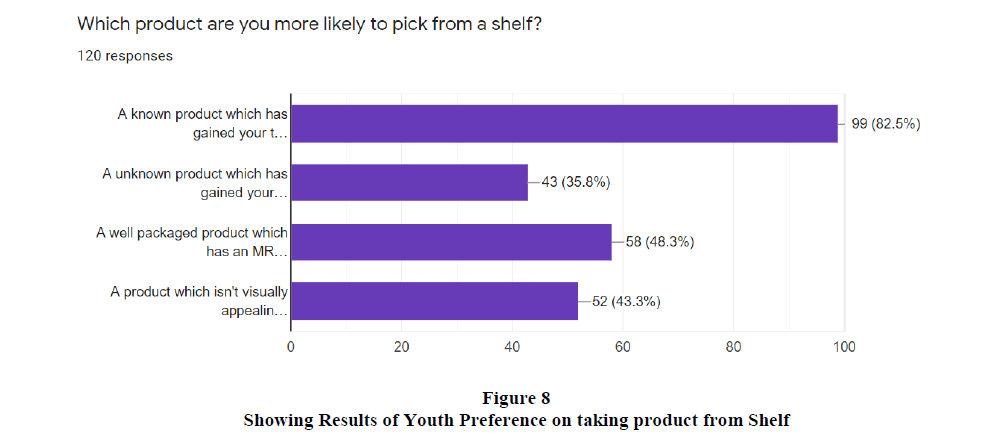
This chart shows that a significant amount of importance is placed on packaging (Option 1, 4 and 5), although branding is given more importance than packaging in Figure 8.
The F test shows the high interdependency between the groups.
Limitations of the Study
There are a few limitations involved in this research, which is mentioned as follows:
Firstly, a higher percentage of responses were received in the female category (56.4%), which indicated that the responses aren’t gender neutral. Also, the sample size cannot be taken as an indication for the entire youth populace currently residing in India. Further, human errors while filling the form, biases, mistaken marking, and perceptions cannot be neglected, neither rectified.
Results and Findings
The results were achieved by applying the results from a sample size of 120 Indian youth respondents. The results obtained are compared with the hypothesis set at the beginning of the analysis. Among those who answered the questionnaire, 51.7% were females and 45.8% were males.68.3% of Indian Youth do have purchasing power in their families, irrespective of financial independence. Females give more importance to branding of daily use products than males, gaining a score of 2.651, while males scores 2.62. Also, females have proven to show lesser deviation from the mean (more importance to branding) in comparison to males. A significant amount of importance is placed on packaging (Option 1, 4 and 5), although branding is given more importance than packaging.
First hypothesis: Buying behaviour of consumers is dependent on brand awareness. – True Second hypothesis can be stated as: Perceived quality based on branding and packaging affect the choices of consumers- True.
Conclusion
The study clearly indicates the importance of branding for any marketers to effectively target their consumers. A positive brand image always helps the marketers to position the product favourably in the minds of consumer. It also helps them to differentiate their product offerings among the clutter of brands. Since the modern-day consumers are very sensitive to product quality, effective branding helps to boost the customer loyalty towards the brand. The marketers need to understand the segment differences like age, gender, income to position their brands successfully in any chosen market. Many consumers strongly associate the product quality with the brand name. Hence, they need to consciously design and communicate the branding elements to the target market.
References
- Akkucuk, Ulas and EsmaeiliNooshabadi, Javad. (2016). The Impact of Brands on Consumer Buying Behavior: An Empirical Study On Smartphone Buyers. International Journal of Research in Business and Social Science . 5. 1. 10.20525/ijrbs.v5i4.551.
- Luther Ntim Adjei , Josephine Pepra Mensah &Emmanuel Adu-Boahen (2014). The Role of Branding and Packaging in Creating Customer Loyalty in the Toothpaste Market: The Case of Ghana. European Journal of Business and Management
- Rajput, N., Kesharwani, S., and Khanna, A. (2012). Consumers’ Attitude towards Branded Apparels: Gender Perspective. International Journal of Marketing Studies, 4(2), p111.
- Rigaux-Bricmont, B. (1982). Influences of brand name and packaging on perceived quality. Advances in consumer research, 9(1), 472-477.
- Sengupta, Aniket, (2014) Brand Analyses of Global Brands Versus Local Brand in Indian Apparel Consumer Market" . Theses and Dissertations--Retailing and Tourism Management. 6. https://uknowledge.uky.edu/mat_etds/6
- Mishra, A. A. (2010). Consumer decision-making styles and young-adult consumers: An Indian exploration. Management & Marketing-Craiova, (2), 229-246.
- Mehrotra, Ankit and Agarwal, Reeti. (2009). Private Label Brands And Their Perception Among Indian Youth.
- Soni, Pavleen. (2013). Promoting Foods to Indian Children through Product Packaging. Journal of Competitiveness. 5. 134-146. 10.7441/joc.2013.04.08.
- Folkes, Valerie S. and Shashi Matta (2004), “The Effect of Package Shape on Consumers’ Judgments of Product Volume: Attention as a Mental Contaminant,” Journal of Consumer Research, Vol.31, No.2, pp 390–401.
- Garber, L.L. Jr, Burke, R.R. and Jones, J.M. (2000), “The role of package color in consumer purchase consideration and choice”, Working Paper Series, Rep. No. 00-104, Marketing Science
- Institute, Cambridge, MA. Garber, Lawrence L., Jr. (1995). The Package Appearance in Choice. In: Advances in Consumer Research. Frank R. Kardes and MitaSujan (eds.). Provo, UT: Association for Consumer Research, pp 653–660.
- Banerjee, Saikat. (2013). An Empirical Analysis on Attitude of Indian Consumers towards Packaging & Labelling across Different Product Categories. Journal of Marketing & Communication. 9. 20-30.
