Research Article: 2022 Vol: 25 Issue: 5
Fresh tomatoes are in demand: a marketing and sustainable competitiveness analysis of tomato exports from Jordan
Tala Qtaishat, The University of Jordan
Mohammad Samir El-Habbab, The University of Jordan
Dan P Bumblauskas, University of Northern Iowa
Mohammad Tabieh, The University of Jordan
Citation Information: Qtaishat, T., El-Habbab, M.S., Bumblauskas, D.P., & Tabieh, M. (2022). Fresh tomatoes are in demand: a marketing and sustainable competitiveness analysis of tomato exports from Jordan. Journal of Management Information and Decision Sciences, 25(5), 1-15.
Abstract
It is important to determine the agricultural sectors with export potential base on the analysis of current export flows. The concept of competitive advantage is in the heart of theory of international trade. This article analyzes the competitiveness and overall economic trade activities taking tomatoes as case study in Jordan. The main objective of this study is to determine to what extent Jordan’s specialized commodity export of tomato impacts markets and the growth or decline of its world export market share. Tomatoes are considered the primary vegetable crop in Jordan with respect to area and production capacity. Moreover, Jordan exported about 52% of the produced tomatoes as an average of the period 2001-2018. The sustainable production of tomatoes in Jordan is a key economic consideration for the country. Several comparative advantage and competitiveness indicators were used in this research, including: Revealed Comparative Advantage (RCA), Trade Competitiveness Index (TCI), The export elasticity of substitution (σ), Constant Market Share (CMS), and Trade Entropy Index (TEI). The results showed that Jordanian tomatoes have a competitive trade advantage.
Keywords
Tomatoes; Jordan; Competitive indicators; Sustainable; Constant market share.
Introduction and Research Motivation
Competitiveness levels for certain commodities illustrate the economic strength of the trade sector in the country. Competition emphasizes the use of comparative advantage to decrease trade deficits by exporting larger quantities of commodities where a particular nation is more efficient than other countries in production of these commodities.
Research was conducted that evaluates the key factors of firms' market-oriented activities in their export operations; it used data from New Zealand and Finland. It found that several factors, which are unique to firms' export operations, may play an important role in influencing the firms' export market-oriented behavior (Cadogan et al., 2001). The authors of a research titled “disaggregate market share response models” traditional analyzed the market share response (multiplicative competitive interaction or MCI) models to estimate the competitive effects (DeSarbo et al., 2002). Competitiveness main determinants are the size and quality of exports, the volume of exports is quantities of export products (Balassa, 1968). The most and commonly used methods of in competitive advantage studies use the Revealed Comparative Advantage index (RCA).
Chen & Duan (2001) used the Constant Market Share (CMS) in analyzing the Competitiveness indicated that Canada and its main competitors were able to increase their agri-food exports to Asia. These increases were primarily attributed to the rapid growth of Asian agri-food imports during the period. Canada was found to be competitive in the Asian market, ranked the second only after China.
El-Jafari (1996) analyzed the International Competitiveness of the Palestinian Agriculture, and found that over the past three decades, Palestinian agriculture has been subjected to increased international and regional competition. The impact of this competition is in part evidenced by trend decline in the West Bank and Gaza Strip agricultural exports in one hand, and the increases in agricultural imports on the other. The empirical results indicate that the performances of domestic and import market shares could be increased through improving the productivities of the major production factors such as land, labor and capital.
Although tomatoes in Jordan is considered a main crop for domestic and export market, but few marketing and trade research, especially in export market share, was conducted to show its importance.
The purpose of this study is to find out to what extent Jordan’s specialized export of tomatoes impacts world markets and the growth or decline of its world export market share.
The study benefited from published literature on the same topics. This literature was published in international journals.
The study starts with discussing tomato production and trade situation in Jordan, A section on literature reviews was summarized then the methodology of conducting this study was presented in some detail. The study used secondary data from local and international institutions.
Several comparative advantage and competitiveness indicators were used in this research. They include: Revealed Comparative Advantage (RCA), the Trade Competitiveness Index (TCI), the export elasticity of substitution (σ), Constant Market Share (CMS), and the Trade Entropy Index (TEI). The selection of these indicators was based on their importance and the availability of data for evaluating them.
Background: Tomato Production and the Trade Situation in Jordan
The cultivated area for tomatoes in Jordan reached 1,894 thousand dunums in 2017, compared to 2,728 thousand dunums in 2016, a decrease of 30.6% due to a shortage of water and nearby market closures. Note that 1 dunum is equivalent to 0.1 ha (Qtaishat et al., 2019). The irrigated area created 46% of the total cultivated area (JDOS, 2019). The fruit-tree area reached 780.6 thousand dunums, and the total number of trees reached 21,495 thousand dunums in 2017 while, in 2016, the area and the total number of fruit trees were 867.0 thousand dunums and 23,573 thousand trees, respectively. The decrease for the tree area was 10.0% for the year 2017, compared to 2016, due to climate conditions. It is worth noting that the olive crop’s production increased from 116 thousand tons in 2016 to 145 thousand tons in 2017 due to the biennial yield phenomenon. Biennial bearing is a widespread phenomenon for olive orchards, creating severe instability when managing input (labor, harvesting machinery, or mills), oil quality, and marketing (Gucci & Caruso, 2010).
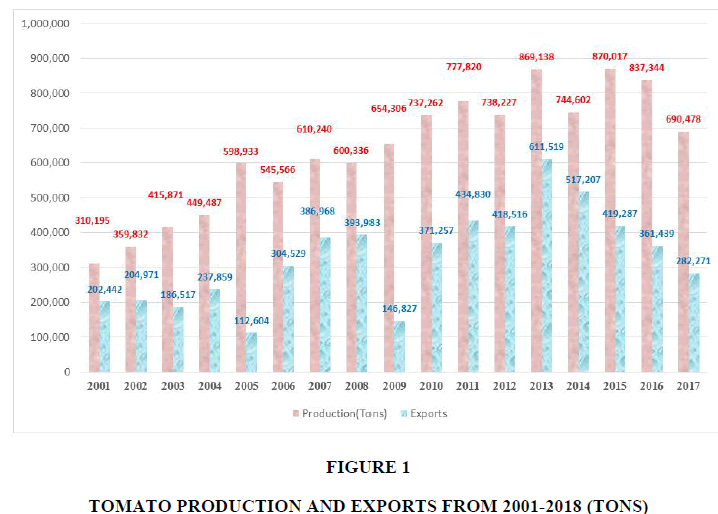
The field crops’ area reached 736.7 thousand dunums in 2017, compared to 1,355 thousand dunums in 2016, a 45.6% decrease. The vegetable area reached 377 thousand dunums in 2017, compared to 506 thousand dunums in 2016, a decrease of 25.5%. With respect to area and production, tomatoes are the main vegetable crop in Jordan. The vegetables’ area and production for 2017 in Jordan are shown in Table 1; tomatoes constituted about 32% of the vegetables’ planted area and about 40% of vegetable production. Jordan exported approximately 52% of the produced tomatoes from 2001-2018, as shown in Figure 1.
| Table 1 Tomatoes’ Share Of Jordan’s Vegetable Area And Production In 2017 |
||
|---|---|---|
| Crop | Area (dunums) | Production (tons) |
| Total Vegetables | 376,959 | 1,737,044 |
| Tomatoes | 121,945 | 690,477 |
| Percentage Tomatoes (%) | 32% | 40% |
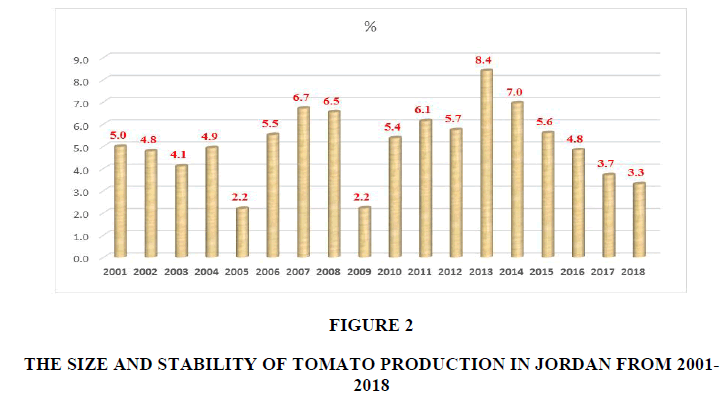
The average size and stability for Jordan’s tomato production from 2001-2018 was 5.115%. The highest year was 2013 (8.4%), and the lowest years were 2005 and 2009 (2.2%) (JDOS, 2019) (Figure 2).
Literature Review
The Constant Market Share Analysis (CMSA) approach decomposes the volatility of any trader country's market shares. Fagerberg & Sollie (1987) suggest a more recent version that avoids some limitations imposed by previous specifications. This note begins by explaining how CMSA works before moving on to specific applications in the Italian context. The most significant contribution of this study is two. The formal derivation of market share variation is proposed in the second section of this article (Bonanno, 2016).
Ahmadi?Esfahani (2006) generalized the Constant Market Shares (CMS) framework in his research, paying special emphasis to the theoretical criteria that must be met for diagnostic interpretation. The method is used to examine the export performance of Australia's processed food sector in Southeast Asia between 1980 and 2003. He found that the empirical validity of the aggregation assumptions contained in the diagnostic interpretation determines the use of CMS analysis for evaluating a country's international trade performance.
Thailand is an agricultural nation that exports the most rice and rubber in the world. Using data from 1991 to 1998, Revealed Comparative Advantage (RCA) and Constant Market Share Model (CMS) approaches are applied to natural rubber in Thailand. Indonesian natural rubber has a comparative advantage or trade specialization in the US market, according to the RCA index. Thailand, on the other hand, has no comparative advantage in the United States, with an RCA of 0.42-0.96 (Poramacom, 2002).
Turkekul et al. (2007) Conducted a study titled “A Market Share Analysis of Virgin Olive Oil Producer Countries with special respect to Competitiveness” used constant market share analysis to determine the competitiveness of Turkey and its competitors, which are the primary olive oil producers, in the markets of the United States, Australia, Canada, Brazil, and Japan. They used data between 1990/94 and 200/04. According to the findings, Italy was the most competitive in the destination markets throughout the time period studied. Following Italy are Greece and Turkey. During the same era, while Spain's exports to destination markets increased, its competitiveness was harmed due to a loss of market share. Production, organization, and commerce are all critical to Turkey's long-term worldwide competitiveness in olive oil.
In practical studies of export development, Constant Market Share (CMS) analyses are widely utilized. Fagerberg & Sollie (1987) examined the method's evolution and believes that it can be significantly improved. In addition to the traditional CMS impacts, a new version of the approach is developed that allows for the computation of effects reflecting each country's ability to adapt its export structure to changes in the commodity and country composition of world imports. For the period 1961-1983, the approach is applied to a sample of 20 Organization for Economic Co-operation and Development (OECD) nations.
In studying the competitiveness of Egyptian Oranges, the researchers employed a Rotterdam import allocation version to research call for interactions amongst key orange providers to Russia from 1996 to 2014 on the way to check the competitiveness of Egyptian oranges and to research the capability export possibilities afforded with the aid of using the Russian market. The findings reveal that Egypt has a great comparative gain with inside the export of oranges to Russia whilst as compared to different orange exporters (Abu Hatab, 2016).
A study by Capobianco-Uriarte et al. (2021) represented an assessment of the tomato trade intensity, from examining its primary client's markets with regards to the European Union. The systemic structure is carried out through Constant Market Share to break down varieties in sends out, permitting the part owing to seriousness and isolation into general or explicit intensity to be evaluated. The Constant Market Share was adjusted to zero in on the separated interest to notice the impact of the overall emergency on the European tomato market. This study presented another graphical approach to addressing the aftereffects of Constant Market Share system through trade intensity maps in the European tomato market for the gathering for every primary rival in every European client market. It was found that Spain and Belgium are applicant nations to be competitive tomato sector.
Montano Méndez et al. (2021) examined the competitiveness of the Mexican red tomato trade to the US. Market techniques that had been used: the relative export advantage (RXA) index proposed by Vollrath (1989) and the technique of regular marketplace proportion analysis (CMS) consistent with Ahmadi-Esfahani`s (1995) approach. The study showed that the export concentration of Mexican red tomatoes (about 98%) was directed to the USA.
Escaith (2021), in his article titled “revisiting constant market share analysis: An exercise applied to NAFTA” used a revised model of Constant Market Share (CMS) analysis. This new methodology is strategically predictable and established in data hypothesis. It did not include the discrete-structure residuals that weakened the CMS model analysis, while staying easy to process. The new “Comparative Market Share Analysis Decomposition” (CMSD) was applied to the United States imports after the execution of the North American Free Trade Agreement (NAFTA). It is displayed that both CMSD and RCA can be matched together to reveal insight into the elements of intensity of competitiveness and comparative advantages in international trade.
A study was conducted in 2022 to investigate the impact of geotourism on destination brand selection with social media as the moderating variable. Structural Equation Modeling (SEM) in Smart PLS 3.0 was used for data analysis. The study evaluated a selection of hypothesis and found that all the hypotheses which implied a direct impact were confirmed; however, when social media was introduced as the moderating variable, it was not significant enough to affect the outcome (Salamzadeh et al., 2022).
Methodology
Data
Secondary data were used for this research. The main source of the data was the International Trade Center (Trade Map, 2020). These data cover the time period from 2001- 2018.
Competitiveness Analysis
Several comparative advantage and competitiveness indicators were used for this research: Revealed Comparative Advantage (RCA), the Trade Competitiveness Index (TCI), the export elasticity of substitution (σ), Constant Market Share (CMS), and the Trade Entropy Index (TEI).
Revealed Comparative Advantage (RCA)
If a country (Jordan) has a comparative advantage that is apparent for a particular product (tomatoes, j), the ratio for the country’s exports of that product to its total exports for all goods (group of products) with common characteristics (vegetables) to the same proportion of the world would exceed 1. According to the following formula (Balassa, 1965), here is the RCA for Jordan’s tomato exports relative to vegetable exports:
RCAjw =Jordan’s exports of tomatoes / Jordan' s exports of vegetables/ (World exports of tomatoes / World exports of vegetables
When the RCAjw value is greater than one (RCAjw>1) for a particular product in a country, the country has a comparative advantage that is visible for that product (Balassa, 1965). The data used to calculate the apparent relative advantage are as follows:
• The quantity of tomato exports in Jordan and in the world.
• The quantity of vegetables produced in Jordan and in the world.
• The data source is Food Agriculture Organization STAT (FAOSTAT, 2019). The data for 2017 were used.
Trade Competitiveness Index (TCI)
The Trade Competitiveness Index (TCI) evaluates the net trade balance for the total trade volume (Chikhasu, 2007). The formula for TCI is as follows:

Xij:Exports of the commodity from country i to country j
Mij: Imports of the commodity from country i to country j
Positive values for the TCIij suggest competitiveness while negative values suggest the lack of completeness.
The export Elasticity of Substitution (σ)
To examine the degree of substitutability for Jordan’s tomato exports to the world, we directly estimate the elasticity of substitution for tomato exports between Jordan and the world. The export elasticity of substitution (σ) is defined as follows (Ali et al., 2014):

Where
Qi = Jordan’s export quantity of tomatoes to the world Qw = The world export quantity of tomatoes Pi = The prices on dates when tomatoes are exported from Jordan Pw = The world prices for exported tomatoes
The simplest way to obtain the elasticity of substitution is to take the logarithm of the numerator over the denominator for equation (1). That is,

An error term, μ, is added to depict the estimation model in equation (2). The estimate for the coefficient on the relative price term shows the estimated export demand elasticity ( ). The sign of
  is defined as negative. If the price of the tomatoes exported from Jordan increases, Jordan’s export is more likely to be replaced by tomatoes which are supplied by the world. If the elasticity is small, however, the price increase is not likely to lead to a replacement with a competitor’s tomatoes
Constant Market Share (CMS)
In general, the CMS analysis is designed to investigate a commodity’s growth stagnation. The country’s exports may fail to grow as rapidly as the world average, a factor which is often attributed to one or more of the following reasons:
1. Exports may be concentrated in commodities for which demand is growing slowly; 2. Exports may be going primarily to relatively stagnant regions; or 3. The country in question may have been unable or unwilling to compete effectively with other sources.
Constant-Market-Shares (CMS) analysis has often been applied to studies about export performance and development. The CMS model is based on an identity between the change in the market share for a particular exporting country (i) in a given market (j) from the initial year (t) to the final year (t+1) and the so-called product composition and competitiveness effects.
Applying the traditional CMS to analyze the export change for a focus country encounters several problems. One issue is the index problem. The results of the CMS analysis depend on the year chosen to calculate the base-year market share and the commodity composition. In this study, the annual change is analyzed rather than dividing the study period (2001-2018) into smaller increments as was done with previous studies. The decomposition is conducted using the average instead of yearly values within each interval. This method prevents the base year from dominating the results, hence avoiding or mitigating the index problem.
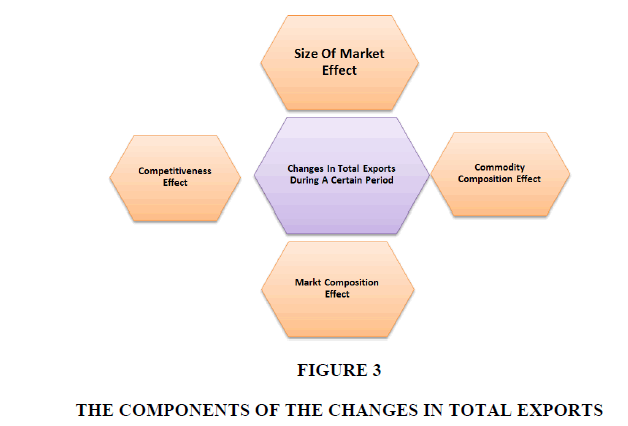
The CMS analysis is used to identify four components of export performance: market size effect, market composition effect, competitive effect, and commodity composition effect. Each component is detailed in the following paragraphs (Turkekul et al., 2007).
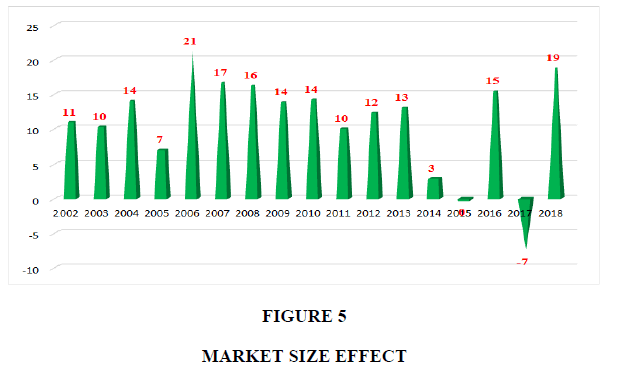
The market size effect indicates the portion of a country’s export growth which is attributable to the general increases in destination-market imports. The magnitude of this effect shows the potential increase for a country’s exports if the country were able to maintain its share of the destination imports.
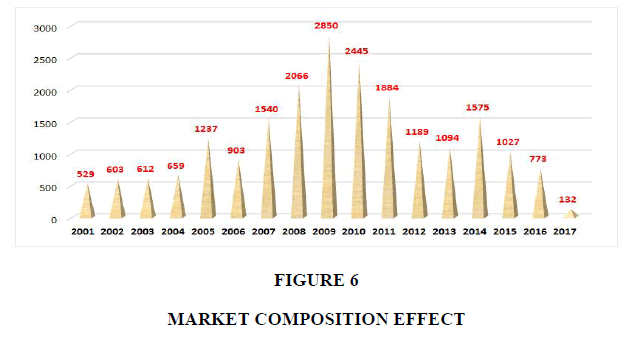
The market composition effect indicates a country’s ability to concentrate on relatively rapidly growing countries. The change in exports due to market distribution depends on the foreign countries’ trade policies and income growth.
The commodity composition effect points out whether a country has concentrated on exporting commodities for which markets have been expanding rapidly or on commodities for which markets have been expanding less rapidly. This effect reflects the export country’s factor endowment as well as the product’s income and price elasticity, based on demand, for the items with which that country specializes. For this study, this component was not investigated because we are analyzing the competitiveness of one commodity, i.e., tomatoes.
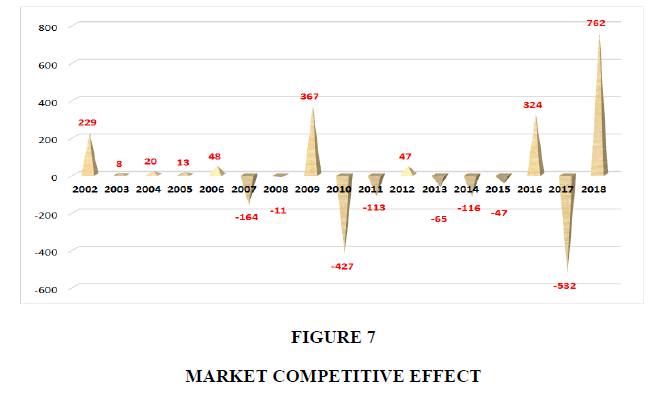
The competitiveness effect is defined by the residual term of the CMS model. The residual term picks up everything which is not explained by the first three effects. However, this term is utilized to indicate the improvement or the deterioration for the exports’ competitiveness, depending on whether the value has a positive or negative sign. It is usually assumed that this effect is independent of the three other effects discussed above, and it largely reflects the exporting countries’ domestic factors, as shown in Figure 3.
The underlying assumption of the CMS approach is that base-period export shares are maintained during other market periods. The market share’s structural components are calculated under this assumption. The following equation was used:

Where,
q: quantity of an export country’s commodity exports to the destination markets
S: an export country’s market share of the total commodity exports to the destination markets
Si: an export country’s market share of the commodity’s total exports to each destination market (i=1, 2...5)
Q: the quantity of the total commodity exports to the destination markets
Qi: the quantity of the total commodity exports to each destination market; superscripts 0 and 1 are for the base period and the subsequent period, respectively.
This equation indicates that quantity changes for an export country’s commodity exports to the destination markets between the two periods (q1-q0) can be decomposed into the three terms on the right-hand side of the equation, representing the size of the market effect, the market composition effect, and the competitive effect, respectively. Because we are only applying the method to one product, the commodity composition effect is dropped.
Trade Entropy Index (TEI)
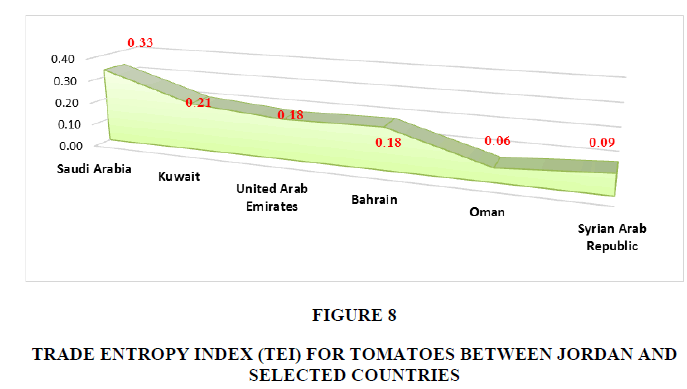
The second measure used to evaluate trade competitiveness for this research is the Trade Entropy Index (TEI). TEI is utilized in trade analysis to measure the concentration or dispersion of trade. These trade flows can be imports or exports (Arzu & Paul, 2003). The higher the index, the more dispersed the export (import) pattern is for that country. The index’s validity is derived from weighting each share component (bij) by its relevance, ln(1/bij). Therefore, if a country’s value for bij is very high, it will be scaled down by the ln (1/bij) term, and the maximum value is achieved when all shares are equal.
In this research, the first equation (i.e., the export equation) is used because there are negligible tomato imports in Jordan.

Where
IXi: entropy index of the exports IMi: entropy index of the imports aij: export share of country i to country j bij: import share of country i from country j
In the formula, each entity (share of a commodity) is weighted by its relevance. A very high export (or import) share is also weighted with correspondingly low weights. The very low ones are weighted with higher weights; consequently, the higher values (in sum) are obtained for approximately equal distributed shares. In summary, the higher the index, the more dispersed the export (or import) pattern is for that country.
Results and Discussion
Revealed Comparative Advantage (RCA)
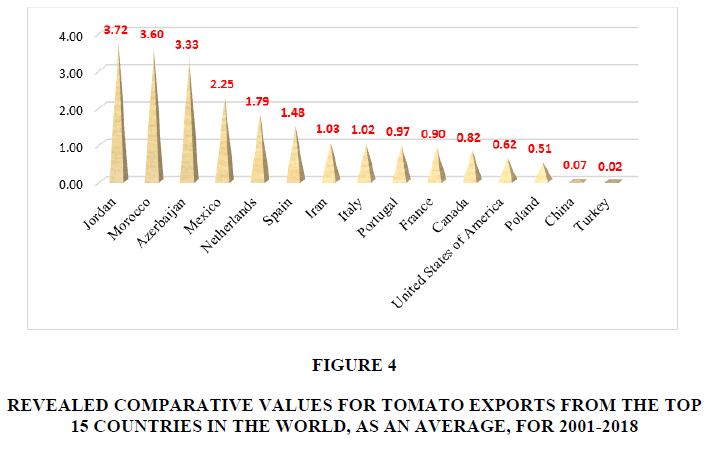
Figure 4 shows that 9 of the top 15 countries in the world had a competitive advantage during the time period from 2001-2018, i.e., RCA>1. Of those 15 countries, Jordan’s tomatoes had the highest RCA value (3.72).
Figure 4: Revealed Comparative Values For Tomato Exports From The Top 15 Countries In The World, As An Average, For 2001-2018.
Trade Competitiveness Index (TCI)
During three years (2016 to 2018), the calculated TCIs for tomatoes in Jordan were nearly equal to one, i.e., positive. Therefore, Jordan’s tomatoes were characterized as having a high level of competitiveness as shown in Table 2.
| Table 2 Trade Competitiveness Index (Tci) For Tomatoes In Jordan |
|||||
|---|---|---|---|---|---|
| Year | IM | EX | Xij-Mij | Xij+Mij | TCI |
| 2018 | 10 | 257889 | 257879 | 257899 | 0.9999 |
| 2017 | 27 | 282271 | 282244 | 282298 | 0.9998 |
| 2016 | 12 | 361439 | 361427 | 361451 | 0.9999 |
The Export Elasticity of Substitution (σ)
The numbers in Table 3 show the data used to calculate the export elasticity of substitution (σ). The estimated equation is as follows:
| Table 3 Data Used To Calculate The Export Elasticity Of Substitution (Σ) |
||
|---|---|---|
| Year | Qj/Qw | Pj/Pw |
| 2001 | 0.05 | 0.34 |
| 2002 | 0.05 | 0.35 |
| 2003 | 0.04 | 0.30 |
| 2004 | 0.04 | 0.45 |
| 2005 | 0.02 | 0.93 |
| 2006 | 0.05 | 0.39 |
| 2007 | 0.06 | 0.42 |
| 2008 | 0.06 | 0.43 |
| 2009 | 0.02 | 1.17 |
| 2010 | 0.05 | 0.54 |
| 2011 | 0.06 | 0.46 |
| 2012 | 0.05 | 0.55 |
| 2013 | 0.08 | 0.46 |
| 2014 | 0.06 | 0.69 |
| 2015 | 0.05 | 0.75 |
| 2016 | 0.04 | 0.68 |
| 2017 | 0.03 | 0.71 |
| 2018 | 0.03 | 0.58 |

The export elasticity of substitution (σ) was -0.52, and the t-value was -2.6, which is significant at P=0.02. As expected, the sign was negative and showed the inelastic export elasticity of substitution. As a result, Jordan could increase its tomato exports in the world market.
Constant Market Share (CMS)
The three afore mentioned CMS components for Jordan’s tomato exports between 2001 and 2018 were analyzed in this study: market size effect, market composition effect, and market competitive effect.
Market size effect
Figure 5 shows that the market size effect fluctuated during the study period. This change could be caused by the following factors:
• Fluctuations with the destination market’s imports
• Not concentrating on relatively rapidly growing countries.
The changes in trade policies and income growth for the selected importing countries could be the cause for this fluctuation.
Commodity composition effect
Figure 6 shows that the commodity composition effect continuously increased from 2001 until 2009; then, it dropped, with the lowest level in 2017. Thus, tomatoes exports were not able to concentrate on the rapidly growing countries exports. These changes could be caused by changes in trade policies and income growth for the selected importing countries.
Competitiveness effect
Figure 7 illustrates that the competitiveness effect indicators have positive and negative signs during the studied period. This finding indicates that tomato exports from Jordan were deteriorating, especially during the period from 2010-2017.
Trade Entropy Index (TEI)
The Trade Entropy Index (TEI) is used for trade analysis to measure the concentration or dispersion of trade. In this study, the TEI was calculated for the export analysis of tomatoes from Jordan to selected countries. Figure 8 shows considerable change for the export entropy values for Jordan’s tomato exports to selected countries because TEI has different export patterns during the study period. Moreover, the index shows that the highest export concentration was to Saudi Arabia (0.33), followed by Kuwait (0.21) and the United Arab Emirates (0.273).
Discussion and Future Work
This study found that Jordan’s tomato industry had the highest RCA value (3.72) among the top 15 tomato-producing countries globally. This high RCA value revealed a comparative advantage for tomato exports. On the other hand, the calculated TCIs for Jordan’s tomatoes were almost equal to one, i.e., positive, thus Jordan’s tomato industry was characterized as having a high level of global competitiveness (Qtaishat et al., 2019).
Conclusion
The export elasticity of substitution (σ) was found to be -0.52. The negative sign was expected and showed the inelastic export elasticity of substitution, meaning that Jordan could increase its tomato exports in the world market. Moreover, the market size effect fluctuated during the study period, which could be caused by fluctuations with the destination market’s imports and because it was not able to concentrate on the rapidly growing countries. The commodity composition effect for exported Jordanian tomatoes fluctuated during the study period because it was not able to concentrate on rapidly growing countries. In addition, the competitiveness effect indicators had positive and negative signs during the study period, indicating that tomato exports from Jordan were deteriorating, especially from 2010-2017. The export entropy values illustrated that there was considerable change for Jordan’s tomato exports to the selected countries because there were different export patterns during the study period.
One area is needed for further research which is the effect of water subsidies and programs on tomato production; this subject was previously explored for banana production. Operational sustainability is predicated on successful production and capacity planning, and this study provides an analysis for policy and decision makers to consider.
References
Abu Hatab, A. (2016). Demand relationships in orange exports to Russia: a differential demand system approach focusing on Egypt.Agricultural and Food Economics,4(1), 1-16.
Indexed at, Google Scholar, Crossref
Ahmadi?Esfahani, F. Z. (2006). Constant market shares analysis: uses, limitations and prospects.Australian Journal of Agricultural and Resource Economics,50(4), 510-526.
Indexed at, Google Scholar, Crossref
Ahmadi-Esfahani, F.Z. (1995). Wheat market shares in the presence of Japanese import quotas. Journal of Policy Modeling, 17, 315-323.
Ali, A. M., Fahad, A. M., & El-Habbab, M. S. (2014). Saudi dates exports demand in selected markets.International Journal of Agriculture and Crop Sciences,7(11), 827.
Arzu, I.G., & Paul, N. (2003). A Study into Competitiveness Indicators. Final Report for Rekabet Forum REF, Sabansi University, Istanbul, Turkey.
Balassa, B. (1965). Trade liberalisation and “revealed” comparative advantage.The Manchester School,33(2), 99-123.
Balassa, B. (1968). Trade liberalization among industrial countries: objectives and alternatives. American Political Science Review, 62(2), 692-692.
Bonanno, G. (2016).Constant market share analysis: A note(No. 07/2016). EERI Research Paper Series.
Indexed at, Google Scholar, Crossref
Cadogan, J. W., Paul, N. J., Salminen, R. T., Puumalainen, K., & Sundqvist, S. (2001). Key antecedents to “export” market-oriented behaviors: a cross-national empirical examination.International Journal of Research in Marketing,18(3), 261-282.
Indexed at, Google Scholar, Crossref
Capobianco-Uriarte, M. D. L. M., Aparicio, J., De Pablo-Valenciano, J., & Casado-Belmonte, M. D. P. (2021). The European tomato market. An approach by export competitiveness maps.PloS one,16(5), e0250867.
Indexed at, Google Scholar, Crossref
Chen, K. Z., & Duan, Y. (2001). Competitiveness of Canadian agri-food exports against competitors in Asia: 1980-97.Journal of International Food & Agribusiness Marketing,11(4), 1-19.
Indexed at, Google Scholar, Crossref
Chikhasu, D. (2007). An analysis of Malawi's trade competitiveness.Government of Malawi Ministry of Industry, Trade and Private Sector Development Integrated Framework Policy Analysis Working Paper Series,4.
DeSarbo, W. S., Degeratu, A. M., Ahearne, M. J., & Saxton, M. K. (2002). Disaggregate market share response models.International Journal of Research in Marketing,19(3), 253-266.
Indexed at, Google Scholar, Crossref
El-Jafari, M. (1996). The international competitiveness of the Palestinian agriculture.Journal of International Food & Agribusiness Marketing,7(3), 31-51.
Indexed at, Google Scholar, Crossref
Escaith, H. (2021). Revisiting constant market share analysis: An exercise applied to NAFTA.Estudios y Perspectivas – Sede Subregional de la CEPAL en México192, Naciones Unidas Comisión Económica para América Latina y el Caribe (CEPAL).
Fagerberg, J., & Sollie, G. (1987). The method of constant market shares analysis reconsidered.Applied Economics,19(12), 1571-1583.
Indexed at, Google Scholar, Crossref
FAOSTAT. (2019). Economic analysis of trade agreements-the case for small open economies-Jordan case-a training manual. Food Agriculture Organization STAT, Rome, Italy.
Gucci, R., & Caruso, G. (2010, August). Environmental stresses and sustainable olive growing. InXXVIII International Horticultural Congress on Science and Horticulture for People (IHC2010): Olive Trends Symposium-From the 924(pp. 19-30).
Indexed at, Google Scholar, Crossref
JDOS (2018). Agricultural yearbook. Volume 1. Edition 1. Jordan Department of Statistics, Amman, Jordan.
JDOS (2019). Agricultural yearbook. Volume 1. Edition 1. Jordan Department of Statistics, Amman, Jordan.
JDOS (2020). Agricultural yearbook. Volume 1. Edition 1. Jordan Department of Statistics, Amman, Jordan.
Montaño Méndez, I. E., Valenzuela Patrón, I. N., & Villavicencio López, K. V. (2021). Competitiveness of the Mexican red tomato in the international market: analysis 2003-2017.Revista mexicana de ciencias agrícolas,12(7), 1185-1197.
Poramacom, N. (2002). Revealed comparative advantage (RCA) and constant market share model (CMS) on Thai natural rubber.Kasetsart Journal of Social Sciences,23(1), 54-60.
Qtaishat, T. H., El-Habbab, M. S., & Bumblauskas, D. P. (2019). Welfare Economic Analysis of Lifting Water Subsidies for Banana Farms in Jordan.Sustainability,11(18), 5118.
Indexed at, Google Scholar, Crossref
Salamzadeh, A., Tajpour, M., Hosseini, E., & Salamzadeh, Y. (2022). Geotourism and Destination Brand Selection: Does Social Media Matter?. InEconomics and Management of Geotourism(pp. 105-124). Springer, Cham.
Indexed at, Google Scholar, Crossref
Trade Map (2020). Trade statistics for international business development. International Trade Center (ITC).
Turkekul, B., Gunden, C., Abay, C., & Miran, B. (2007).A market share analysis of virgin olive oil producer countries with special respect to competitiveness(No. 688-2016-47166).
Vollrath, T.L. (1989). Competitiveness and protection in world agriculture (No. 567). US Department of Agriculture, Economic Research Service.
Received: 16-May-2022, Manuscript No. JMIDS-22-12020; Editor assigned: 18-May-2022, PreQC No. JMIDS-22-12020(PQ); Reviewed: 01-Jun-2022, QC No. JMIDS-22-12020; Revised: 03-Jun-2022, Manuscript No. JMIDS-22-12020(R); Published: 08-Jun-2022
