Research Article: 2018 Vol: 19 Issue: 4
Financial Incentives and Academic Performance: An Experimental Study
Noemí Herranz-Zarzoso, University Jaume I
Gerardo Sabater-Grande, University Jaume I
Abstract
This paper analyzes the effect of financial incentives on academic performance by means of a randomized field experiment. Using two alternative payment mechanisms was implemented by two experimental treatments designed to motivate students depending on their absolute or relative academic performance. Subjects, recruited among students from Microeconomics, were split in two groups depending on whether they had a failed background in the aforementioned subject (returning students) or not (new students). New students were informed that they would receive a reward depending on their bet (the grade they thought would achieve) and the real grade obtained. In the case of the returning students, the reward was calculated taking into account the bet, the obtained real grade and their improvement with respect to previous semesters. In the first treatment students were rewarded according to a piece rate system whereas in the second one we established two rankings (one for new students and another one for returning students) classifying them depending on their academic performance. In both treatments it can find that the implemented incentives are effective to increase the average of grades for both types of students (new and returning), but the piece rate mechanism is more powerful to motivate a higher number of students.
Keywords
Betting for Grades, Incentives, Academic Performance, Piece Rate Mechanism, Rank-Order Tournament.
JEL Classification: C93, D03, I21, J24
Introduction
Students have grown accustomed to focus too much on the present. Appraising the present costs of studying is much easier than evaluating possible future benefits. Policy makers might see this myopic behavior as an improvement space, and might want to try to balance present costs with more immediate benefits. One approach to address the present bias is asking students to think about their academic goals and to bet for them under financial incentives that trim immediate costs. Following Herwitg & Ortmann (2001) it can state that, contrary to other social sciences like psychology, economists and, specially, experimental economists believe that “incentives matter”. Experimental economists are convinced that higher incentives will lead to more effort and higher performance. However, psychologists claim that incentives improve performance in “algorithmic” or repetitious tasks but they are less effective, or even counterproductive, at “heuristic” tasks that require creativity, concentration or intuition. Because learning has generally been classified as heuristic, it suggests that extrinsic grade incentives may not be effective motivators. The argument behind this claim is that the use of incentives could crowd out1 intrinsic motivations that are important to produce the desired behavior. In the context of education, incentives have become object of interest by economists, policymakers and researchers in the last years. Examples of this interest are recent educational reforms in the United States changing the incentives surrounding state-mandated test scores by creating penalties if students’ academic performance is not improved or if it does not reach a certain level. Outside the United States, parents and children can receive cash rewards not only for school attendance and regular check-ups (Progresa2 in Mexico), but also for student’s test scores (Kremer et al., 2009) for experiments in Kenya and Angrist & Lavy (2009) for experiments in Israel) or for college attendance (England’s Educational Maintenance Allowance, EMA, program3).
In literature, incentives have shown a moderate4 effect even assuming that they are well specified, well targeted and provided with immediacy, although the evidence is far from being conclusive.
Firstly, it was dealt with the specification of the incentives provided. This specification includes two general categories: incentives for inputs and incentives for outputs. The latter refers to student achievement, generally measured through test scores or class grades. The former means anything (reading books, doing homework, attending school, etc.) that can contribute to student learning under her control. Summarizing empirical evidence about input incentives, it has found that in developing countries there are positive effects of financial incentives on improving attendance. Such strategies may be a good policy if those are cost-effective and combined with improvements in the schools themselves. However, in developed countries, financial incentives for attendance and learning are worth trying as a means of improving attendance in secondary schools for hard-to-reach teens. Nevertheless, the use of financial incentives in combination with other improvements in teaching may be effective.
Output incentives are often opposed on philosophical issues, as “paying people to do what they should be doing anyway”. Leaving aside ethical issues about the convenience of using financial incentives to improve students’ grades, it has chosen to offer output incentives because the economic theory predicts that incentives centered in outputs work better than incentives based on inputs.
Fryer (2011) found out that output experiments demonstrate less-promising results than the input ones, as paying for performance on standardized tests had little or no effect on the outcomes for which students received financial incentives. These results are consistent with Angrist & Lavy (2009), who examined a program in Israel offering scholarships to students from low-achieving schools, and Grant & Green (2013), who analyzed how grade incentives affected student learning across a variety of courses. Mixed effects for output incentives were also found in Kremer et al. (2009). Following these mixed results, Bettinger (2012), who evaluated a pay-for-performance program for primary school students, reported a significant increase in math scores and no significant effects on reading, social science or science. More optimistic were the results obtained by Barrow & Rouse (2013). They found that the performance-based scholarships increase student effort in terms of the amount and quality of time spent on educational activities.
Unlike the previous literature, our field experiment has been specifically designed for research purposes and it is not part of any state program dedicated to improving academic results. This fact allows us to conduct a field experiment aiming to generate empirical evidence in controlled conditions under two experimental treatments. In the first treatment students are rewarded according to a piece rate system whereas in the second one we establish two rankings (one for new students and another one for returning students) classifying them depending on their academic performance.
Secondly, it was dealt with the importance of well-targeted incentives. The impacts of a randomized experiment on first-year students at the University of Amsterdam were examined by Leuven et al. (2010). The authors found that high-ability students had higher pass rates and collected significantly more credit points whenever they were assigned to (larger) reward groups. In contrast, low-ability students appeared to achieve less when they were assigned to the large reward group. The negative effects for less-able students were consistent with Camerer & Hogarth (1999). The last ones emphasized the importance of the combination between students’ ability and the performance threshold and how effort translates into achievement. The performance threshold tied to the reward could result in a binding participation constraint at the bottom of the ability distribution, which will result in zero incentive effects for low-ability students. Using empirical evidence from a large Canadian University, Angrist et al. (2009) found that a combination of the merit-scholarship with peer advising and study-group services was more effective.
A program carried out by Jackson (2010) was implemented in Texas schools serving underprivileged populations that pay both students and teachers for passing grades on Advanced Placement (AP) examinations. Using a difference-in-differences strategy, the author identified the program effect by comparing the change in outcomes of cohorts within the same school before and after the APIP (AP incentive program) adoption to the change in outcomes for cohorts comparing schools over the same time period. By comparing cohorts within the same school, Jackson eliminated self-selection within a cohort (the self-selection that ordinarily makes that one student enrolls in AP courses and another does not do so). The author concluded that program adoption was associated first with an increase on AP course and exam taking, then with the increase in the number of students with high scores, and finally with the increase in college enrollment.
Like most aforementioned field experiments were used the randomization in order to compare experimental groups. Specifically, students are randomly assigned to the treatment groups (where incentives are offered depending on absolute or relative academic performance) or to a control group (where no incentives are offered). However and strictly speaking, subjects in the treatment groups only can be considered volunteers if they explicitly declare their will to participate. Our design, requiring voluntary participation in the treatment groups, ensures a strong interest by subjects to be included in an incentivized scenario. This design strategy assures that the subjects, randomly assigned to a treatment group, who are interested in the offered incentive, will participate. To our knowledge and with the exceptions of Leuven5 et al. (2011), where students had to select themselves into different tournaments and Jackson (2010), where students had to enroll in APIP-all papers include as participants subjects who do not explicitly declare any interest in the incentive offered. Additionally, the present study is the first which allow subjects to control their own incentives, giving them the opportunity to create their own target and bet on it. This endogeneity ensures better targeted and, therefore, theoretically more effective incentives than those exogenously given by the experimentalist. This is so because subjects set their targets based on their capabilities and knowledge fitting motivations individually.
Thirdly, it was dealt with another basic issue: time intervals. Specifically, focus on the waiting time between the call and the starting of the task, and the waiting time between the accomplishment of the task and the reception of incentives (rewards). Most studies, which reward incentives based on test performance, announced the incentives well in advance of the test whereas other studies that announced incentives immediately before the test distributed the payoffs with an appreciable delay. The evidence on such delayed rewards is mixed. In this sense, O’Neil et al. (1995:1997) found that students’ effort can be increased by financial rewards offered at the time of test taking for some grade test scores. Nevertheless, this issue has no effect on other grade test scores even at very high monetary rewards. In a similar design, Baumert & Demmrich (2001) found no effects of financial incentives on ninth grade test scores. Under all experimental conditions addressed in the paper (informational feedback, grading, and performance-contingent financial rewards) both the personal meaningfulness of doing well in the test and the perceived utility of participating in the assessment program were as high as in the control condition in which the standard mathematical test instruction was used.
Levitt et al. (2011) carried out a randomized field experiment among high school freshmen, which provides monthly financial incentives for getting an achievement standard based on multiple measures of performance. It was not only varying the type of incentives (financial and non-financial), but also framing (as gains and as losses). Results were a mixed bag, finding that incentives affected student performance although it was a substantial variation across settings. In addition, it was also found out that while older students were more responsive to financial incentives, non-financial incentives were as effective as financial incentives among younger students. Furthermore, when rewards were handed out with a delay, all motivating power vanishes.
Braun et al. (2011) investigated the effects of monetary incentives on the performance of 12th graders on a reading assessment modeled on the NAEP (The National Assessment of Educational Progress) reading test. In this study the incentive was announced immediately before the test and the reward was distributed immediately after the test. The authors found that monetary incentives had a statistically significant impact on both student effort and performance overall. In our case both waiting times are reduced to a minimum: incentives are offered after the midterm exam, allowing a maximum6 two month waiting time between the offer and the final exam. After the publication of the definitive grades (two weeks after the exam), participants are immediately paid in cash.
Summing-up, our experimental design aims to maximize the efficacy of monetary incentives on academic performance, offering well-specified monetary incentives (according to a piece-rate system or a competitive ranking) delivered with immediacy once grades are obtained (well-provided) by volunteer participants (well-targeted). Moreover, objective present study is twofold: (1) to demonstrate that financial incentives based on self-chosen academic goals should to get a better academic performance, and (2) to compare a piece-rate payment mechanism with a rank-order tournament system in terms of effectiveness.
Onwards, the structure of the paper is organized as follows: first, the design of the implemented experiment; second, analyzing the empirical evidence obtained; and third, conclusions.
Experimental Design
The present study, designed a field experiment aiming to improve academic performance in a course of Microeconomics through monetary incentives offered on the basis of self-chosen goals. Two alternative incentive systems were tested: a piece-rate payment and a rank-order tournament. A piece-rate payment mechanism should be more effective upgrading average grades of all participants than a rank-order tournament system. Contrary to piece-rate payment schemes, under rank-order tournaments students’ payoffs are discontinuous in the level of exerted effort. This is so given that a marginal unit of effort increases the expected student payoff by increasing the probability of obtaining the prize, but it does not necessarily generate a higher payoff. This feature can produce convoluted behavioral effects affecting its success in improving student achievement.
The objective of an experiment is twofold. Firstly, to test whether monetary incentives based on self-chosen academic goals are capable to improve the academic performance obtained by both new and returning students. Secondly, to test the superiority of a piece-rate payment mechanism over a rank-order tournament system, in order to increase students’ grades. We implement a 2×3 factorial design where each of the three factors (type of incentives, type of student and type of payment scheme) is run at two levels. It allows us to estimate the effects of one factor at different levels of the other factors, yielding conclusions that are valid over a range of experimental conditions.
Participants were recruited among undergraduate students from Microeconomics at the University Jaume I. The evaluation structure is a midterm exam in the first half of the course and a final exam. The first midterm exam was not incentivized given that subjects did not know the existence of the future experiment, so these grades are “non-incentivized” (the experiment was not explained). Once this midterm exam was implemented, we randomly assigned students either to one of the two treatment groups (where the experiment was explained and incentives were offered) and a control group (where students did not know the existence of the experiment). The two treatment groups differed in the payment mechanism offered: a piece rate in T1 and a competitive ranking in T2. Those students randomly assigned to the treatment groups had the opportunity to participate and bet according to their individual target grade for the final exam (“bettors”) or not to participate (“non-bettors”). In the first case, students can bet according to their individual target grade. In this way, the incentive is created and controlled by the student and the final reward depends on whether the student can achieve his/her own target grade. Thus, the experiment and, of course, incentives affect the final exam grade that are the ‘incentivized’ grades although not all students enrolled in the subject have the possibility to win these incentives (only if students are randomly assigned to the treatment groups and decide to participate in the experiment could win the incentives).
Using a strategy like Jackson (2010), opened a call named “Bet for your grade and win” after the midterm exam occurred with the aim of collecting grades for each student with and without incentives in the same subject. In order to participate in the experiment subjects were asked to register on a betting system based on PHP+MySQL through our lab’s (LEE) website. Once registered, all students could bet on the highest grade they thought they could get. Among 583 students enrolled in Microeconomics (418 new student and returning students), 203 of them (142 new student and 61 returning students) attended the call to participate in this experiment.
It was shown in Table 1 that the three different treatments implemented. Students were randomly assigned to the treatment groups (T1 or T2) or a control group (T0). T0 did not offer subjects the possibility to bet for their grades, more specifically, they did not know the existence of an incentivized scenario. In T1 subjects were paid according to their absolute (piece rate) academic performance. In T2 we use a rank-order tournament6 as a payment mechanism.
| Table 1 Summary Of Treatments |
||||
| Treatments | Number of subjects | Treatment variables | ||
| New Bettors/Non-Bettors |
Returning Bettors/Non-bettors |
Incentive Midterm exam/Final exam |
Payment Mechanism |
|
| T0 | 130 | 16 | No/No | - |
| T1 | 44/20 | 25/21 | No/Yes | Piece rate |
| T2 | 98/256 | 36/83 | No/Yes | Tournament |
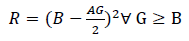
this contest the goal of voluntary participants was to maximize their monetary payoff (reward). Subjects were informed that their Reward (R) depended on their Bet (B), their Grade (G) in the actual semester and the Average of Grade(s) (AG) in previous semesters7 according to the following function:
Therefore, students were rewarded with R euros only if the Grade (G) obtained in the actual semester was equal or higher than B. It is worth mentioning that, if G ≥ B, the reward is equal for all students with identical bet independently of the obtained grade. Additionally, students were only paid if their final grade was equal or higher than 5.
Therefore, in T1 all students whose grade was equal or higher than their bet (successful bettors) earned R euros. Nevertheless, in T2 we implement two graduated8 identical tournaments (one for the new students and another for the returning ones) offering three decreasing monetary prizes for the top three students in each tournament. New and returning students were treated separately establishing a competition system that allowed them to opt to three different prizes. Two first (180 euros), second (80 euros) and third (50 euros) prizes were delivered to participants (new and returning students) according to their position in the corresponding ranking. Participants were informed in the instructions9 that the two aforementioned rankings would be published immediately after the notification of the definitive grades.
Our design requiring voluntary participation in the treatment groups allow us: (a) to compare grades corresponding to T0 to the ones obtained by all subjects randomly assigned10 to T1 (bettors and non-bettors) and (b) to compare grades from the control group to the ones obtained by bettor (voluntary participant) students. However, it has the disadvantage that results could be clouded by self-selection of the sample. In order to avoid this shortcoming, students were offered by the treatment Groups 1 and 2 the possibility to participate in the incentive program once they had been midterm examined in the subject. Hereby, it was not found significant differences between midterm grades corresponding to ex-post11 bettors and non-bettors, but it was found that, between bettors and non-bettors final12 grades, it can state that this difference is due to emerging incentives and not to self-selection of the sample.
Data Analysis
Descriptive Statistics and Distribution Functions
Table 2 depicted the average of total grades (corresponding to the sum of grades obtained in the midterm and final exams) and bets for students who participate in the incentive program. Additionally, it was shown that the percentage of bettors and success achieved (indicating percentage of final grades above or equal to bets). It is important to note that we call bettors those students randomly assigned to the treatment groups who decide to participate in the experiment and bet for the grade he/she thinks he/she will obtain. Thus, in Table 2 we show the percentage of those people betting on their grades out of the total number of participants.
| Table 2 Averages Of Bets And Total Grades (Standard Deviations Included Between Parentheses) |
|||||
| Bet average | Bettors’ total grade average |
All students’ total grade average |
Bettors ( % ) |
Success ( % ) |
|
| New Students (T1) |
6.04 (0.85) |
5.39 (1.43) |
4.89 (1.83) |
68.75 | 50.00 |
| Returning Students (T1) |
5.96 (0.73) |
5.45 (1.52) |
4.75 (1.74) |
54.34 | 44.00 |
| New Students (T2) |
6.15 (1.28) |
4.93 (1.93) |
4.14 (2.07) |
27.68 | 26.53 |
| Returning Students (T2) |
6.19 (1.09) |
5.81 (1.40) |
5.05 (1.78) |
30.25 | 41.67 |
For both new and returning students, it was observed that the average of bets placed and bettors’ average grades are quite similar between T1 and T2. However, the average of grades obtained by all new students (including bettors and non-bettors) in T1 is higher than in T2. The reason is that the percentage of (successful) bettors is higher when subjects are paid with a piece rate than with a rank-order tournament mechanism.
For returning students, it was defined like “grade improvement” as the students’ grade in the actual semester (when the incentive program is implemented) minus the grade average obtained in previous semester(s).
In Table 3, it can observe, descriptive statistics corresponding to grades from new students and grade improvements from the returning ones, before and after our call. It is important to recall that non-incentivized grades were collected in the midterm exam (where no call was opened) whereas incentivized grades were obtained after the opening. It is worth mentioning that the classification of subjects in “bettor” and “non-bettor” categories is ex-post to the midterm exam.
| Table 3 Grade averages (new students) and grade improvements average (returning students) |
||||||
| Students | Incentivized grades | Non-incentivized grades | ||||
| Bettors | Non-bettors | All | Bettors | Non-bettors | All | |
| New (T0) | - | - | 4.60 (2.09) |
- | - | 5.93 (2.49) |
| New (T1) | 5.45 (1.64) |
3.75 (2.26) |
4.92 (2.01) |
5.58 (2.16) |
5.52 (2.17) |
5.56 (2.15) |
| New (T2) | 4.91 (1.97) |
3.72 (2.14) |
4.05 (2.16) |
5.10 (2.73) |
4.69 (2.53) |
4.80 (2.59) |
| Returning (T0) | - | - | +1.54 (2.15) |
- | - | +1.55 (2,38) |
| Returning (T1) | +2.84 (1.65) |
+0.97 (1.85) |
+1.99 (1.97) |
+1.63 (3.25) |
+1.44 (2.15) |
+1.55 (2.79) |
| Returning (T2) | +2.86 (1.70) |
+1.91 (1.98) |
+2.20 (1.94) |
+3.12 (2.47) |
+3.55 (3.04) |
+3.42 (2.87) |
For new students in T1 (T2), we observe that the average of incentivized grades obtained by bettor students is 1.70 (1.19) points higher than the average of grades obtained by non-bettor students. However, the difference between the averages of non-incentivized grades obtained by bettors and non-bettors is only 0.06 (0.41). For returning students in T1 (T2), it was detected a similar pattern given that the difference between the incentivized improvement grades obtained by bettor and non-bettor students is 1.87 (0.95). This difference is much lower in the case of non-incentivized grades for both treatments. Additionally, standard deviations for incentivized grades obtained by bettor students are lower than for non-bettors in both cases (new and returning students) for both treatment groups. However, this effect is more confusing for non-incentivized grades.
Comparing T0 and T1 several issues can be studied. On the one hand, incentivized grades were analyzed. First, it was a focus on new students. Comparing the incentivized grades corresponding to T0 and corresponding to all T1 students, it can be found that they do not improve much. Nevertheless, comparing bettor students’ grades in T1 and grades in T0 observed that the difference is really noticeable. Indeed, bettor students in T1 improve in average 0.85 points more than control group students. Secondly and regarding returning students, the same pattern is found: (a) there is no difference between incentivized grade improvements corresponding to T0 and all T1 participants, and (b) there is a considerable (1.3 points) difference between the bettor students’ improvement and the control group subjects’ improvement. On the other hand, focusing on non-incentivized grades, it cannot detect the previous differences for both, new and returning students.
Comparing treatment groups (T1 and T2), it seems that there is no difference between systems of incentives (piece rate and rank-order tournament) in terms of participants’ grades.
Incentives Effect
New students
The present section was focused on the effect of incentives in new students’ grades. The design was allowed to make two types of comparisons: intra-treatment comparisons in each one of treatment groups and inter-treatment comparisons between the control group and the treatment groups.
Intra-treatment comparisons
In the first place, it was dealt with incentivized grades. In Figures 1 & 2 presents the distributions of incentivized grades obtained by bettors and non-bettors in T1 and T2 respectively.
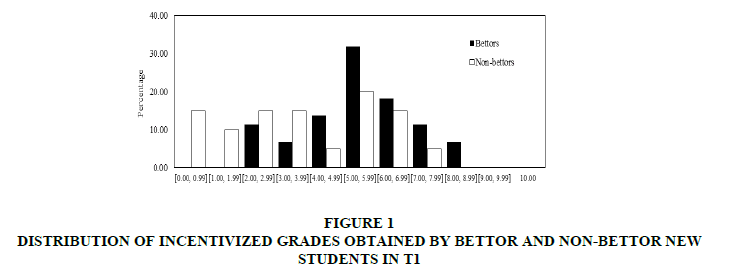
Figure 1: Distribution Of Incentivized Grades Obtained By Bettor And Non-Bettor New Students In T1
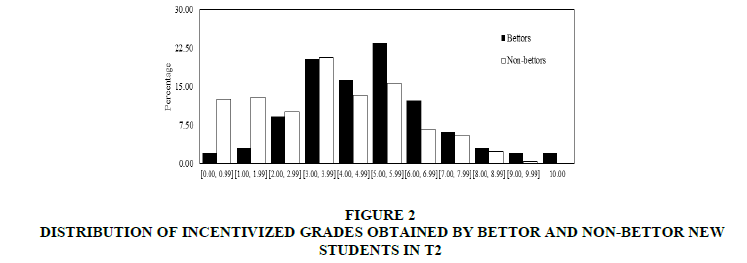
Figure 2: Distribution Of Incentivized Grades Obtained By Bettor And Non-Bettor New Students In T2
In both Figures 1 & 2 it can observe that for grades higher (lower) than 4, the percentage of bettors is higher (lower) than the non-bettors’ percentage. In addition, it was shown that incentivized grades obtained by bettor new students are normally distributed whereas the corresponding distribution of grades for non-bettors is not normal in both treatments. Therefore, in order to compare the observed incentivized grades for new students, non-parametric tests were carried out: (a) a Mann-Whitney test comparing medians from the two populations and (b) a Kolmogorov-Smirnov test comparing distributions from the two datasets.
For both treatments, from (a) we find that the median of incentivized grades obtained by bettors is significantly higher than the median of incentivized grades obtained by non-bettors (Mann-Whitney test p-values: 0.012 for T1 and 0.000 for T2. Same results are obtained with t-test). Furthermore, we are able to split our sample taking into account gender differences, finding that these previous statistically significant differences hold in the case of women and men separately (Mann-Whitney test p-values: 0.011for T1’s women, 0.001 for T2’s women, and 0.002 for T2’s men. The corresponding statistic for T1’s men is not displayed because there is not sufficient number of observations). In addition, from (b) we obtain that the distribution of incentivized grades obtained by bettors is significantly different from the corresponding distribution for non-bettors (Kolmogorov-Smirnov test p-values: 0.030 for T1 and 0.000 for T2).
In the second place we analyze non-incentivized grades. Figures 3 & 4 show distributions of non-incentivized grades obtained by bettor and non-bettor new students respectively.
Figure 3: Distribution Of Non-Incentivized Grades Obtained By Bettor And Non-Bettor New Students In T1
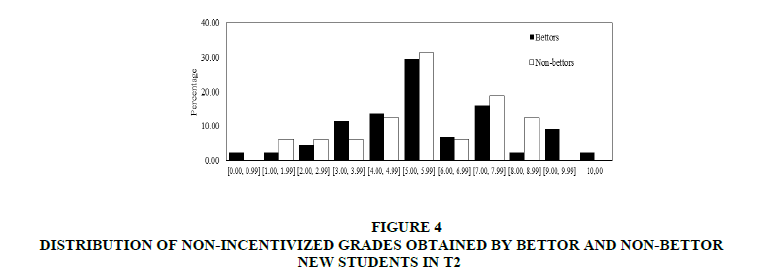
Figure 4: Distribution Of Non-Incentivized Grades Obtained By Bettor And Non-Bettor New Students In T2
Contrary to the pattern shown in Figures 1 & 2, the grades obtained by bettors are not necessarily higher than the non-bettors’ grades. Moreover, we find that both datasets are not normally distributed.
In both treatments, from (a) we find that the median of non-incentivized grades obtained by bettors is not significantly different from the median of non-incentivized grades obtained by non-bettors (Mann-Whitney test p-values: 0.940 for T1 and 0.122 for T2). Besides, splitting the sample in two different groups according to gender (women and men) no statistically significant differences are found (Mann-Whitney test p-values: 0.557 for T1’s women, 0.310 for T2’s women, and 0.338 for T2’s men. The corresponding statistic for T1’s men is not displayed because there is not sufficient number of observations). Additionally from (b), we find that the distribution of incentivized grades obtained by bettors is not significantly different from the distribution of incentivized grades obtained by non-bettors (Kolmogorov-Smirnov test p-values: 0.945 for T1 and 0.076 for T2).
Therefore, higher grades obtained by bettor new students cannot be attributed to self-selection of the sample, given that the same (ex-post) bettor students do not obtain higher grades than the non-bettors when the incentives are not yet implemented.
Inter-treatment comparisons
In this section comparison of students’ grades obtained in T0 with those in T1. Firstly, it was focused on the incentivized grades in T0. In Figure 5, distributions of bettor incentivized grades in T1 and all students’ grades in T0 and T1 were shown.
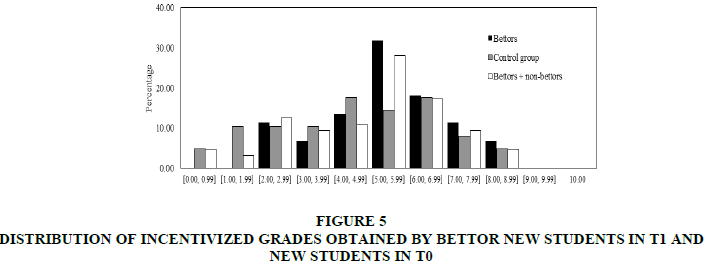
Figure 5: Distribution Of Incentivized Grades Obtained By Bettor New Students In T1 And New Students In T0
In general, with the exception of grades between 2 and 3, for grades higher than 5 the percentage of bettors is higher than the control group students’ percentage. The opposite is found for grades lower than 5. However, this behavior is not maintained if we include non-bettors students in the comparison between treatments.
Comparing bettor students’ incentivized grades in T1 with grades in T0, found from (a) that the median of incentivized grades obtained by bettors is significantly higher than the median of grades obtained by T0 students (Mann-Whitney test p-value: 0.029). The separation of the sample between women and men in the case of bettors produces no sufficient sample to be compared). Furthermore from (b), it was found that the distribution of incentivized grades obtained by bettors was significantly different from the distribution of grades obtained by T0 students (Kolmogorov-Smirnov test p-value: 0.046. Same results were obtained with t-test (both distributions are normal).
However, if it was compared that the T0 with all T1 grades (corresponding to bettors and non-bettors), it was found that the median and the distribution of incentivized grades obtained by all new students in T1 were not significantly different from the median and the distribution of incentivized grades obtained by the control group students (Mann-Whitney test p-value: 0.315 and Kolmogorov-Smirnov test p-value: 0.321). This result holds even if it was analyzed in the case of women and men independently (Mann-Whitney test p-value: 0.486 for women and 0.453 for men). These results highlighted the importance of voluntary participation in the treatment group to really measure the incentives effect.
Figure 6 displays, distributions of bettor non-incentivized grades in T1 and all students’ grades in T0 and T1. Unlike in Figure 5, it cannot observe that bettors reach higher grades than subjects in the control group.
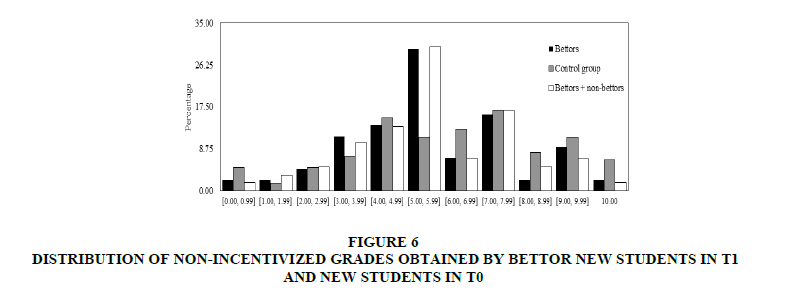
Figure 6: Distribution Of Non-Incentivized Grades Obtained By Bettor New Students In T1 And New Students In T0
Second, comparing the non-incentivized grades from T0 and the corresponding ones from bettor/all students in T1, it was found that the median and the distribution of non-incentivized grades obtained by bettor/all students in T1 were not significantly different from the median and the distribution of non-incentivized grades obtained by the control group students (Mann-Whitney test p-values: 0.301/0.233 and Kolmogorov-Smirnov test p-values: 0.198/0.123 corresponding to comparisons between grades in T0 and bettors/all subjects grades in T1, non-incentivized grades in T0 were not normally distributed). This difference is maintained when women and men are analyzed singly (Mann-Whitney p-value: 0.498 for women and 0.539 for men).
Result 1
The implementation of randomly assigned financial incentives based on relative or absolute academic performance is effective increasing grades obtained by voluntary new students. However, the inclusion of subjects not attending the call in the treatment group produces a significant diminishing in the incentives effectiveness.
Incentives only play a role that increasing academic performance when the students enrolled in the experiment are volunteer (declare their will to participate). Nevertheless, if it includes in the experiment people who were not interested in the incentives offered, the previous positive effect disappears. A potential critic could be that voluntary students may be more promising students than those who decide not to participate. In this study, it has controlled this possible effect and the result were not affected by this critic because when compared the non-incentivized grades (first midterm exam grades) obtained by ex-post bettors with non-bettors (the treatment groups were assigned after the midterm exam was implemented and they decided to participate (bettors) or not (non-bettors)), it was not found statistically significant differences. So, there were no differences in the capabilities of bettors and non-bettors before incentives were offered.
Returning students
In this section the effect of incentives in returning students’ improvements were analyzed. Like in the previous section, analysis was split in two categories: intra-treatment comparisons and inter-treatment comparisons.
Intra-treatment comparisons
In the first place, incentivized grades were focused. In Figures 7 & 8, distributions of incentivized improvement grades obtained by bettor and non-bettor students in T1 and T2 respectively. In both Figures 7 & 8, it can observe that for the best (worst) grades improvements, the percentage of bettors is higher (lower) than the non-bettors’ percentage. It can observe that both datasets were normally distributed.
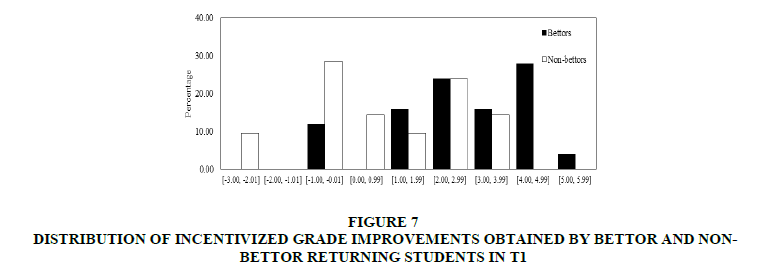
Figure 7: Distribution Of Incentivized Grade Improvements Obtained By Bettor And Non-Bettor Returning Students In T1
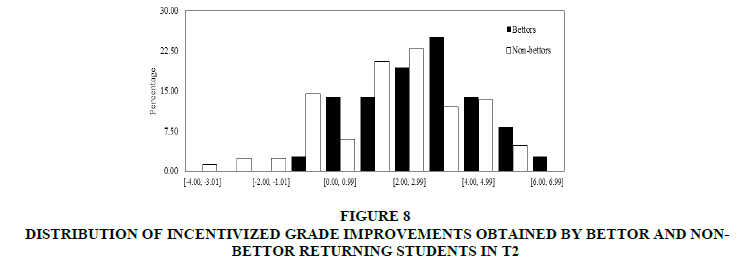
Figure 8: Distribution Of Incentivized Grade Improvements Obtained By Bettor And Non-Bettor Returning Students In T2
Therefore, in order to compare incentivized grade improvements parametric tests were used: (c) t-test comparing means from the two populations and (d) Levene test comparing variances.
As it is expected, the number of returning students is lower than the new students’ one. Thus, in the former case the gender analysis cannot be carried out because the split of the sample gives few observations in the groups of women and men separately.
In both treatments from (c) it can find that the median of incentivized grade improvements obtained by bettors is significantly higher than the median of incentivized grade improvements obtained by non-bettors (t-test p-values: 0.001 for T1 and 0.009 for T2. Nevertheless, from (b) found significant differences between distributions only for T1 (Kolmogorov-Smirnov test p-values: 0.048 for T1 and 0.243 for T2). From (d) it does not find significant differences between variances of grade improvements (Levene test p-values: 0.328 for T1 and 0.489 for T2).
In the second place, the non-incentivized grade improvements were dealt. In Figures 9 & 10 distributions of non-incentivized grade improvements obtained by bettor and non-bettor students in T1 and T2 respectively were shown. Unlike the pattern shown in Figures 7 & 8, the grade improvements obtained by bettors are not necessarily higher than the non-bettors’ grade improvements. Like in the incentivized grades case, both distributions are normal.
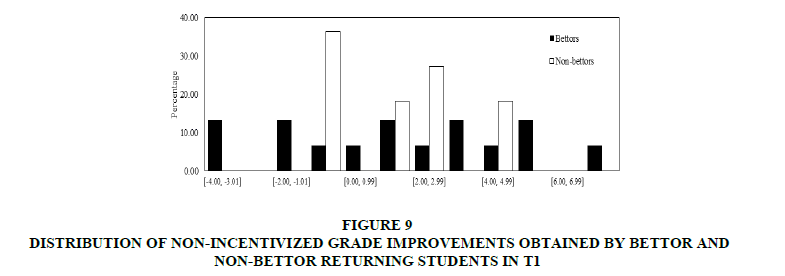
Figure 9: Distribution Of Non-Incentivized Grade Improvements Obtained By Bettor And Non-Bettor Returning Students IN T1
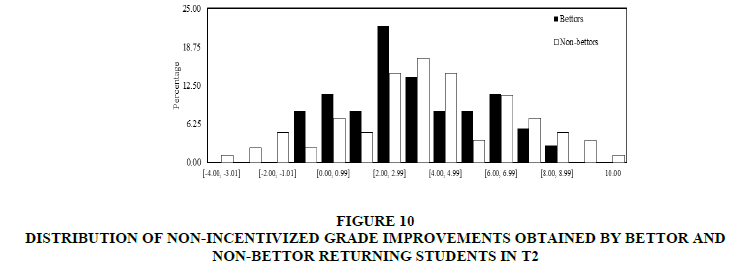
Figure 10: Distribution Of Non-Incentivized Grade Improvements Obtained By Bettor And Non-Bettor Returning Students In T2
In both treatments, from (c) it can find that the median of non-incentivized grade improvements obtained by bettor students is not significantly different from the median of non-incentivized grade improvements obtained by non-bettor students (T-test p-values: 0.867 for T1 and 0.424 for T2. Additionally, from (b) and (d), we do not find significant differences between distributions (Kolmogorov-Smirnov test p-values: 0.758 for T1 and 0.816 for T2) or variances (Levene test p-values: 0.151 for T1 and 0.256 for T1).
Thus, higher grade improvements obtained by bettor returning students cannot be attributed to sorting because without incentives the same bettor students do not reach higher grade improvements than the non-bettors.
Inter-treatment comparisons
In this section, comparison of grade improvements in T0 with the corresponding one’s in T1. Firstly, it was focused on incentivized grades in T1. In Figure 11 shows distributions of bettor incentivized grade improvements in T1 and all students’ grade improvements in T0 and T1. It can observe that, with the exception of the best improvement, bettors achieve the best improvements.
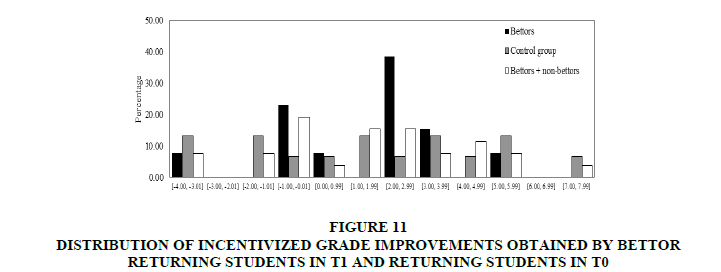
Figure 11: Distribution Of Incentivized Grade Improvements Obtained By Bettor Returning Students In T1 And Returning Students IN T0
In this case, like in the intra-treatment comparisons case, the analysis based on gender cannot be implemented because there is not sufficient number of observations for women and men separately.
Comparing bettors’ incentivized grade improvements in T1 and grades in T0, found that the median of incentivized grade improvements obtained by bettors is significantly higher than the corresponding median in the control group (T-test p-values: 0.038). Additionally from (b) and (d), it was found that the variance and distribution of incentivized grade improvements obtained by bettors are not significantly different from the corresponding variance and distribution in T0 (Levene test p-value: 0.430 and Kolmogorov-Smirnov test p-value: 0.121).
Nevertheless, if it was compared with the incentivized grade improvements from the control group and the corresponding one’s from all students in T1, it can find no significant differences between the median/variance/distribution of incentivized grade improvements obtained by all students in T1 (bettors and non-bettors) and the corresponding one’s in T0 (T-test p-value: 0.457, Levene test p-value: 0.985 and Kolmogorov-Smirnov test p-value: 0.461).
In Figure 12, distributions of bettor non-incentivized grade improvements in T1 and all students’ grade improvements in T0 and T1 were presented. Contrary to the incentivized scenario, the best improvements are not achieved by bettors.
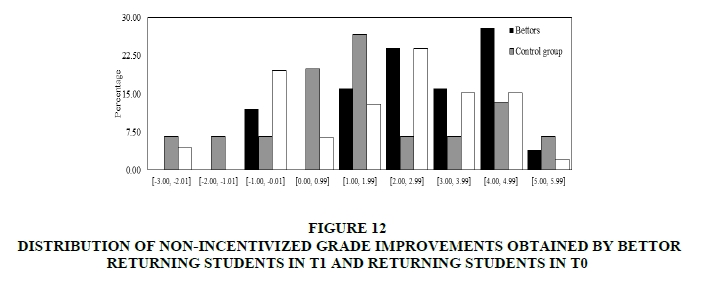
Figure 12: Distribution Of Non-Incentivized Grade Improvements Obtained By Bettor Returning Students In T1 And Returning Students In T0
Second, comparing the non-incentivized grade improvements of the control group and the corresponding one’s from bettor/all students in T1, we find that the median, variance and distribution of non-incentivized grade improvements obtained by bettor/all students in T1 are not significantly different from the corresponding ones obtained by the control group students (t-test p-values: 0.942/0.864, Levene test p-values: 0.238/0.517 and Kolmogorov-Smirnov test p-values: 0.903/0.632 corresponding to the comparisons between improvement grades in T0 and bettors/all subjects’ improvement grades in T1).
Result 2
Using both relative and absolute academic improvement as a benchmark, financial incentives randomly offered to returning students are effective only if subjects declare their will to participate in the incentive program.
This result contrasts with Grove and Wasserman (2006), who using a natural experiment found out that grade incentives to practice economics throughout the semester boosted the average freshman exam performance, but not that of academically above or below average students, or of any other category of students.
Payment mechanisms' effect
In this section, the effect of the payment mechanisms, compared the two treatments groups (T1 and T2) were analyzed. Specifically, comparing medians and distributions of (non-) incentivized grades obtained by the (non-) bettors in T1 and the corresponding one’s in T2, it does not find any statistically significant differences (all Mann-Whitney and Kolmogorov-Smirnov tests p-values are well above 0.05). The same results are found if it was compared the medians and distributions of (non-) incentivized improvement grades obtained by the (non-) bettors in T1 and the corresponding one’s in T2.
However, in treatment 1, 62.73% of the students decide voluntarily to bet for their grade whereas in treatment 2 only 28.33% of them bet. Therefore, piece rate financial incentives are better than the rank-order tournament incentives in order to reach a higher degree of motivation to participate in the incentives program. Following findings obtained by Van Dijk et al. (2001) claiming that workers with relatively low ability hard not seeming to realize that they have little chance of winning the tournament, we obtain that subjects do not bet different owing to the payment system. Namely, differences in the median/distribution of bets are not statistically significant between treatments (Mann-Whitney test p-value is 0.761 and Kolmogorov-Smirnov test p-value is 0.249).
Consequently comparing all subjects’ grades (bettors and non-bettors) between treatment groups, it can find that the median of the all subjects’ grades in T1 is significantly higher than the corresponding one in T2 (Mann-Whitney test p-value is 0.012). Besides, it was found that the distributions of final grades of both treatments are significantly different (Kolmogorov-Smirnov test p-value is 0.000). This result is explained by the fact that the piece rate payment mechanism motivates more students to bet for their grade, reaching a higher percentage of successful bettors.
Result 3
Incentives based on absolute academic performance are more effective than those based on relative performance in order to increase the average of all subjects’ grades.
Models
The previous results are not only corroborated, but also extended in this subsection. It was estimated that a model to shed light of the key determinants of the incentivized grades. Table 4 presents the model estimated by OLS.
| Table 4 OLS Models |
||
| Dependent variable Incentivized grade |
Model 1 | Model 2 |
| BetT1 | 1.520*** | 1.507*** |
| (0.233) | (0.233) | |
| BetT2 | 0.980*** | 0.969*** |
| (0.175) | (0.175) | |
| Non-incentivized grade | 0.367*** | 0.368*** |
| (0.0272) | (0.0271) | |
| Returning | 0.133 | 0.126 |
| (0.159) | (0.159) | |
| Gender | - | 0.211 |
| - | (0.136) | |
| Constant | 2.106*** | 1.997*** |
| (0.165) | (0.179) | |
| Observations | 708 | 708 |
| R-Squared | 0.268 | 0.270 |
Note: Standard errors in parentheses; ***p<0.01.
First of all, an explanation of the variables is given. The dependent variable (incentivized grade) corresponds with the grade of the final exam, where incentives were established. This variable is explained by four independent variables: BetT1 (BetT2) is a dummy variable which captures the effect of bettor students in treatment 1 (treatment 2). Non-incentivized grades are the grades of the midterm exam where incentives were not yet implemented; this is a predictor of the career path of the student within the same subject. Lastly, returning is a dummy variable which takes the value of 1 if the students have a past failure background in the subject and 0 otherwise. Moreover, in the second model t he variable Gender is included. This is a dichotomous variable, which takes the value of 1 if the subject is a woman and 0 if the subject is a man.
The estimation of the first model gives a robust effect about the incentivized scenario, which helps to reinforce the previous results. As it has mentioned previously, the piece rate payment mechanism is more effective in order to increase the grades, and this effect is illustrated by the two first variables of our model: the fact of being a bettor student in T1 increases the incentivized grade about 1.5 points whereas being a bettor student in T2 increases the same grade only 0.97 points with respect to the control group and non-bettor students, Ceteris Paribus. Furthermore, the power of the non-incentivized grade as a predictor of the career path is verified. Finally, the fact of being a returning student or not does not have influence in the grade obtained under the incentivized scenario.
The second model includes a variable of gender. The results obtained in the first model are robust and no changes in the estimation of the previous variables are produced when the dummy variable of gender is included. Although the gender of the subject does not influence the incentivized grade of subjects, this adds explanatory power to the model.
Matching all the previous effects, result 4 can be concreted.
Result 4
Incentives based on absolute academic performance are, on average, about 1.5 times more effective for voluntary bettor students than those based on relative performance, no matter either if the students have a failure background in the subject or the gender of the student.
Conclusions
Using a piece rate and a rank-order tournament as payment mechanisms has analyzed the effectiveness of financial incentives based on absolute and relative academic performance respectively. In order to achieve this goal, a randomized field experiment using new and returning students in the subject Microeconomics at the University Jaume I was implemented. Once subjects were randomly assigned to the treatment groups (where incentives were offered), our experiment required voluntary participation allowing students to bet on their own grades. Incentives were announced after a midterm exam aiming to collect grades in two cases, an incentivized and a non-incentivized scenario for each student in the same course. It was found that both implemented types of incentives are effective in order to upgrade new and returning students’ academic performance.
In the case of new students, incentives based on relative and absolute academic performance were able to significantly increase their grades. Specifically, while (non-incentivized) grades obtained in the midterm exam are not different between bettors and non-bettors, it was found that grades obtained by bettors in the incentivized scenario are significantly higher than grades obtained by non-bettors.
In the case of returning students, we analyze improvements with respect to previous grades in the same subject in other semesters. In both types, it was found that the incentives increase significantly the improvements achieved by returning students. This is so, given that it does not find differences between non-incentivized grade improvements obtained by bettors and non-bettors, whereas the incentivized grade improvements of bettors are significantly higher than the corresponding one’s obtained by non-bettors.
Moreover, the effects of the two types of implemented incentives are similar on voluntary participants; the piece rate mechanism is more effective in order to motivate subjects to bet for their own grade, reaching a higher percentage of (successful) bettors.
Finally, using the control group we reinforce our previous results about the effectiveness of the incentives to enhance the academic performance of bettor students. Precisely, in a (non-) incentivized scenario, bettors’ academic performance is (not) significantly better than the academic performance of the subjects assigned to the control group. Nevertheless, it does not find significant differences when all subjects assigned to the treatment group are considered. Indeed, this result highlights the importance of voluntary participation to properly analyze the effectiveness of the implemented incentives in this sort of settings.
Endnotes
1 Gneezy et al. (2011) state that a potential conflict arises between the direct extrinsic effect of the incentives, especially in areas like education, contributions to public goods and forming habits, in the short run and in the long run.
2 See Schultz (2004) and Attanasio et al. (2005).
3 Middleton et al. (2005) found that, while there were significant differences favoring the EMA group at ages 16-18, there were no differences at 19, and no cumulative effect on post-16 achievement.
4 Vi-Nhuan Le (2015) for a review of the literature summarizing the potential impact of incentives on test performance.
5 In our paper incentive effects are disentangled from sorting effects by means of an experimental design that allow us obtain individual data on academic performance with and without incentives in the same microeconomic course. Contrary to Leuven et al. (2011) we find that the difference in performance between students can be attributed entirely to incentive effects.
6 Students were allowed to bet until the day before the final exam.
7 Rank-order tournaments as analyzed in Lazear & Rosen (1981) are characterized by the evaluation of individual performance relative to the performance of competitors. Regarding this issue Van Dijk et al. (2001) find that tournaments lead to a higher effort on average but more variable compared to the other payment schemes.
8 Only in case of students who have a failure background in the subject in previous semesters.
9 According to Vandegrift et al. (2007) our graduated tournament (where second and third-place performers also receive a payment) should be induce lower performance than a winner-take-all tournament.
10 Available upon request.
11 Like other field experiments, which do not demand voluntary participation in the treatment group?
12 Note that at this moment subjects had not been informed about any incentive program.
References
- Angrist, J., Lang, D., & Oreopoulos, P. (2009). Incentives and services for college achievement: Evidence from a randomized trial. Journal of Applied Economics, 1(1), 136-163.
- Angrist, J., & Lavy, V. (2009). The effects of high stakes high school achievement awards: Evidence from a randomized trial. American Economic Review, 99(4), 1384-1414.
- Attanasio, O., Gomez, A., & Fitzsimons, E. (2005). The impact of a conditional education subsidy on school enrollment in Colombia.
- Barrow, L., & Rouse, C.E. (2013). Financial incentives and educational investment: The impact of performance-based scholarships on student time use. Education Finance and Policy, 1-55.
- Baumert, J., & Demmrich, A. (2001). Test motivation in the assessment of student skills: The effects of incentives on motivation and performance. European Journal of Psychology of Education, 16(3), 441-462.
- Bettinger, E.P. (2012). Paying to learn: the effect of financial incentives on elementary school test scores. Review of Economics and Statistics, 94(3), 686-698.
- Braun, H., Kirsch, I., & Yamamoto, K. (2011). An experimental study of the effects of monetary incentives on performance on the 12th grade NAEP reading assessment. Teachers College Record, 113(11), 2309-2344.
- Camerer, C.F., & Hogarth, R.M. (1999). The effects of financial incentives in experiments: A review and capital-labor-production framework. Journal of Risk and Uncertainty, 19(1-3), 7-42.
- Grant, D., & Green, W.B. (2013). Grades as incentives. Empirical Economics, 44(3), 1563-1592.
- Grove, W.A., & Wasserman, T. (2006). Incentives and student learning: A natural experiment with economics problem sets. American Economic Review, 96(2), 447-452.
- Hertwig, R., & Ortmann, A. (2001). Experimental practices in economics: A methodological challenge for psychologists? Behavioral and Brain Sciences, 24, 383-451.
- Jackson, C.K. (2010). A little now for a lot later: A look at a Texas advanced placement incentive program. Journal of Human Resources, 45(3), 591-639.
- Kremer, M., Miguel, E., & Thornton, R. (2009). Incentives to learn. Review of Economics and Statistics, 91(3), 437-456.
- Lazear, E.P., & Rosen, S. (2009). Rank and order tournament: An optimal labor contract. Journal of Political Economy, 89, 841-456.
- Leuven, E., Oosterbeek, H., Sonnemans, J., & Van Der Klaauw, B. (2011). Incentives versus sorting in tournaments: Evidence from a field experiment. Journal of Labor Economics, 29(3), 637-658.
- Leuven, E., Oosterbeek, H., & Van Der Klaauw, B. (2010). The effect of financial rewards on student’s achievement: Evidence from a randomized experiment. Journal of the European Economic Association, 8(6), 1243-1265.
- Levitt, S.D., List, J.A., Neckermann, S., & Sadoff, S. (2011). The impact of short-term incentives on student performance. Unpublished mimeo, University of Chicago.
- Middleton, S., Perren, K., Maguire, S., Rennison, J., Battistin, E., Emmerson, C., & Fitzsimmons, E. (2005). Evaluation of education allowance pilots: Young people aged 16 to 19 years.
- O’Neil, H.F. (1997). Final report of experimental studies on motivation and NAEP test performance. Los Angeles.
- O’Neil, Jr., H.F., Sugrue, B., & Baker, E.L. (1995). Effects of motivational interventions on the national assessment of educational progress mathematics performance. Educational Assessment, 3(2), 135-157.
- Schultz, P.T. (2004). School subsidies for the poor: Evaluating the Mexican progresa poverty program. Journal of Development Economics, 74(1), 199-250.
- Van Dijk, F., Sonnemans, J., & Van Winden, F. (2001). Incentive systems in a real effort experiment. European Economic Review, 45(2), 187-214.
- Vandegrift, D., Yavas, A., & Brown, P.M. (2007). Incentive effects and overcrowding in tournaments: An experimental analysis. Experimental Economics, 10(4), 345-368.
- Vi-Nhuan, L. (2015). Should students be paid for achievement? A review of the impact of monetary incentives on test performance. Norc Working Paper Series, University of Chicago.