Research Article: 2019 Vol: 18 Issue: 2
Factors Influencing Purchasing Power Parity (PPP) in Bangladesh Economy: 1986-2017
Nurul Mohammad Zayed, Daffodil International University
Fatema Nusrat Chowdhury, Daffodil International University
Md. Kamruzzaman, Daffodil International University
Md. Sariful Islam, Independent Researcher
Abstract
This paper has investigated the effect of inflation, CPI and GDP on real exchange rate. The main purpose of this paper is to find out that how much selected macroeconomic variables influencing real exchange rate in Bangladesh in 1986-2017. Firstly, the paper showed descriptive statistic. This paper tested ADF unit root for showing whether panel data is stationary or not. By testing Johansen Test for co-integration paper has shown the relationship between real exchange rate with Gross Domestic Product (GDP), Consumer Price Index (CPI) and inflation rate. The results showed that in Bangladesh Purchasing Power Parity (PPP) did not hold and there had negative relationship among those variables. For measuring the stability of the model ECM, CUSUM and CUSUMQ tests have been applied. The results showed that the model was stable during 1986-2017. So at the end of this study, it is appeared that the trend of this model will continue in the next following years in Bangladesh. Purchasing Power Parity (PPP) didn’t hold and real exchange rate is highly influenced by selected macroeconomic variables.
Keywords
Purchasing Power Parity (PPP), Gross Domestic Product (GDP), Consumer Price Index (CPI), Real Exchange Rate, Inflation Rate (INF), Error Correction Model (ECM), Augmented Dicky-Fuller (ADF) Test.
Introduction
Purchasing Power Parity (PPP) is a well-known non-classical theory of macroeconomics. It is well known because this theory indicates that in certain period of time, between two countries’ goods and services price should be equal. We can easily compare one country to another county’s production. Every economy calculates their annual production by their own currency by comparing all countries’ output determined by PPP. Generally PPP is highly concern for real exchange rates. This concept was developed for the purpose of determination of exchange rate model. In the days of financial liberalization and globalization international business were highly affected by the exchange rate not only in large economy but also is all over the world economy. In market exchange rate there is lots of limitation, like if one country’s currency value changes then exchange rate also changes. In every economy market exchange rate is determined by demand and supply, but for comparing different economy, PPP is appropriate. The objective of this research is to find out how much PPP are influenced by selected macroeconomic factors like Gross Domestic Product (GDP), Consumer Price Index (CPI) and Inflation Rate (INF). In every economy it is so much crucial to analyze which factor highly influences exchange rate for taking course of actions to develop the policies. That’s why this research topic has been selected.
Literature Review
Oskooee (1993) found a little empirical support for the PPP by analyzing data of the year 1973-1988.
Chen & Devereux (2003) found that US cities’ prices are lower compare to OECD countries. They didn’t found positive strong stationarity that might help PPP in United States of America (USA).
Hong & Phillips (2005) found that the conventional Regression Error Specification Test (RESET) gave shaking to size of distortion while using the non-stationarity time series. Their paper also showed that there had bias between non-stationarity and Regression Error Specification Test (RESET).
Christidou & Panagiotidis (2010) examined the effect of single currency in fifteen European countries on PPP are face to face US dollar ($) after and before appearance of the euro (€). Their unit root test has accepted PPP and at time stationarity didn’t support PPP.
Papell & Theodoridis (2011) examined PPP and found that it was not stronger for Non- European currency compare to European currency.
Tweneboah (2010) found a long run relationship among exchange rate, interest rate and prices in Ghana during 1997-2007. PPP and UIP didn’t hold strictly relation between USA and Ghana over period 1997-2007.
Khan & Qayyum (2011) tested Johansen co-integration and bound test to find out the existing relationship between exchange rate and PPP. Their result showed that in long run there is a positive relationship. For eliminating deviation of long run PPP, error correlation suggested that nominal exchange rate was significantly playing a role.
Oskooee & Hegerty (2009) tested unit root and co-integration test for determining the PPP. There were misting results of panel studies, co-integration test and unit root test results were highly affected by low power and didn’t support.
Hoquea & Banerjee (2012) found that real exchange rate were not constant in Sri Lanka, Pakistan, India and Bangladesh over the period of 35 years. PPP did not hold in long run in those countries by considering unit root test.
After reviewing lots of paper, different aspects of the relationship between real exchange and lots of macroeconomic variables was found. Previous studies didn’t examine the effects of macroeconomic variables like inflation, CPI and GDP on real exchange rate in Bangladesh economy. This paper attempted to address this gap.
Objectives
The purpose of the study is to find out the factors that influence PPP in Bangladesh during 1986-2017. The general objective is to measure the relationship between real exchange rate, inflation rate, CPI and GDP. The specific object of this paper is to find out the effect of inflation rate, CPI and GDP on real exchange rate in Bangladesh economy with reference to 1986-2017.
Methodology
This paper is fully based on secondary data; it didn’t attempt to deal with any primary data. For collecting data, difference sources like Bangladesh bank library, difference journal, newspapers especially world development indicator reports, different websites etc. have been used. This paper has used some macroeconomic variables like as Real Exchange Rate, Inflation Rate, CPI and GDP. To find out the stationary of time series data, Augmented Dickey-Fuller (ADF) test has been tested and Johansen long run co-integration model has been used to detect the long run association among these variables. To test the stability of the PPP model Cumulative Sum of Squares (CUSUMQ) and Cumulative Sum (CUSUM) have been used, Error Correction Model (ECM) has been applied to test structural stability. This paper also showed Descriptive statistics of variables.
Theory And Model
The purpose of using PPP is to compare level of income of different countries. When two country’s purchasing power is same and exchange rate in the point of equilibrium, PPP exist. In world economy, economist’s uses two types of PPP, one is absolute and another one is relative purchasing power parity. Absolute purchasing power parity describes the equalization of price level of the country. On the other hand, relative purchasing power parity works on the inflation rates those changes by movements of price level of a particular economy.
rt=α+β0+β1inft+β2CPIt+β3GDPt+?t (1)
In this model rt is representing the real exchange rate, inft is inflation rate, CPIt is the Consumer Price Index and GDPt is Gross Domestic Product. For examining the short run dynamic in relationship among real exchange rate, inflation rate, consumer price index and gross domestic product, an ECM model has been developed.
Δlnr=α0+ α1Δlninft-i+α2lnCPIt-i+lnGDPt-i+Δlnrt-i+ α2Ut-i+?t
Where, Ut-I=lnr2t-β0-β1lninft-β1CPI1-β1GDPt (2)
Where,
α4Ut-1-expresses the error correction term, it is the residual from the co integrating equation, α3indicated the error correction coefficient and αi are the estimated short term coefficients (Jammeh, 2012). If the real exchange rate rises (under devaluation of currency), then the growth of the economy is quite evident.
Results
Econometric Estimations
| Table 1: Descriptive Statistics | ||||
| R | INF | CPI | GDP | |
| Mean | 116.332 | 2.265 | 105.373 | 0.052 |
| Median | 155.900 | 0.078 | 121.450 | 0.053 |
| Maximum | 156.800 | 10.800 | 245.030 | 0.071 |
| Minimum | 30.410 | 0.019 | 24.280 | 0.021 |
| Std. Dev. | 50.125 | 3.876 | 45.880 | 0.013 |
| Skewness | -0.760 | 1.347 | -0.054 | -0.809 |
| Kurtosis | 1.964 | 3.058 | 4.566 | 2.972 |
| Jarque-Bera | 4.511 | 9.687 | 3.288 | 3.492 |
| Probability | 0.104 | 0.007 | 0.193 | 0.174 |
| Sum | 3722.634 | 72.498 | 3371.940 | 1.684 |
| Sum Sq. Dev. | 77887.98 | 465.858 | 65256.95 | 0.005 |
| Observations | 32 | 32 | 32 | 32 |
Source: Estimated (R=Real Exchange Rate, INF=Inflation Rate, CPI=Consumer Price Index, and GDP=Gross Domestic Product).
| Table 2: Augmented Dicky Fuller (Adf) Unit Root Test | |||
| Variable | C (constant) and T (trend) in the equation | ADF statistics | Optimum lag |
| R | C and T | -1.695 | 0 |
| INF | C and T | -5.432 | 6 |
| CPI | C and T | -0.682 | 0 |
| GDP | C and T | -3.006 | 0 |
Sources: Estimated (R=Real Exchange Rate, INF=Inflation Rate, CPI=Consumer Price Index, and GDP=Gross Domestic Product).
| Table 3: Johansen Test For Co-Integration | ||||||
| Hypothesized No. of CE(s) | Trace statistic | 0.05 Critical Value | Eigen value | Hypothesized No. of CE(s) | Max-Eigen Statistics | 0.05 Critical Value |
| None* | 53.872 | 47.856 | 0.608 | None* | 28.158 | 27.584 |
| At most 1 | 25.714 | 29.797 | 0.361 | At most 1 | 13.473 | 21.131 |
| At most 2 | 12.241 | 15.494 | 0.311 | At most 2 | 11.211 | 14.264 |
| At most 3 | 1.029 | 3.841 | 0.033 | At most 3 | 1.029 | 3.841 |
Sources: Estimated (*denoted 5% significance level).
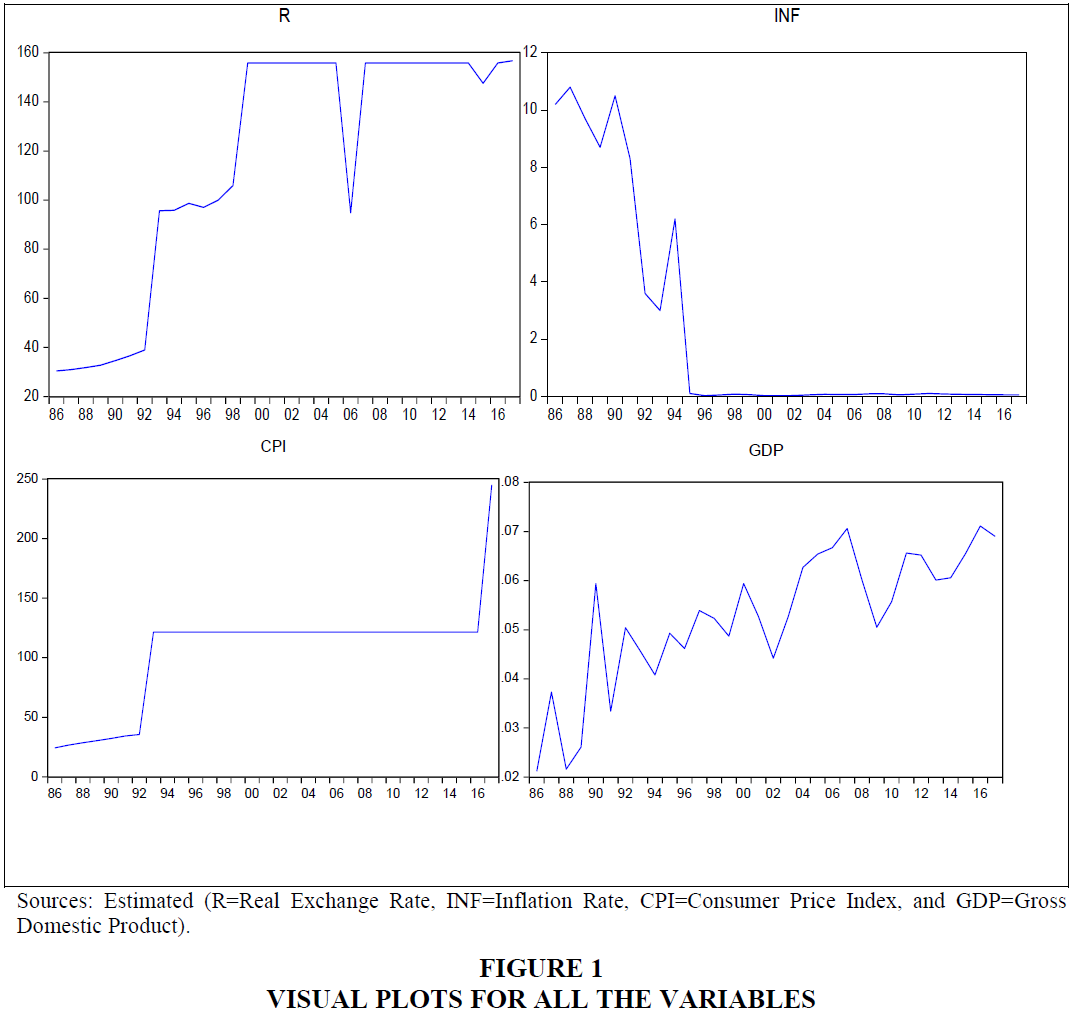
Figure 1: Visual Plots For All The Variables
| Table 4: Corresponding Adjustment Coefficients And Normalized Co-Integrating Vectors | ||||
| Variable | β coefficients | α Coefficients | Standard error | t-value |
| R | 1.000 | -3.055 | - | - |
| INF | -545.718 | -1.028 | 9.981 | 2.512 |
| CPI | -39.396 | -2.482 | 0.833 | 2.234 |
| GDP | -31583.84 | -0.001 | 950.182 | -1.319 |
| Constant | -295.655 | - | - | - |
| Table 5: Error Correction Representation | ||||
| Variable | Coefficient | Standard Error | t-value | |
| Constant | 6.681 | 4.016 | 1.663 | |
| D (RER(-1)) | -0.142 | 0.205 | -0.694 | |
| D (RER(-2)) | -0.004 | 0.195 | -0.022 | |
| D (INFLATION(-1)) | -0.076 | 0.178 | -0.427 | |
| D (INFLATION(-2)) | -0.197 | 0.145 | -1.362 | |
| D (CPI(-1)) | 0.028 | 0.531 | 0.054 | |
| D (CPI(-2)) | 0.434 | 0.455 | 0.952 | |
| D (GDP(-1)) | -0.561 | 0.213 | -2.633 | |
| D (GDP(-2)) | -0.366 | 0.208 | -1.754 | |
| D (RER) | D (INFLATION) | D (CPI) | D (GDP) | |
| R-squared | 0.543 | 0.824 | 0.245 | 0.415 |
| Adj. R-squared | 0.327 | 0.740 | -0.112 | 0.137 |
| Sum sq. resids | 5858.249 | 13.323 | 15888.39 | 0.001 |
| S.E. equation | 17.559 | 0.837 | 28.917 | 0.009 |
| F-statistic | 2.5178 | 9.891 | 0.685 | 1.497 |
| Log likelihood | -118.119 | -29.871 | -132.586 | 99.389 |
| Akaike AIC | 8.835 | 2.749 | 9.833 | -6.164 |
| Schwarz SC | 9.307 | 3.221 | 10.305 | -5.693 |
| Mean dependent | 4.312 | -0.332 | 7.461 | 0.001 |
| S.D. dependent | 21.418 | 1.644 | 27.417 | 0.010 |
Sources: Estimated (R=Real Exchange Rate, INF=Inflation Rate, CPI=Consumer Price Index, and GDP=Gross Domestic Product).
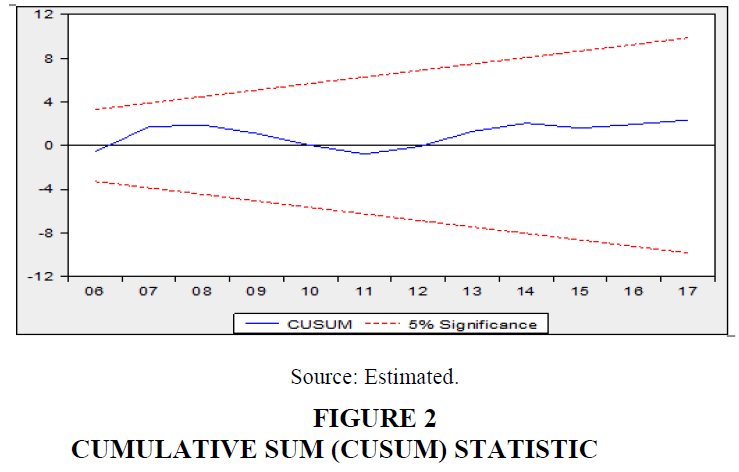
Figure 2: Cumulative Sum (Cusum) Statistic
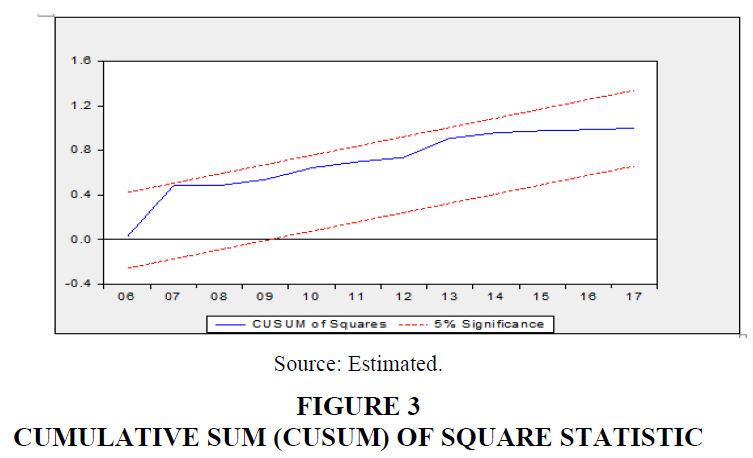
Figure 3: Cumulative Sum (Cusum) Of Square Statistic
Discussion
The descriptive statistic result showing that real exchange rate, inflation rate, consumer price index and gross domestic product are asymmetrically distributed. Table 1 also shows positive Kurtosis meaning that all variables’ distribution is peaked in this paper (Oskooee, 1993). From ADF unit root test (Table 2), it can be said that all these macroeconomic variables are stationary (Hoquea & Banerjee, 2012). By testing Johansen Test for co-integrating (Table 3) it has been estimated that at least there has 1 co integrating equation in this model, Trace statistic and Max-Eigen Statistics (Figure 1) also support this co-integrating equation (Tweneboah, 2010). From the Table 4 it can be said that there exist negative relationship among real exchange rate, inflation rate, consumer price index and gross domestic product. Here is the retrieved cointegration equation (Hong & Phillips, 2005).
rt=1.00-545.72 inft-39.4CPI-31583.84 GDPt-295.66?t (3)
From Table 5, it is very clear that the relationship among all those macroeconomic variables were stable during 1986-2017. From R-squared value it is worth of saying that the data sets is relatively good for this work. Here real exchange can be explained properly because FStatistic is robust enough at 5% significant level (Khan & Qayyum, 2011). From Figures 2 and 3, CUSUM and CUSUMQ tests suggest that this model is stable in long run.
In Bangladesh economy, there were negative relationship among real exchange rate with GDP, CPI, and inflation during 1986-2017. So, PPP didn’t hold because real exchange rate was highly influence by the macroeconomic variables. In this paper equation 3 showed that if GDP, CPI and inflation go up then real exchange rate goes down because they are negatively correlated.
Conclusion And Policy Suggestions
In Bangladesh this trend is good for economy because this research found that the relationship real exchange rate, GDP, CPI and inflation was negative within the significant level. Lower exchange rate is good for economy because if the exchange rate becomes lower, the overall economic condition becomes strong. So the government of Bangladesh and the central bank can take courses of actions for expanding for GDP.
References
- Chen, L.L., & Devereux, J. (2003). What can US city price data tell us about purchasing power parity? Journal of International Money and Finance, 22(2), 213-222.
- Christidou, M., & Panagiotidis, T. (2010). Purchasing power parity and the European single currency: Some new evidence. TÜS?AD-Koç University Economic Research Forum, Working Paper Series.
- Hong, S.H., & Phillips, P.C.B. (2005). Testing linearity in co-integrating relations with an application to purchasing power parity. Cowles Foundation Discussion Papers 1541, Cowles Foundation for Research in Economics, Yale University.
- Hoquea, A., & Banerjee, R. (2012). Does purchasing power parity hold for garment export oriented developing countries? Procedia-Social and Behavioral Sciences, 65, 8-13.
- Jammeh, K. (2012). Long-and short-run determinants of demand for money and its stability in the Gambia: An empirical investigation. Research Paper, Bachelor of Science in Economics, University of the Gambia.
- Khan, M.A., & Qayyum, A. (2011). Exchange rate determination in Pakistan: Evidence based on Purchasing power parity theory. Pakistan and Economic and Social Review, 45(2), 181-202.
- Oskooee, M.B. (1993). Purchasing power parity based on effective exchange rate and co-integration: 25 LDCs' experience with its absolute formulation. World Development, 21(6), 1023-1031.
- Oskooee, M.B., & Hegerty, S.W. (2009). Purchasing power parity in less-developed and transition economies: A review paper. Journal of Economic Surveys, 23(4), 617-658.
- Papell, D.H., & Theodoridis, H. (2001). The choice of numeraire currency in panel tests of purchasing power parity. Journal of Money, Credit and Banking, 33(3), 790-803.
- Tweneboah, G. (2010). Exchange rate modelling in Ghana: Do the purchasing power parity and uncovered interest parity conditions hold jointly? International Journal of Economics and Finance, 2(1), 3-10.