Review Article: 2023 Vol: 27 Issue: 3
Factors Affecting the Efficiency of Indian Banks using Camels Model Via Panel Data Analysis
Rashmi Soni, Somaiya Vidhyavihar University
Srijanani Devarakonda, Vignana Jyothi Institute of Management, Hyderabad
Citation Information: Soni, R., & Devarakonda, S. (2023). Factors affecting the efficiency of indian banks using camels model via panel data analysis. Academy of Marketing Studies Journal, 27(3), 1-22.
Abstract
The study aims to examine the performance of Indian banks from 2016 – 2020 using the Camels model, as well as to identify the impact of the Camels model components on the banks' performance as assessed by returns on assets, returns on equity, and net income. The Indian banking sector is the engine that drives the Indian economy. The study used a sample was the largest ten public sector banks, private sector banks, and foreign banks in India on based on the amount of highest deposits as on 31st March 2020. The banking structure has been critical in mobilizing savings and promoting economic development. The study examines the CAMELS model as a framework for analyzing and measuring the performance of banks. The performance Indian banks in terms of effectiveness was measured and observed the significance using a Panel regression model. Based on panel data from 2016 to 2020, the most remarkable finding of this analysis is that Indian banks have performed reasonably well in terms of performance.
Keywords
Bank Performance; Bank Efficiency; CAMELS Model; Capital Adequacy; Liquidity.
Introduction
According to the studies of McKinnon (1973) and Shaw (1973), there is a strong correlation between economic growth and the soundness of the country's financial system. Economic growth is a complex and continuous process that is heavily reliant on resource mobilisation, expenditure, and the operational efficiency of various economic segments. Hence, a robust financial system is essential for creating employment, optimum allocation of resources, enabling international trade, increasing foreign exchange reserves, generating wealth and growth of the economy's capital and infrastructure Gunsel, (2005); Nimalathasan, (2008) & Peterson, (2006) & Sarker (2005).
In any plan of economic development, capital formation occupies a position of strategic importance. Banks, as a financial institution, play a vital role in capital formation and the transfer of funds from saving groups to deficit groups, which use the resources to generate goods and services. Thus, a healthy banking system is the major component of a healthy financial system and evaluation of performance of banking in any economy is an effective indicator of performance of the economy.
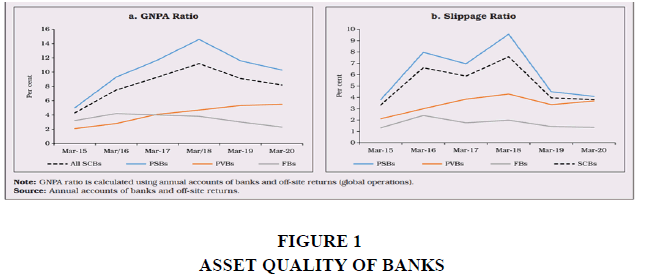
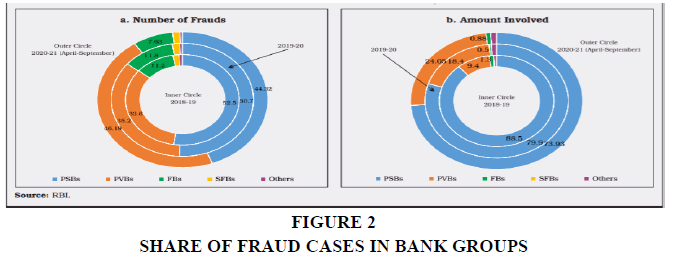
Banks form the bedrock for financial stability in an economy because of the assurance they provide to the public about the security of their funds but over the last few years, scams and NPAs have been on the rise and thus, continuous evaluation of bank performance is important in order to maintain that trust.
Bank Efficiency
Efficiency as a performance metric was first presented in the works of Edgeworth (1881) and Pareto (1927) and was empirically checked in Shephard's (1953) book. Efficiency is characterised as the ability to produce the greatest amount of output from the smallest amount of input.
A bank is considered efficient if it can generate the maximum amount of revenue by effectively utilising its resources. The efficiency ratio (ER), a commonly used indicator of bank results, is used to evaluate banks' efficiency in this report. It is characterised as a company's ability to convert capital into revenue, and it is determined by dividing the company's non-interest expenses by total income; the lower the ratio, the more efficient the company is, and vice versa.
Although it is a common belief that management usually seeks to decrease overhead costs to increase profits because the efficiency ratio is heavily dependent on overhead expense management, the Expense Preference theory by Edwards' (1977) states that management does not always plan to reduce overhead expenses and may focus on maximising individual utility instead. This may have a positive effect in the short run because it can be shown by a higher efficiency ratio, but there is no proof that practices have long-term benefits (Edwards, 1977).
There are multiple opposing views regarding which evaluation method best measures banks’ performance. The CAMEL model has been selected to assess banks’ effectiveness in the Indian context for two major reasons i.e., because it’s the most widely used and recommended model and the model’s five components cover the most important aspects of a bank’s financial statements.
According to Uyen (2011), the CAMEL method is a valuable tool for assessing banks' performance and avoiding bank failure and inefficiencies by predicting future risks and taking preventive steps. Even though there are many methods to appraise a bank's performance, the CAMEL method is one the most widely used and is recommended by the Basel Committee for Bank Supervision and the International Monetary Fund (Baral, 2005). As previously mentioned, the lower the efficiency ratio, the more efficient the bank; thus, the CAMEL variables directly and indirectly related to efficiency would be negative and positive, respectively.
As bank organisational structures are evolving, it's important to adopt an approach that involves parameters beyond ROA and ROE. Majority of researchers have concentrated on the effect of the CAMEL's five components on bank profitability so far, using ROA and ROE as performance indicators. This study aims to fill a research void by focusing on productivity rather than profitability as a proxy for success in the Indian Banking Industry.
Literature Review
Many studies have been conducted on the financial ratios of banks, such as profit (profit-asset ratio), income ratio, credit risk, liquidity risk (Migliardo and Forgione, 2018; Khalil and Siddiqui, 2019), net interest margin, return on equity (ROE) (Gupta and Mahakud, 2020), loan growth (Karim et al., 2014), and capital adequacy. Banks prioritised financial strength in order to support the economy's current expansion, accelerate investment, and maintain this rapid increase in competition (Islam et al., 2014).
For both developing and developed countries, a bank's financial strength plays an important role in development and economic progress through making effective use of existing resources, channelling needed funds to the economy, and promoting commerce and industry (Demirguc-Kunt et al., 2011; Saini and Sindhu, 2014; Fulford, 2015).
CAMELS rating is a worldwide phenomenon that affects all banking systems. It is used throughout the country and the world. It is primarily used to assess a bank's ranking position based on a few factors (Datta, 2012). Most banks throughout the world utilise the CAMEL rating as a performance evaluation technique (Raiyani, 2010). CAMELS supervisory rating system is developed and first implemented in the United States for on-site monitoring in order to evaluate banks' overall financial status. It is now utilised for both on-site and off-site monitoring (Kaya, 2001).
Asset quality is a key metric for determining financial strength. Performing loans to total loans is the ratio used to assess asset quality. This ratio has an unfavourable relationship with financial stability (Ferrouhi, 2014). Ping and Kusairi (2020) examined bank performance using Return on Asset (ROA) and then employed CAMEL components as drivers of bank performance in their study. They discovered that capital strength and earning ability have a favourable effect on performance, whereas the other three CAMEL variables had a negative effect.
Liquidity refers to a bank's capacity to meet its financial obligations and convert its assets to cash without incurring any losses. Excess liquidity reduces profitability, whereas insufficient liquidity increases the chance of insolvency. The ratio of liquid assets to total assets was used to express bank liquidity levels (Kumar & Malhotra, 2017).
Saha and Bishwas (2021), Robin et al. (2018), Islam et al. (2017), and Mahmud et al. (2016) used ROA and ROE to analyse bank performance. According to Saha and Bishwas (2021), loan loss provision, bank size, and leverage ratio are statistically important determinants of ROA, whereas macroeconomic factors have no statistically significant effect. According to Robin et al. (2018) and Yesmine and Bhuiyah (2015), capital ratio, asset quality, and bank size all have a substantial impact on bank performance. There are no studies comparing the public sector, private sector and foreign banks in India during this period of 2016 to 2020, which is just the period before the pandemic and some major mergers of banks.
This paper addresses the gap and, CAMELS model has been applied to analyse the Indian banking sector’s financial performance in terms of Effectiveness and observed significance with the help of Panel regression model. Therefore, data of 10 banks in each of the categories- public, private, and foreign for the years 2016 to 2020 have been employed.
Research Methodology
The objective is to employ the CAMELS framework to investigate various aspects of bank efficiency, with the goal of determining the effect of its six components on bank efficiency as a substitute for success. The analysis is done for three categories of selected banks in India-Public Sector Banks, Private Sector Banks and Foreign Banks.
The study will include ten banks with the highest deposits as of 31st March 2020 in each category i.e. Public, Private and Foreign Banks for the sampling period 2016-2020. The required secondary data for the CAMEL framework is drawn from RBI Database on Indian Economy and the Indian Bank Association's website.
In this study, panel data analysis is adopted to test for the hypothesis and fulfill its objective, with efficiency ratio as the dependent variable and CAMELS’ six components as the independent variables.Panel data analysis has been employed using two techniques i.e. the fixed effects to monitor for the time-invariant variables to exclude their effect on the dependent variable, and the random effects to remove the effect of variables that vary among entities, and then a Hausman test(1978) has been run to decide which of the two techniques is better.
Camels Framework
The spurt of bank failures experienced in the United States during the Great Depression of the 1940s ignited widespread concern about bank efficiency, which has developed steadily since then. Federal regulators in the United States of America created the CAMELS rating system in 1979, which included a mechanism for evaluating financial condition and individual bank results. This approach assigns a composite rating to each financial institution formed with an evaluation and ranking of six critical constituents of the institution's financial situation and functioning, which are summarised in a composite "CAMELS" rating.
A numerical scale of 1–5 is used to give composite and component scores. The bank's ratings are determined using both quantitative and qualitative information. The rating scale ranks the bank with most efficient functions at 1 and the most incompetent banks which require immediate action are ranked at 5. The CAMELS rating system allows banks to be classified based on their financial status, overall physical condition, and evaluation of their managerial, operational, and compliance performance. The CAMEL method also serves as a failure prediction model for banks.
Camils Ratios
Capital Adequacy (CA)
Capital adequacy is thought to be a primary predictor of a bank's financial soundness. In order to survive, it is important to preserve stakeholder trust while avoiding bankruptcy. Capital is thought to be a cushion that protects creditors and increases the bank's stability and performance. The overall financial status of a bank is reflected by capital adequacy. It represents whether the bank has enough resources to absorb future unanticipated losses as well as bank leverage.
Ratio: Capital Adequacy Ratio/ Capital to Risk-weighted Assets Ratio
This ratio is recommended in order to ensure that banks can absorb a fair amount of losses during operations and to determine a bank's loss bearing capability. The higher the percentage, the healthier the banks are and the better secured the investors are.
The Basel III standards required an 8% capital-to-risk-weighted-assets ratio. However, according to RBI guidelines, Indian scheduled commercial banks must maintain a CAR of 9%, whereas Indian public sector banks must maintain a CAR of 12%.
1) Asset Quality (AQ) Assessment of asset quality is essential to determining a bank's financial power. Ascertaining the composition of non-performing assets (NPAs) as a percentage of total assets is the main goal of asset quality evaluation. The standard of a bank's credit portfolio reflects its profitability. All banks want to maintain the lowest possible NPAs in order to improve profitability.
Ratio: Net NPAs to Net Advances
It is indicated as non-performing assets as a percentage of net advances. Net NPAs are derived from Gross NPAs by subtracting Net of provisions on NPAs and interest in suspense account.
2) Management Efficiency (ME)
Management performance is the subjective component of the CAMEL framework since it refers to the bank's organizational culture, management structure, ability to follow prescribed procedures, adapt to changing circumstances, and provide leadership and administrative support. However, it can be measured using various ratios that measure the elements that decide its quality level. Scholars who have researched bank efficiency concluded that management quality and efficiency are closely related; in other words, the higher the management quality, the better the efficiency, though to varying degrees.
Ratio: Total Advances to Total Deposits
This ratio measures the bank's efficiency in converting available deposits (including receivables) into advances with the best possible returns. Savings deposits, demand deposits, term deposits, and deposits from other banks all count against overall deposits. Banks with a higher total advances to total deposits ratio indicate a more efficient management and vice versa.
3) Earnings Performance (EP)
Profits earned should reflect the company's current operating performance and act as a strong predictor of future results. The quality of earnings is a critical metric that reflects a bank's profitability and ability to maintain quality and earnings over time. Banks must strive to sustain healthy profits because it not only helps them tap lucrative opportunities but also allows them to provide a consistent dividend stream to their shareholders.
Ratio: Operating Profit Ratio
The operating profit of the bank is divided by the average total assets to determine the operating profit ratio. It assesses management's ability to keep sales growth ahead of growing costs. The sum set aside for contingencies is also included in operating profit. This ratio indicates how much profit the bank will make from its operations per rupee invested in assets. Banks should aim put funds to optimum use in order to increase their operating profits and consequently, this ratio.
4) Liquidity (L)
Refers to the amount of cash at hand a bank has to fulfil its credit and cash flow needs. Banks can maintain a sufficient liquidity position by adding current liabilities or rapidly converting assets to cash. While added liquidity boosts the ability to raise cash promptly, it also decreases management's capacity to pledge to an investment plan that protects investors.
Ratio: Liquid Assets to Total Assets
This ratio represents the comprehensive liquidity status of a bank. Cash on hand, money on call and on short notice, balances with the Reserve Bank of India, and balances with other financial institutions and banks all form part of of liquid assets. Management of liquidity is critical when it comes to banks because idle cash does not yield any return and blocking all available funds in investments can cause even more trouble in case of unanticipated surge in demand for cash.
5) Sensitivity to Market Risk (S)
Sensitivity is characterized as the risk that arises as a result of changes in market conditions, which could have a negative effect on earnings as well as resources. Changes in interest rates, foreign exchange rates, commodity prices, stock prices are all examples of market risk. Although all of these factors are relevant, interest rate risk is the most significant risk for most banks. Changes in interest rates, foreign exchange rates, and stock prices are used by banks to determine the vulnerability to market risk. The changes in these factors have an effect on the bank's ability to earn money.
Ratio: Total Securities to Total Assets Ratio
This ratio expresses how vulnerable a bank is towards market risk and thus, the lower the ratio, the more effective are the bank’s operations. This ratio represents a bank's risk-taking ability. A bank's strategy is to either make high profits at the expense of high risk, or to make low profits at the expense of low risk but they keep modifying their strategies in response to changing consumer demands. The correlation between bank securities and total assets is reflected by this ratio. It also displays the percentage change in its portfolio as a result of interest rate shifts or other problems affecting the securities issuer.
Efficiency Ratio (Dependent variable)
Efficiency Ratio is widely used to analyze bank performance and is expressed as non-interest expenditures to total income. Overhead costs are divided by the total income to determine the efficiency ratio. It decides how effective a bank is at utilizing overhead expenses such as wages and benefits and other operating expenses to generate revenues.
Statement of Hypothesis
H1: There exists a significant relationship between Capital Adequacy and Bank Efficiency.
H2: There is a significant relationship between Asset Quality and Bank Efficiency.
H3: There is a significant relationship between Management Efficiency and Bank Efficiency.
H4: There is a significant relationship between Earnings Performance and Bank Efficiency.
H5: There is a significant relationship between Liquidity and Bank Efficiency.
H6: There is a significant relationship between Sensitivity to Market Risk and Bank Efficiency.
Regression Equation
ERit = α0+ β1 (Capital adequacy ratio)it + β2 (Asset Quality ratio)it + β3 (Management Efficiency ratio)it + β4 (Earnings performance ratio)it + β5 (Liquidity ratio)it + β6 (Sensitivity ratio)it + ?it
Where ?it = vi + uit
ERit= Efficiency Ratio of bank i at time t.
α0 = Intercept of relationship in the model/constant
β1 − β6= Coefficients of each independent or explanatory variable
?t = Error term or disturbance at time t.
vi = Capturing the unobserved bank effect.
uit = the idiosyncratic error.
The estimation method used is Generalized Least Squares(GLS) and Eviews11 is the software used for conducting the analysis.
Data Analysis
Public Sector Banks
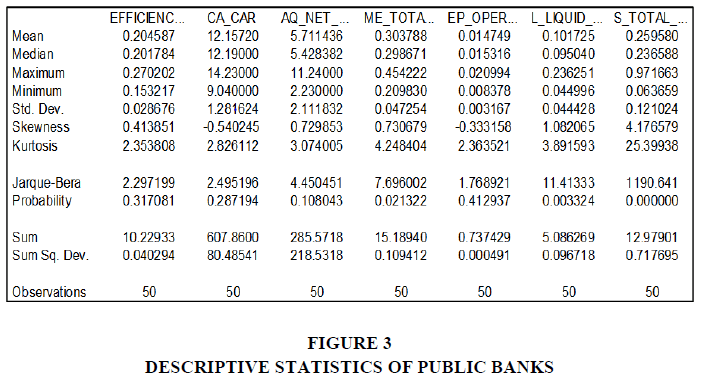
It can be noted from the Table 1 that Mean values range from 0.0147 and 12.157 with Capital Adequacy Ratio (CAR) exhibiting the highest score. This indicates public sector banks are not only meeting the minimum requirements for capital adequacy but are also well prepared to absorb unexpected losses. On the other hand Earnings Performance Ratio (EP) i.e. operating profits to Total assets has the lowest mean implying banks are making profits but there is scope for improvement.
| Table 1 Banks Selected For The Study |
||
|---|---|---|
| Public Sector Banks | Private Sector Banks | Foreign Sector Banks |
| Bank of Baroda | Axis Bank | Bank of America NA |
| Bank of India | HDFC Bank | BNP Paribas |
| Canara Bank | ICICI Bank | Citibank NA |
| Central Bank of India | IndusInd Bank | DBS Bank |
| Indian Bank | Kotak Mahindra Bank | Deutsche Bank AG |
| Oriental Bank of Commerce | The Federal Bank | JPMorgan Chase Bank |
| Punjab National Bank | The Jammu & Kashmir Bank | Mizuho Bank |
| Syndicate Bank | The Karnataka Bank | MUFG Bank |
| Union bank of India | The South Indian Bank | Standard Chartered Bank |
| State Bank of India | Yes Bank | The Homgkong and Shanghai Banking |
Values of Efficiency Ratio (ER), CAR and EP are ranging between −0.5 and 0.5; thus, these ratios are reasonably symmetrically distributed. The remaining variables ratios are positively skewed distributions. CA and AQ ratios are valued around 3 and therefore, these two variables have normal distributions. ME and Liquidity Ratios have values >3 indicating leptokurtic distributions whereas the remaining variables are platykurtic distributions.
Testing on normality is represented by the test of Skewness and Kurtosis, in which the perfect normal value for Skewness is zero while Kurtosis is three (Pevalin & Robson, 2009).
Regression Equation
Fixed Effects Model (FEM)
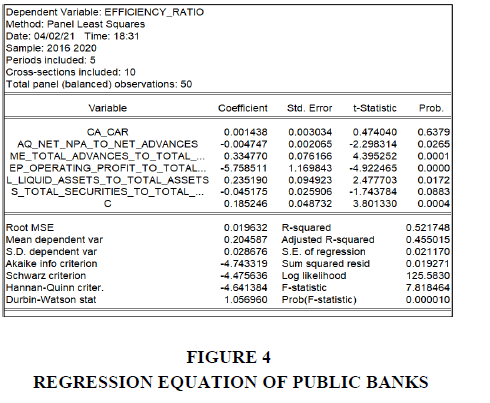
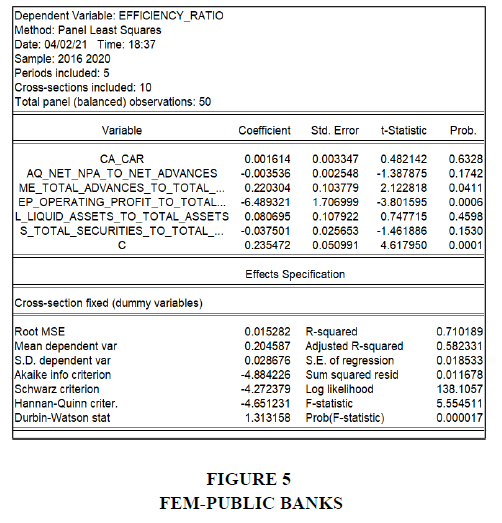
ME ratio (Total Advances to Total Deposits) and EP Ratio (Operating Profit to Total Assets ) are the only variables with a significant relationship with Efficiency Ratio, all the remaining variables are insignificant for bank efficiency at 95% confidence level since their probability values are greater than 0.05. Therefore, we reject all other null hypotheses except H3 and H4.
From the significant variables, ME ratio is positively related to Bank efficiency whereas EP impacts bank efficiency negatively. As far as the insignificant variables are concerned, CA ratio and Liquidity ratio have a direct relationship with bank effectiveness whereas Asset Quality and Sensitivity to Market Risk have a negative effect on bank efficiency.
R-squared value is 0.71 indicating these six CAMELS ratios variables account for 71% of the variance in Bank Efficiency around its mean and the remaining is due to unexplained variables.
Random Effects Model (REM)
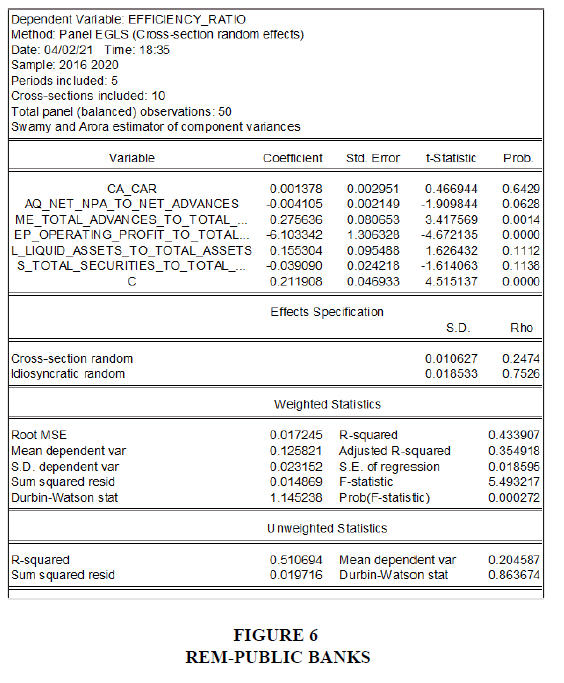
ME ratio (Total Advances to Total Deposits) and EP Ratio (Operating Profit to Total Assets) are the only variables with a significant relationship with Efficiency Ratio, all the remaining variables are insignificant for bank efficiency at 95% confidence level since their probability values are greater than 0.05. Therefore, we reject all other null hypotheses except H3 and H4.
From the significant variables, ME ratio is positively related to Bank efficiency whereas EP impacts bank efficiency negatively. As far as the insignificant variables are concerned, CA ratio and Liquidity ratio have a direct relationship with bank effectiveness whereas Asset Quality and Sensitivity to Market Risk have a negative effect on bank efficiency.
R-squared value is 0.43 indicating these six CAMELS ratios variables account for only 43% of the variance in Bank Efficiency and the remaining is due to unexplained variables. This model may not be very preferable as it takes care of less than 50% variance of response data around its mean.
Hausman Test
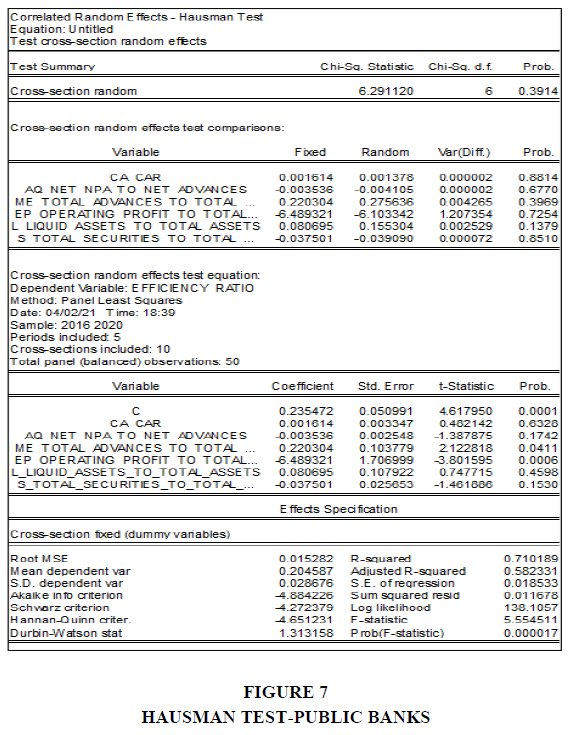
In order to take a decision regarding which model is more reliable between FEM and REM, we run the Correlated Random Effects-Hausman test.
Hypothesis Statement
H0: The random effects model is sufficient. In the panel data model, there is no meaningful association between the error term and the independent variables.
H1: The fixed effects model is sufficient. There is statistically significant correlation between the error term and the independent variables in the panel data model.
Interpretation
From the below figures 1-10 we can see that the estimated chi-square value is statistically insignificant at 95% confidence level (Probability>0.05) , we accept the null hypothesis that there exist no significant association between the independent variables and the error term in the panel data model. Hence, we can accept the Random effects model (REM) and reject the fixed effects model (FEM).
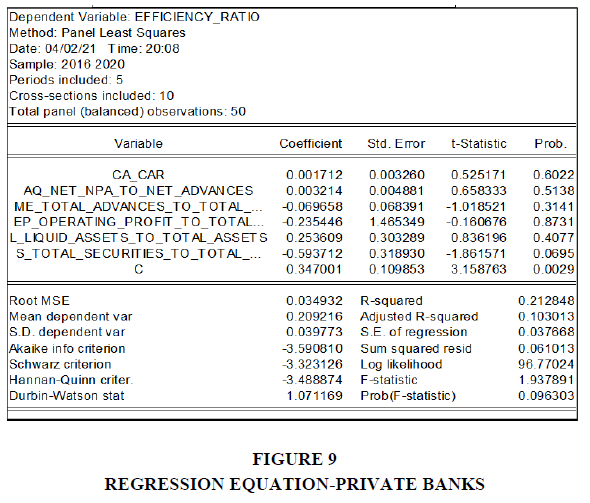
Private Sector Banks
Descriptive Statistics
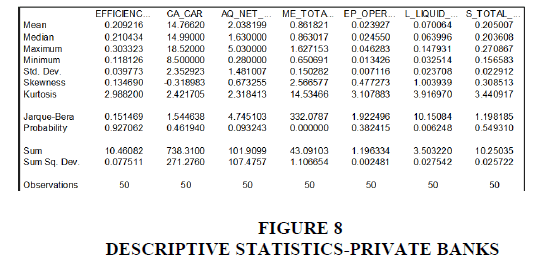
It can be noted from the above table that Mean values range from 0.024 and 14.766 with Capital Adequacy Ratio (CAR) exhibiting the highest score. This indicates public sector banks are not only meeting the minimum requirements for capital adequacy but are also well prepared to absorb unexpected losses. On the other hand Earnings Performance Ratio (EP) i.e. operating profits to Total assets has the lowest mean implying banks are making profits since the value is positive but there is scope for improvement.
Values of Efficiency Ratio (ER), CAR, EP and Sensitivity to Market Risk ratios are ranging between −0.5 and 0.5, thus these ratios are reasonably symmetrically distributed. The remaining variable ratios i.e. AQ, ME and Liquidity ratio are positively skewed distributions. Efficiency Ratio (ER), EP and Sensitivity Ratio ratios are valued around 3 and therefore, these three variables have normal distributions. ME and Liquidity Ratios have values >3 indicating leptokurtic distributions whereas the remaining variables i.e. CA and AQ ratios are platykurtic distributions.
Regression Equation
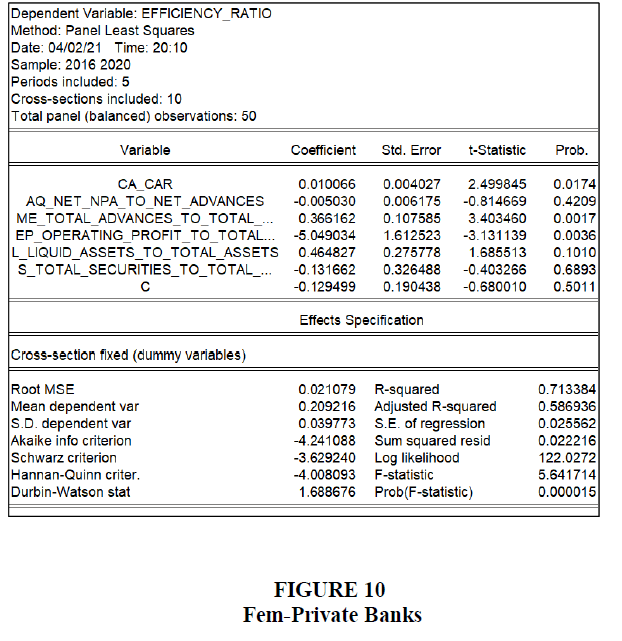
Fixed Effects Model (FEM)
CAR (Capital Adequacy Ratio), ME ratio (Total Advances to Total Deposits) and EP Ratio (Operating Profit to Total Assets ) are the only variables with a significant relationship with Efficiency Ratio, all the remaining variables are insignificant for bank efficieny at 95% confidence level since their probability values are greater than 0.05. Therefore, we only accept null hypotheses H1, H3 and H4.
From the significant variables, CA and ME ratios are positively related to Bank efficiency whereas EP impacts bank efficiency negatively. As far as the insignificant variables are concerned, Liqudity ratio has a positive relationship with bank efficiency whereas Asset Quality and Senstivity to Market Risk have a negative effect on bank efficiency.
R-squared value is 0.713 indicating these six CAMELS ratios variables account for 71% of the variance in Bank Efficiency around its mean and the remaining is due to unexplained variables.
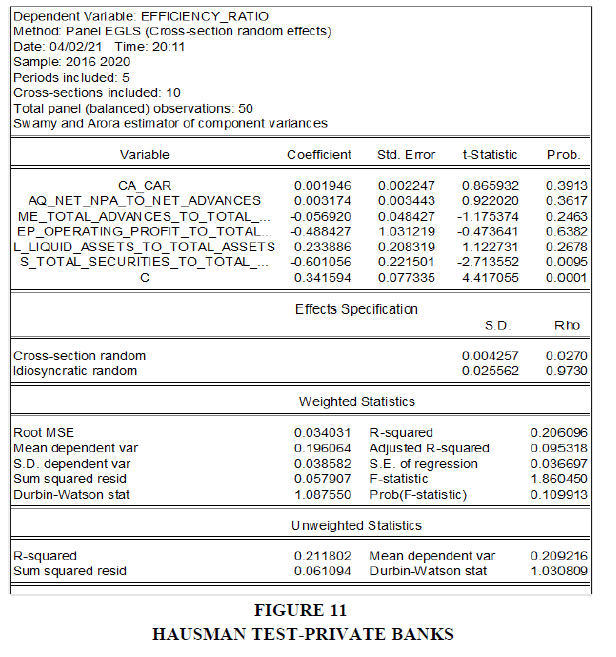
Random Effects Model (REM)
Sensitivity to Market Risk Ratio (Total Securities to Total Assets) is the only variable with a significant relationship with Efficiency Ratio, all the remaining variables are insignificant for bank efficieny at 95% confidence level since their probability values are greater than 0.05. Therefore, we will only accept null hypothesis H6 and reject all the others. Sensitvitiy to Market risk has a significant relationship with Bank Efficiency but it is a negative relationship. As far as the insignificant variables are concerned, CA, AQ and and Liquidity ratios have a positive relationship with bank efficiency whereas Management Efficiency (ME) and Earnings Performance (EP) have a negative effect on bank efficiency.
R-squared value is 0.206 indicating these six CAMELS ratios variables account for only 20% of the variance in Bank Efficiency and the remaining is due to unexplained variables. This model may not be very preferable as it takes care of less than 50% variance of response data around its mean.
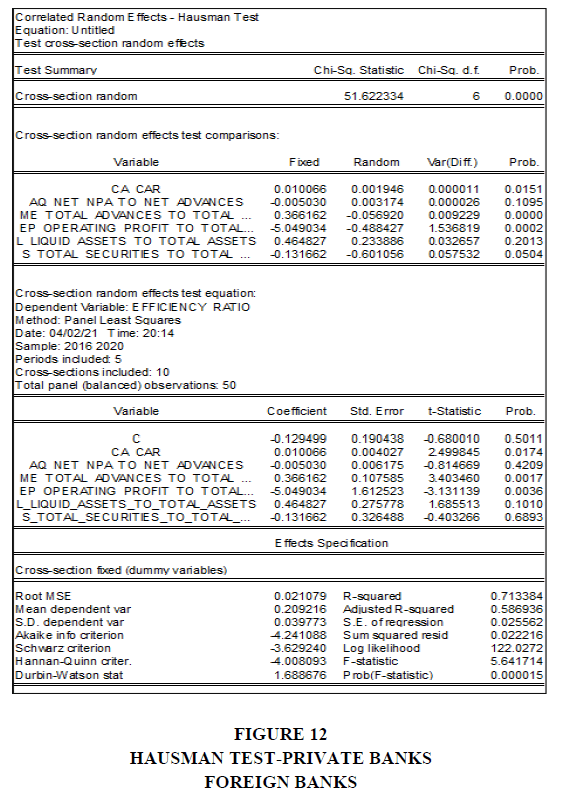
Hausman Test
In order to take a decision regarding which model is more reliable between FEM and REM, we run the Correlated Random Effects-Hausman test.
Hypothesis Statement
H0:The random effects model is sufficient. In the panel data model, there is no meaningful association between the error term and the independent variables.
H1: Fixed effects model is adequate. There is statistically significant correlation between the error term and the independent variables in the panel data model.
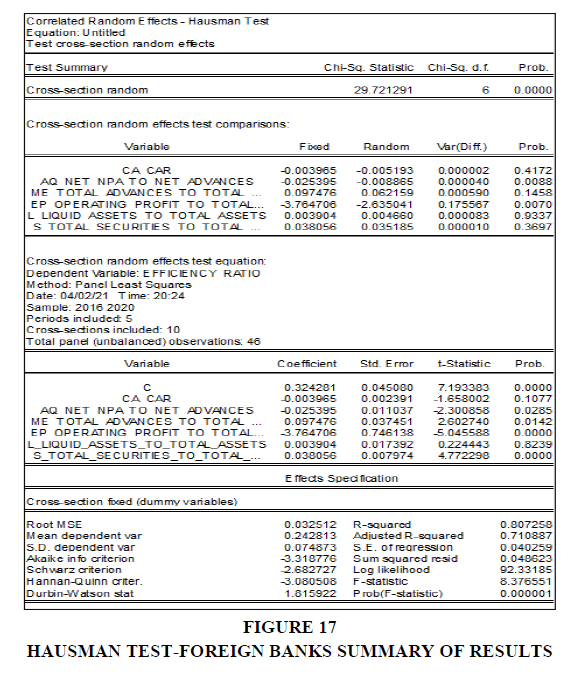
From the below figures 11-17 we can see that the estimated chi-square value is statistically significant at 95% confidence level (Probability<0.05) , we reject the null hypothesis that there exists no significant correlation among the error term and the independent variables in the panel data model. Hence, we can reject the Random effects model (REM) in favour of the Fixed effects model (FEM).
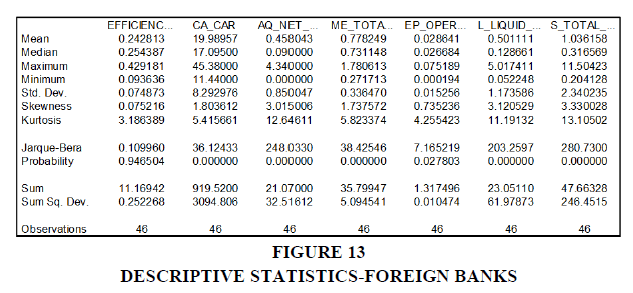
Descriptive Statistics
It can be noted from the above table that Mean values range from 0.0286 and 19.989 with Capital Adequacy Ratio (CAR) exhibiting the highest score. This indicates public sector banks are not only meeting the minimum requirements for capital adequacy but are also well prepared to absorb unexpected losses. On the other hand Earnings Performance Ratio (EP) i.e. Operating profits to Total assets has the lowest mean implying banks are making profits since the value is positive but there is scope for improvement.
All the variables have skewness values > 0.5 implying all the ratios are positively skewed distributions and have a long right tail. In the case of kurtosis, Efficiency Ratios is valued around 3 indicating a normal distribution but all the independent variables have values >3 indicating leptokurtic distributions. Testing on normality is represented by the test of Skewness and Kurtosis, in which the perfect normal value for Skewness is zero while Kurtosis is three (Pevalin & Robson, 2009).
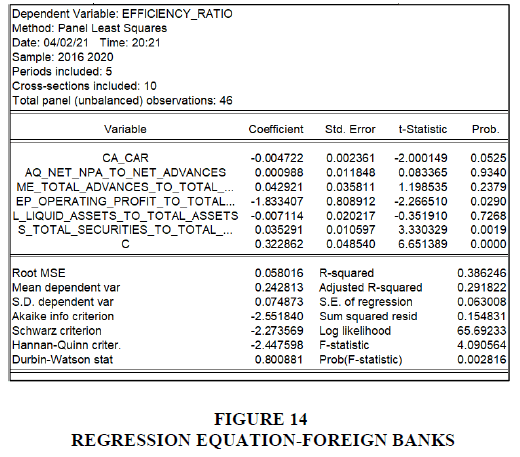
Regression Equation
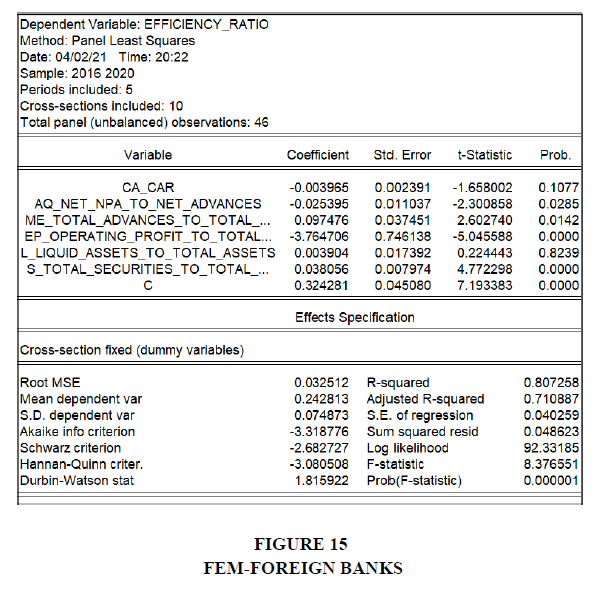
Fixed Effects Model (FEM)
AQ ratio (Net NPA to Net Advances), ME ratio (Total Advances to Total Deposits), EP Ratio (Operating Profit to Total Assets) and Sensitivity to Market Risk Ratio (Total Securities to Total Assets) are all variables with a significant relationship with Efficiency Ratio, and the remaining variables are insignificant for bank efficiency at 95% confidence level since their probability values are greater than 0.05. Therefore, we accept all null hypotheses except H1 and H5.
From the significant variables, ME ratio and Sensitivity to Market Risk Ratio are positively related to Bank efficiency whereas AQ and EP ratios impact bank efficiency negatively. As far as the insignificant variables are concerned, Liquidity ratio has a positive relationship with bank efficiency whereas Capital Adequacy Ratio has a negative effect on bank efficiency.
R-squared value is 0.807 indicating these six CAMELS ratios variables account for 80.7% of the variance in Bank Efficiency around its mean and the remaining is due to unexplained variables.
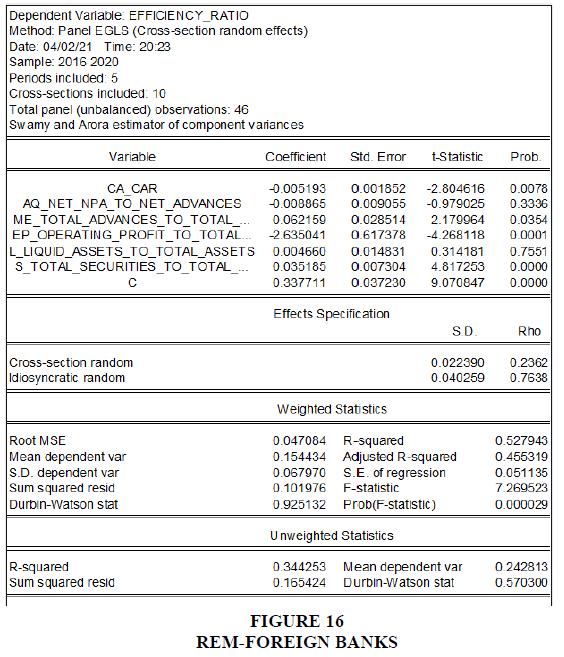
Random Effects Model (REM)
CA Ratio (Sum of Tier 1 and Tier 2 Capital divided by Risk Weighted Assets), ME ratio (Total Advances to Total Deposits), EP Ratio (Operating Profit to Total Assets) and Sensitivity to Market Risk Ratio (Total Securities to Total Assets) are all variables with a significant relationship with Efficiency Ratio, and the remaining variables are insignificant for bank efficiency at 95% confidence level since the values of their probabilities are larger than 0.05. Hence, we accept all null hypotheses except H2 and H5.
From the significant variables, ME and Senstivity to Market Risk Ratios are positively related to Bank efficiency whereas CA and EP ratios impact bank efficiency negatively. As far as the insignificant variables are concerned, Liqudity ratio has a positive relationship with bank efficiency whereas Asset Quality Ratio has a negative effect on bank efficiency.
R-squared value is 0.528 indicating these six CAMELS ratios variables account for 52.8% of the variance in Bank Efficiency and the remaining is due to unexplained variables.
Hausman Test
In order to take a decision regarding which model is more reliable between FEM and REM, we run the Correlated Random Effects-Hausman test.
Hypothesis Statement
H0: The random effects model is sufficient. In the panel data model, there is no meaningful association between the error term and the independent variables.
H1: Fixed effects model is adequate. There is statistically significant association between the independent variables and the error term in the panel data model.
The results observed from GLS, FEM and REM models and the implementation of Hausman Test showed that REM has been preferred over FEM in case of Public Sector Banks whereas FEM has been preferred over REM for Private Sector banks and Foreign Banks.
Management Efficiency and Earnings Performance have a significant relationship with Bank Efficiency across all categories of banks. Management Efficiency ratio (Total Advances to Total Deposits) has a positive relationship with effectiveness of the bank. Thus, enhancement in quality of management will lead to a higher percentage of deposits being converted in to advances thereby leading to higher bank efficiency.
On the other hand, increase in EP Ratio (Operating profits to Total Assets) reduces a bank’s efficiency since it is an inverse but significant relationship. This finding is supported by the theory that as a financial entity's profitability rises, so does its productivity, as shown by a decrease in the efficiency ratio. Capital Adequacy significantly impacts performance efficiency for Private Banks only where 1% increase in CA will increase Efficiency Ratio by an equivalent 1% as well.
In case of Foreign Banks, Asset Quality and Sensitivity to Market Risk also significantly impact Bank efficiency in addition to ME and EP. This implies foreign banks are impacted a lot more by the amount of NPAs and market shocks in terms of drastic changes in interest rates, stock prices etc. Thus, foreign banks need to have stringent policies and provisions in place to protect themselves from market risks as well as bad loans.
Asset Quality negatively impacts Bank Efficiency across all bank categories i.e. increase in Net NPA to Net Advances Ratio leads to a decrease in Efficiency Ratio. Declining asset quality observed across the financial years 2016-20 was primarily due to the large stock of nonperforming assets (NPLs). Not only were banks losing money on this non-performing portfolio, but provisioning for these loans was also eating into their earnings.
Liquidity ratio i.e. Liquid Assets to Total Assets has an insignificant relationship with Bank Efficiency across all bank categories. But this relationship is positive, indicating an increase in liquidity leads to increase in efficiency in bank performance. This is because maintaining sufficient liquidity not only helps in meeting current obligations but also enables the capability to meet unanticipated demand in future.
Conclusion
In the financial system as well as the economy, commercial banks play a critical role. Banks competently redirect funds from savers to borrowers, provide advanced financial facilities which minimize the impact of knowledge asymmetry by providing access to data about saving and borrowing options. These financial services contribute to the overall economic development of the economy.
To be efficient, the efficiency ratio, which is expressed as a percentage of sales, must be kept low. This means that banks must produce larger revenues with lesser expenses. The aim of the analysis was to investigate the effect of the CAMELS’ six components on bank effectiveness in India. Based on panel data from 2016 to 2020, the most remarkable finding of this analysis is that Indian banks have performed reasonably well in terms of performance.
Management Efficiency and Earnings Performance have a significant relationship with Bank Efficiency across all categories of banks. Capital Adequacy significantly impacts performance efficiency for Private Banks only where 1% increase in CA will increase Efficiency Ratio by an equivalent 1% as well. This implies foreign banks are impacted a lot more by the amount of NPAs and market shocks in terms of drastic changes in interest rates, stock prices, etc. Thus, foreign banks need to have stringent policies and provisions in place to protect themselves from market risks as well as bad loans.
Furthermore, banks should focus on their performance across all CAMEL components to increase their overall strength. The government should also lessen its assistance for public banks so that they can compete in the financial market like private banks and be encouraged to strengthen their financial position.
References
Baral, K. J. (2005). Health check-up of commercial banks in the framework of CAMEL: A case study of joint venture banks in Nepal. Journal of Nepalese Business Studies, 2(1), 41-55.
Indexed In, Google Scholar; Cross Ref.
Datta, R.K. (2012). CAMELS Rating System Analysis of Bangladesh Bank in Accordance with BRAC Bank Limited.
Edgeworth, F. (1881). Mathematical Psychics: An Essay on the Application of Mathematics to the Moral Sciences. Mathematical Physics. Psychology.
Indexed In, Google Scholar; Cross Ref
Edwards, S.F. (1977). The theory of rubber elasticity. Brit. Poly. J., 9: 140-143.
Indexed In, Google Scholar; Cross Ref
Ferrouhi, E. M. (2014). Moroccan Banks analysis using camel model. International Journal of Economics and Financial Issues, 4(3), 622–627.
Indexed In, Google Scholar; Cross Ref
Gunsel, N. (2005). Financial ratios and the probabilistic prediction of bank failure in North Cyprus. Editorial Advisory Board e, 18(2), 191-200.
Gupta, N., & Mahakud, J. (2020). Ownership, bank size, capitalization and bank performance: Evidence from India. Cogent Economics & Finance, 8(1), 1–39.
Islam, M.A., Sarker, M.N.I., Rahman, M., Sultana, A. and Prodhan, A. (2017), “Determinants of profitability of commercial banks in Bangladesh”, International Journal of Banking and Financial Law, Vol. 1 No. 1, pp. 1-11.
Islam, M.A., Siddiqui, M.H., Hossain, K.F. and Karim, L. (2014), “Performance evaluation of the banking sector in Bangladesh: a comparative analysis”, Business and Economic Research, Vol. 4 No. 1, p. 70.
Karim, M.A., Hassan, M.K., Hassan, T. and Mohamad, S. (2014), “Capital adequacy and lending and deposit behaviors of conventional and Islamic banks”, Pacific-Basin Finance Journal, Vol. 28, pp. 58-75.
Indexed In, Google Scholar, Cross Ref
Kaya, Y.T. (2001). Türk Bankac?l?k Sektöründe CAMELS Analizi. Bankac?l?k Düzenleme ve Denetleme Kurumu, MSPD Çal??ma Raporlar?, No: 2001/6.
Khalil, F., & Siddiqui, D. A. (2019). Comparative analysis of financial performance of Islamic and conventional banks: Evidence from Pakistan. Available at SSRN 3397473.
Indexed In, Google Scholar, Cross Ref
Mahmud, K., Mallik, A., Imtiaz, M.F. and Tabassum, N. (2016), “The bank-specific factors affecting the profitability of commercial banks in Bangladesh: a panel data analysis”, International Journal of Managerial Studies and Research, Vol. 4 No. 7, pp. 67-74.
McKinnon, R.I.. 1973. Money and capital m economic development (Brookmgs Instttutton, Washmgton, DC). Indexed In, Google Scholar, Cross Ref
Migliardo, Carlo & Forgione, Antonio. (2018). Ownership structure and bank performance in EU-15 countries. Corporate Governance International Journal of Business in Society. 18.23.
Indexed In, Google Scholar, Cross Ref
Pareto, V. (1927). Manuel d’Economie Politique. Giard et Brier, 2nd Edition.
Indexed In, Google Scholar, Cross Ref
Peterson, E.T. (2006). The big book of key performance indicators (pp. 8-10). Web analytics demystified.
Indexed In, Google Scholar, Cross Ref
Ping, K. G., & Kusairi, S. (2020). Analysis of CAMEL components and commercial bank performance: panel data analysis. Jurnal Organisasi Dan Manajemen, 16(1), 1–10.
Raiyani, J.R. (2010). Effect of mergers on efficiency and productivity of Indian banks: A CAMELS analysis.
Robin, I., Salim, R., & Bloch, H. (2018). Financial performance of commercial banks in the post-reform era: Further evidence from Bangladesh. Economic Analysis and Policy, 58, 43-54.
Indexed In, Google Scholar, Cross Ref
Saha, N.K., & Bishwas, P.C. (2021), “Determinants of financial performance of commercial banks in Bangladesh: an empirical study on private commercial banks”, Global Journal of Management And Business Research, Vol. 21 No. 2, pp. 23-32.
Sarker, A. (2005). CAMELS rating system in the context of Islamic banking: A proposed ‘S’for Shariah framework. Journal of Islamic Economics and Finance, 1(1), 78-84.
Shaw, E.S. (1973), Financial deepenmg m economic development (Oxford Universtty Press, New York).
Indexed In, Google Scholar; Cross Ref
Shephard, R. W. (1953). Cost and Production Functions. Princeton University Press.
Indexed In, Google Scholar, Cross Ref
Yesmine, S. and Bhuiyah, M.S.U. (2015), “Determinants of banks' financial performance: a comparative study between nationalized and local private commercial banks of Bangladesh”, International Journal of Business and Management Invention, 4(9), 33-39.
Received: 09-Dec-2022, Manuscript No. AMSJ-22-12987; Editor assigned: 12-Dec-2022, PreQC No. AMSJ-22-12987(PQ); Reviewed: 28-Jan-2023, QC No. AMSJ-22-12987; Revised: 22-Feb-2023, Manuscript No. AMSJ-22-12987(R); Published: 05-Mar-2023
