Research Article: 2025 Vol: 29 Issue: 2S
Examining the Impact of ESG Performance on the Brand Value of Indian Firms
Pinku Paul, Management Development Institute Murshidabad, West Bengal
Neeraj Singhal, Management Development Institute Murshidabad, West Bengal
Citation Information: Paul, P., & Singhal, N. (2025). Examining the impact of esg performance on the brand value of indian firms. Academy of Marketing Studies Journal, 29(S2), 1-12.
Abstract
The study delves into the association between a company's ESG (Environmental, Social, and Governance) performance and its brand value. Using pooled regression and the development of four models, the data from the top 50 brands in 2022-2023 was thoroughly analyzed. The study found that ESG performance positively influences brand value, with the Environmental and Social scores contributing positively, while the Governance scores have a notably adverse effect. This insight underscores the critical importance of ESG considerations in enhancing brand value and overall corporate reputation.
Keywords
Brand Value, Indian Firms, ESG, Environmental, Social, Governance, Innovation.
Introduction
Over the period, environmental, Social, and Governance (ESG) indicators appeared as a critical driver for the firm’s financial and overall performance. Many researchers and organizations explored the inferences by establishing the association between stakeholders and firm performance parameters. Freeman's (2010) study is the directive research work focused on information asymmetry and ESG performance of the firm with stakeholder’s lenses. According to Provasnek et al. (2017), in the initial years of ESG adaptation and execution, corporate concerns were related to its consequences on business activities, revelation, and R&D costs. Still, over the year researchers explored that ESG has positive effects on lengthy period profits, corporate value and enlightening social dependability.
Duque-Grisales & Aguilera-Caracuel (2021) explored the impact of ESG on firm performance considering the accounting parameters. Friede et al. (2015) found a positive association between ESG activities and financial performance in 63% of companies. The study's sample size was 2000, and the time frame was 1970 onwards. Alareeni and Hamdan (2020) reconfirm the connection between ESG activities and financial performance in the US S&P 500 company’s sample.
Sen and Bhattacharya (2001) refereed the congruence theory with an experimental data set and found that corporate social responsibility (CSR) initiatives can enhance consumer intentions; on the other side, Menon and Kahn (2003) used the persuasion knowledge theory and concluded that consumer elaboration levels affect perceptions of CSR. Klein and Dawar's (2004) study was based on attribution theory and findings that CSR improves consumer brand evaluations. Simmons et al. (2006) study referred to the brand fit theory. Nan et al. (2007) mentioned that advertisements with embedded customer relationship management would create a favorable consumer perception of a firm. Reed et al. (2007) found that utilizing consumer ethical identity enhanced firm brand value. Conversely, Andersen (2009) explored how environmental factors determine the actual management of CSR practices.
Lai et al. (2010) mentioned that CSR impacts brand performance. Lii et al. (2012) referred to the reputation theory and concluded that CSR initiatives significantly impact brand attitude. Olsen et al. (2014) explored how introducing new green products can improve brand attitudes. Sierra et al. (2017) mentioned that CSR affects brand equity. Bardos et al. (2020) study refereed the resource based theory and shareholder theory to prove that CSR positively affects the market perception of product. Lee et al. (2022) used the signaling theory and mentioned that automotive brands could deliver ESG signals through social media for brand valuation. According to Yu et al. (2023), ESG habits affect brand repute and consumer purchase intent to buy that brand. Holden et al. (2017) state that ESG management and procedures are expected to derive enormous corporate innovation and transformation. This paper conceptualized to study the impact of ESG performance on brand value in the Indian context. The study also tries to examine the impact of individual environmental, social, and governance scores on the brand value of companies. For this purpose, the study has also considered certain control variables, out of which the companies' innovation level is important in establishing the association between ESG performance and brand value.
The study has been designed in five sections: the first relates to the Introduction, followed by a review of the literature with hypothesis development. The third section refers to the research methods with the empirical model. The fourth section highlights the study's results, followed by the discussions, and the last section concludes the study.
Review of Literature and Hypothesis Development
ESG Evolution and Corporate Integration
Balachandran, and Faff (2015) mentioned that environmental, social, and governance factors collectively and individually enhanced corporate value. Although the researchers explored a divergent perspective over the period, the intensity of the impact of individual factors may be different in different firms and industries. Many researchers mentioned that overall ESG performance enhanced corporate value (Taliento et al., 2019; Yoon et al., 2018). Freeman (2010) brought the stakeholder's theory perspective and mentioned that stakeholders help the organization in achieving the overall organizational goals.
Communication among stakeholders is another perspective highlighted by the researchers for ESG integration. Jin. X and Lei. X (2023) referred to signaling theory and mentioned its relevance for enhancing stakeholder communication and effectively executing ESG for organizational growth. Li et al. (2019) referred to the resource-based theory. They mentioned that investment in environmental management and environmental technologies not only helps firms increase more market share but may also improve economic efficiency.
ESG Alignment with Brand Value
According to Davies et al. (2003), brand repute is a unanimous type of corporate worth built over a period and matters a lot for growth and profitability. Muñoz-Torres et al. (2018) mentioned that those companies that voluntarily adopted ESG practices had higher ESG scores, social impact, and brand value. According to Yu et al. (2023), brand reputation is closely related to adapting ESG practices for company growth and sustainable management, and ESG practices have an important impact on brand and corporate reputation. According to Jukemura (2019), firms that prioritize ESG activities have a proven track record of gaining a competitive edge and building strong brand reputations. According to McKinsey's (2019) report on five ways that create value, ESG activities not only positively impact the company's financial performance but also significantly affect brand assets and brand value. Giese et al. (2019) mentioned that firms executing more ESG activities generate higher profits due to the efficient usage of resources.
ESG & Innovation
Continuous innovation in products, technologies, and services can increase the organization's growth and profitability and improve the company's ESG performance. Improved ESG performance can lead the organization towards better innovation and achieving superior goals (Pavelin, S.; Porter, L.A ;2008, Zhang et al.; 2013). According to Shen and Ma (2014) and Luo and Du (2015), organization efforts towards environmental concerns may reduce the financing cost of the enterprise and also can enhance enterprise innovation capabilities. Enterprise efforts towards social responsibility can create stronger communication among stakeholders, further enhancing organizational innovation (Zhang et al., 2013). Yang (2020) mentioned that good corporate governance is important for creating a culture of innovation and enhancing corporate development.
According to Jin and Lei (2023), corporate ESG can enhance corporate value and improve innovation scenarios in the enterprise. Corporate investment in social responsibilities may also drive the enterprise's innovation culture and can further enhance enterprise value. Li and Yang (2019) mentioned that social responsibility may be enhanced by improving corporate innovation, which can further lead the enterprise towards improving corporate value. Improving corporate governance can also promote a culture of innovation and enhance corporate value Jin and Lei (2023).
After having an in-depth review of the literature, the study conceptualized the following hypothesis:
H1: ESG performance has a positive impact on brand value.
H2: Environmental performance has a positive effect on brand value.
H3: Social performance has a positive impact on brand value.
H4: Governance performance has a positive impact on brand value.
Research Methodology
The study sample comprises the 50 best firms listed in the Best Indian Brands 2023 report from brandfinance.com. The relevant data was gathered from CMIE Prowess IQ. The data was considered 2022-2023.
The study's dependent variable measures the organization's brand value (BV). The independent variable was the ESG parameters with Escore, Sscore, Gscore, and the composite ESG Score. The control variables used in the study to control the external factor impact were the firm’s age, innovation, advertising expenses, sales growth, leverage, profitability, and fixed asset composition. The parameters of the components are given in Table 1.
| Table 1 Measurement of Components | |||
| Components | Name | Code | Measure |
| Dependent Variable | Brand Value | BV | Contemplated from Best Indian Brands 2023 report from brandfinance.com. Natural Logarithm of Brand Value |
| Independent Variable | Environment Social and Governance Score | ESGScore | Contemplated from CRISIL-ESG-2022 Report Natural Logarithm of ESG Score |
| Environment Score | EScore | Contemplated from CRISIL-ESG-2022 Report Natural Logarithm of E Score |
|
| Social Score | SScore | Contemplated from CRISIL-ESG-2022 Report Natural Logarithm of S Score |
|
| Governance Score | GScore | Contemplated from CRISIL-ESG-2022 Report Natural Logarithm of G Score |
|
| Control Variable | Innovation | Innov | Natural Logarithm of Research and Development Expenses |
| Age | Age | Natural Logarithm of Age of the Firms Since Incorporation | |
| Sales growth | Salesgr | Natural Logarithm of (Salest – Salest-1)/ Salest-1 | |
| Advertising expenses | Adv | Natural Logarithm of Advertising Expenses | |
| Profitability | ROA | Natural Logarithm of Profit after tax/ Total assets | |
| Leverage | LEV | Natural Logarithm of Total liabilities/ Total assets | |
| Fixed Asset Ratio | FARatio | Natural Logarithm of Total fixed assets/ Total assets | |
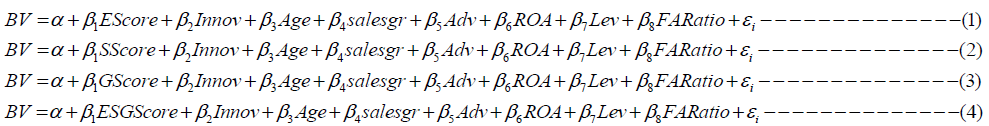
Empirical Model
A pooled OLS regression technique has been adopted to test the hypothesis and establish the association between firms' brand value and ESG parameters. The relationship is explained in the equations given below:
Results and Discussions
Table 2 represents the result of the descriptive statistics. The variable BV has a mean of 71.90 and a Standard Deviation (SD) of 61.82, with a highest of 214.95 and a lowest of 12.12. The following variable, EScore, has a mean of 57 and SD of 10.62, with a highest of 73 and a least of 41 scores. The independent variable SScore has a mean of 58.41 and SD of 5.40, with a extreme of 70 and a bare smallest of 50. The following variable, GScore, has a mean of 70.83 and SD of 5.07, with a greatest of 80 and a smallest of 64. The composite ESGScore, had a mean of 62.91 and SD of 5.96 with a utmost of 71 and a lowest of 54. The control variable, Age, has a mean of 52.66 and an SD of 29.41, with a extreme of 112 and a lowest of 22. The variable Salesgr has a mean of 0.20 and an SD of 0.25. The following variable, Adv, has a highest of 980.63 with a lowest of 59.50. The variable ROA has a mean of 12.06 and SD of 6.74. The variables LEV and FARatio have a mean of 0.076 and 0.28, respectively.
| Table 2 Descriptive Summary | ||||
| Variables | Mean | Standard Deviation | Minimum | Maximum |
| BV | 71.9050 | 61.8233 | 12.1200 | 214.9500 |
| Escore | 57.0000 | 10.6259 | 41 | 73 |
| Sscore | 58.4167 | 5.4013 | 50 | 70 |
| Gscore | 70.8333 | 5.0782 | 64 | 80 |
| ESGScore | 62.9167 | 5.9614 | 54 | 71 |
| Innov | 144.0900 | 195.8867 | 11.6800 | 648.7000 |
| Age | 52.6667 | 29.4104 | 22 | 112 |
| Salesgr | 0.2051 | 0.3570 | -0.1381 | 1.2791 |
| Adv | 460.4917 | 304.8204 | 59.5000 | 980.6300 |
| ROA | 12.0696 | 6.7412 | 1.1661 | 24.8658 |
| LEV | 0.0769 | 0.1029 | 0.0041 | 0.3250 |
| FARatio | 0.2818 | 0.1525 | 0.0947 | 0.5619 |
From Table 3, it was inferred that the pairwise correlation and the VIF of the variables used in the study are significant. The dependent variable, BV, is positively associated with Innov and Adv. The Escore, SScore, and Gscore have significant positive associations with ESGScore. The EScore also has a significant positive association with ROA. Similarly, the Salesgr has a significant positive association with ROA.
| Table 3 Correlation Analysis and VIFS | |||||||||||||
| Variable | BV | Escore | Sscore | Gscore | ESGScore | Innov | Age | Salesgr | Adv | ROA | LEV | FA Ratio |
VIFs |
| BV | 1 | - | |||||||||||
| Escore | 0.3269 | 1 | 3.29 | ||||||||||
| Sscore | -0.1149 | 0.4451 | 1 | 1.68 | |||||||||
| Gscore | -0.0021 | 0.5408 | 0.5728 | 1 | 1.65 | ||||||||
| ESGScore | 0.1639 | 0.9070* | 0.6929* | 0.8043* | 1 | 2.30 | |||||||
| Innov | 0.7281* | 0.1286 | -0.2081 | -0.3971 | -0.122 | 1 | 2.31 | ||||||
| Age | 0.1653 | 0.4439 | 0.0072 | 0.0982 | 0.3602 | -0.0805 | 1 | 1.74 | |||||
| Salesgr | -0.1326 | 0.3519 | 0.05 | 0.2257 | 0.2781 | -0.2138 | -0.2704 | 1 | 8.15 | ||||
| Adv | 0.7273* | 0.2644 | -0.238 | 0.087 | 0.1422 | 0.4019 | 0.4058 | -0.4787 | 1 | 5.62 | |||
| ROA | 0.0957 | 0.6085* | 0.0416 | 0.5248 | 0.5578 | -0.2839 | 0.1023 | 0.6070* | 0.202 | 1 | 5.88 | ||
| LEV | -0.4203 | -0.5224 | -0.1846 | -0.2279 | -0.4749 | -0.321 | -0.3003 | -0.1097 | -0.1596 | -0.2471 | 1 | 1.65 | |
| FA Ratio |
-0.2227 | -0.3788 | -0.1995 | -0.234 | -0.3501 | -0.1405 | 0.0907 | -0.313 | -0.117 | -0.5663 | 0.1191 | 1 | 1.79 |
Source: authors’ work.
After conducting an exhaustive analysis of the Variance Inflation Factors (VIFs) for all variables (independent and control), it was ascertained that each of their respective VIF values remained below the established threshold of 10. This outcome indicates the absence of any significant issue with multicollinearity.
Table 4 presents the pooled OLS regression results of the four models. BV was the dependent variable of all four models. Model-1 results indicate that R Square was reported as 0.9809, indicating a strong association between the BV, the unrelated variables, and the control variable. The model is significant, as the P value reported is 0.000. So, it can be interpreted that the Escore and all the control variables Innov, Age, Salesgr, Adv, ROA, Lev, and FARatio were statistically significantly associated with the BV. Model-2 results specify that R Square was reported as 0.9829, which implies an effective connection between the BV, the independent variables, and the control variable. The model is significant, as the P value reported is 0.000. Therefore, it can be inferred that the SScore and all the control variables Innov, Age, Salesgr, Adv, ROA, Lev, and FARatio were statistically significantly connected with the BV. Model-3 findings signify that R Square was reported as 0.9801, revealing a solid association of BV with the independent and control variables. The model is noteworthy, as the P value reported is 0.000. Thus, the GScore and all the control variables Innov, Age, Salesgr, Adv, ROA, Lev, and FARatio were statistically considerably related to the BV.
| Table 4 OLS Regression Results | ||||
| Dependent-BV | Model-1 | Model-2 | Model-3 | Model-4 |
| Coefficient | Coefficient | Coefficient | Coefficient | |
| Escore | 0.2553* | - | - | - |
| Sscore | - | 0.6825* | - | - |
| Gscore | - | - | -0.1388* | - |
| ESGScore | - | - | - | 0.2675* |
| Innov | -0.1089* | -0.06834* | -0.1116* | -0.1015* |
| Age | -0.3232* | -0.2972* | -0.2860* | -0.3041* |
| Salesgr | 2.5206* | 2.5060* | 2.6121* | 2.5687* |
| Adv | 1.4394* | 1.4309* | 1.4666* | 1.4516* |
| ROA | -0.06195* | -0.05441* | -0.0609* | -0.0614* |
| LEV | -4.7139* | -4.5569* | -4.8983* | -4.7634* |
| FARatio | -1.0604* | -0.8904* | -1.1006* | -1.0684* |
| constant | -2.8989* | -5.0151* | -1.5739* | -3.1632* |
| R2 | 0.9809 | 0.9829 | 0.9801 | 0.9803 |
| Prob > F | 0.000* | 0.000*** | 0.000*** | 0.000*** |
Source: authors’ work.
Model-4 outcomes show that R Square was reported as 0.9803, which suggests a compelling association between the BV, the independent variables, and the control variable. The model is significant, as the reported P value is 0.000. So, it can be interpreted that the EsgScore and all the control variables Innov, Age, Salesgr, Adv, ROA, Lev, and FARatio were statistically substantially related to the BV.
This study delves into how ESG performance influences brand value by analyzing data from 50 Indian companies for the year 2022-2023. The study results unequivocally supported the H1 hypothesis. This indicates a positive relationship between ESG performance and brand value.(Yu et al., 2023, Muñoz-Torres et al., 2018 and Jukemura, 2019). The study also reflected that the environmental score positively affects the brand value. It also indicated that the social score positively impacted the brand value. Therefore, hypotheses H2 and H3 were supported by the study's findings. The fourth hypothesis, H4, was not supported, stating a negative impact on governance score on the brand value.
Conclusion
The study examines the corporation's ESG performance and its brand value. Pooled regression was applied to establish this relationship, and four models were developed. The data was captured from 50 of the best brands for 2022-2023. The dependent variable was the band value, and the independent variable was the ESG scores combined and individual. The study also considered certain control variables such as innovation level, advertising expenses, profitability of the corporates, size, sales growth, leverage, and the fixed assets ratio. The study's results clearly demonstrate that a strong ESG performance significantly enhances brand value. Specifically, both the environmental and social scores contribute positively, while the governance scores exert a noteworthy negative influence. Investing in corporate ESG (Environmental, Social, and Governance) practices is directly linked to enhancing brand value. As companies elevate their ESG standards, their corporate value also experiences significant growth, aligning with their objectives. Despite potential short-term financial burdens, ESG investments have the potential to amplify brand value in the long run. Embracing a proactive ESG strategy fulfills social responsibilities, fosters positive partnerships, reduces business risks and capital costs, and ultimately heightens brand value.
References
Alareeni, B. A., and Hamdan, A. (2020). ESG impact on performance of US S&P 500-listed firms. Corporate Governance. 20(7), 1409–1428.
Indexed at, Google Scholar, Cross Ref
Andersen, M., & Skjoett-Larsen, T. (2009). Corporate social responsibility in global supply chains. Supply Chain Management: An International Journal, 14(2), 75–86.
Indexed at, Google Scholar, Cross Ref
Balachandran, B., & Faff, R. (2015). Corporate governance, firm value and risk: Past, present, and future. Pacific-Basin Finance Journal, 35, 1–12.
Bardos, K.S., Ertugrul, M., & Gao, L.S. (2020). Corporate social responsibility, product market perception, and firm value. Journal of Corporate Finance, 62, 101588.
Davies, G., Chun, R., Da Silva, R.V., & Roper, S. (2003). Corporate reputation and competitiveness. London, UK: Routledge.
Duque-Grisales, E., & Aguilera-Caracuel, J. (2021). Environmental, social and governance (ESG) scores and financial performance of multilatinas: Moderating effects of geographic international diversification and financial slack. Journal of Business Ethics, 168(2), 315–334.
Indexed at, Google Scholar, Cross Ref
Freeman, R.E. (2010). Strategic management: A stakeholder approach. Cambridge University Press.
Friede, G., Busch, T., & Bassen, A. (2015). ESG and financial performance: Aggregated evidence from more than 2000 empirical studies. Journal of Sustainable Finance & Investment, 5(4), 210–233.
Giese, G., Lee, L. E., Melas, D., Nagy, Z., and Nishikawa, L. (2019). Foundations of ESG investing: How ESG affects equity valuation, risk, and performance. The Journal of Portfolio Management, 45(5), 69–83.
Indexed at, Google Scholar, Cross Ref
Holden, E., Linnerud, K., and Banister, D. (2017). The imperatives of sustainable development. Sustainable Development, 25 (3), 213–226.
Jin, X.; Lei, X (2023). A Study on the Mechanism of ESG’s Impact on Corporate Value under the Concept of Sustainable Development. Sustainability, 15(11), 8442.
Indexed at, Google Scholar, Cross Ref
Jukemura, P. K. (2019). Why ESG investing seems to be an attractive approach to investment in Brazil (Sao Paolo, Brazil: Bachelor thesis).
Klein, J., & Dawar, N. (2004). Corporate social responsibility brand evaluations in and consumers’ attributions and a product-harm crisis. International Journal of Research in Marketing, 21(3), 203–217.
Lai, C.S., Chiu, C.J., Yang, C.F., & Pai, D.C. (2010). The effects of corporate social responsibility on brand performance: The mediating effect of industrial brand equity and corporate reputation. Journal of Business Ethics, 95, 457–469.
Indexed at, Google Scholar, Cross Ref
Lee, M.T., Raschke, R.L., & Krishen, A.S. (2022). Signaling green! firm ESG signals in an interconnected environment that promote brand valuation. Journal of Business Research, 138, 1–11.
Indexed at, Google Scholar, Cross Ref
Li, J.L., & Yang, Z. (2019). Gender diversity of board, corporate social responsibility and technological innovation: An empirical study based on Chinese listed firms. Sci Manag 5, 34–51.
Lii, Y.S., & Lee, M. (2012). Doing right leads to doing well: When the type of CSR and reputation interact to affect consumer evaluations of the firm. Journal of Business Ethics, 105, 69–81.
Indexed at, Google Scholar, Cross Ref
Li,W.A.; Hao, C., & Cui, G.Y. (2019). Forty years of corporate governance research: A review and agenda. Foreign Economics & Management, 41(12), 161–185.
Indexed at, Google Scholar, Cross Ref
Luo, X., & Du, S. (2015). Exploring the relationship between corporate social responsibility and firm innovation. Marketing Letters, 26(4), 703–714.
Indexed at, Google Scholar, Cross Ref
McKinsey (2019). Five ways that ESG create value”. London, UK: McKinsey.
Menon, S., & Kahn, B.E. (2003). Corporate sponsorships of philanthropic activities: When do they impact perception of sponsor brand? Journal of Consumer Psychology, 13(3), 316–327.
Indexed at, Google Scholar, Cross Ref
Nan, X., & Heo, K. (2007). Consumer responses to corporate social responsibility (CSR) initiatives: Examining the role of brand-cause fit in cause-related marketing. Journal of Advertising, 36(2), 63–74.
Indexed at, Google Scholar, Cross Ref
Olsen, M.C., Slotegraaf, R.J., & Chandukala, S.R. (2014). Green claims and message frames: How green new products change brand attitude. Journal of Marketing, 78(5), 119–137.
Pavelin, S., & Porter, L. A. (2008). The corporate social performance content of innovation in the UK. Journal of Business Ethics, 80, 711-725.
Provasnek, A. K., Schmid, E., Geissler, B., and Steiner, G. (2017). Sustainable corporate entrepreneurship: Performance and strategies toward innovation. Business Strategy and the Environment, 26 (4), 521–535.
Reed, A., Aquino, K., & Levy, E. (2007). Moral identity and judgments of charitable behaviors. Journal of Marketing, 71(1), 178–193.
Sen, S., & Bhattacharya, C.B. (2001). Does doing good always lead to doing better? Consumer reactions to corporate social responsibility. Journal of Marketing Research, 38(2), 225–243.
Indexed at, Google Scholar, Cross Ref
Shen, H.T., & Ma, Z.B. (2014). Local economic development pressure, firm environmental performance and debt financing. Journal of Financial Research, 2, 153–166.
Sierra, V., Iglesias, O., Markovic, S., & Singh, J.J. (2017). Does ethical image build equity in corporate service brands? The influence of customer perceived ethicality on affect, perceived quality, and equity. Journal of Business Ethics, 144, 661–676.
Simmons, C.J., & Becker-Olsen, K.L. (2006). Achieving marketing objectives through social sponsorships. Journal of Marketing, 70(4), 154–169.
Indexed at, Google Scholar, Cross Ref
Taliento, M., Favino, C. Netti, A. (2019). Impact of environmental, social, and governance information on economic performance: Evidence of a corporate ‘sustainability advantage’ from Europe. Sustainability, 11(6), 1738.
Yang, J.K (2020). Corporate social responsibility disclosure and innovation performance: An empirical study based on Chinese listed firms during’ the post-mandatory period’. Sci Manag, 1, 57–75.
Yoon, B.; Lee, J.H.; Byun, R (2018). Does ESG performance enhance firm value? Evidence from Korea. Sustainability, 10(10), 3635.
Yu H, Ahn, M., & Han, E. (2023), Key driver of textile and apparel industry management: fashion brand ESG and brand reputation. Frontiers in Environmental Science 11:1140004.
Indexed at, Google Scholar, Cross Ref
Zhang, Z.G., Jin, X.C., & Li, G.Q. (2013). An Empirical Study on the Interactive and Intertemporal Influence between Corporate Social Responsibility and Corporate Financial Performance. Accounting Research, 8, 32-39.
Received: 16-Dec-2024, Manuscript No. AMSJ-25-15619; Editor assigned: 17-Dec-2024, PreQC No. AMSJ-25-15619(PQ); Reviewed: 20-Dec-2024, QC No. AMSJ-25-15619; Revised: 26-Dec-2024, Manuscript No. AMSJ-25-15619(R); Published: 31-Dec-2024