Research Article: 2023 Vol: 27 Issue: 3
Employee Behaviour towards using ICT devices in Urban Public Transportation: An Empirical Study
Thirupathi Chellapalli, National Forensic Sciences University, Delhi
Citation Information: Chellapalli, T. (2023). Employee behaviour towards using ict devices in urban public transportation: an empirical study. Academy of Marketing Studies Journal, 27(2), 1-12.
Abstract
Information and Communication Technology (ICT) could play a key role in providing solutions to the problems faced in urban public transportation. Little literature is available on the factors that influence the employee adoption of innovation, especially in the context of a public transport organization. This study focuses on the adoption of electronic Ticket Issuing Machines (TIMS) by city bus conductors. This study investigates the role of individual attitude and risk perception in the adoption of innovation. The study reveals that Information and Communication Technologies (ICT’s) can be successfully deployed to address the urbanization challenges. ICT based innovations have tremendous potential for addressing the challenges related to mass urbanization. This paper aims at two objectives: The first objective pertains to validation of the basic Technology Acceptance Model (TAM). The second objective pertains to determining the role of perceived risk in shaping the user attitude towards the behavioral intentions/ actual usage of the ICT enabled device.
Keywords
Information and Communication Technology (ICT), Public Transportation, Adoption of Innovation, Technology Acceptance Model (TAM), Electronic Ticket Issuing Machines (TIMS).
Introduction
According to World Bank report (2019) India along with United States, China, Nigeria and Indonesia will lead the world’s urban population rush by 2050. As per the census of 2012 India has around 468 cities with population of more-than 1, 00,000 inhabitants (Census of India 2011). Many Indian cities have lower vehicle ownership rates compared to many developing economies. Most of the city dwellers rely on public transportation systems for their daily commuting needs.
According to Brown, T. (2021), Information and communication technology (ICT) has enormous economic significance, in addition to its ubiquitous presence. The global information technology industry is expected to reach a value of $5.2 trillion this year, according to IDC research (2020). The United States is the world's largest technology market, accounting for 32 percent of the total, or roughly $1.7 trillion in 2020. There has also been a great debate whether ICTs will have a substitution effect (replacing the traditional travel) or a complementarily effect on the travel industry. (e.g. Mouratidis, K., Peters, S., & van Wee, B., 2021). Present paper will examine the role of ICTs in their complementarity role. While many of the previous works studied aspects like teleworking (e.g. Aquileria et al., 2012), providing real- time traveler information etc., small amount of research is available on the issues related to adoption of ICTs from the perspective of service providers, especially in public transportation. The undertaking study specifically addresses the factors that affecting the behavioral intentions of employees (bus conductors) in the usage of ICT enabled devices.
City buses offer an economic and convenient way of transportation across various sections of urban society. City buses in India are typically owned and run by the state government through Transport Corporations. Many policy initiatives have recommended on the transport supply solutions to address the challenges of urban growth. An important recommendation of these policies was the need to provide on efficient public transportation systems in cities. As per the policy recommendation the central government of India, the ministry of urban development has made investments in urban development through a program known as Jawaharlal Nehru National Urban Renewal Mission (JNNURM), between 2007 and 2014. In spite, of the funding of augmentation and introduction of bus fleets, development of bus rapid transit system, only 61 cities in India have formal city bus systems.
ICT in Road Transportation
Information and Communication Technologies (ICTs) could play a major role in providing solutions to the problems faced in urban transportation. ICT could be used in locating vehicles in real time, identifying the traffic problems like congestion, etc., matching demand with supply. Information related to weather, traffic, passengers, departure and arrival schedules of other modes of transportation like trains and flights could be aggregated and analyzed to arrive at solution in urban transportation.
The common forms of ICT enabled system for transportation include parking assistance systems, traffic management system, electronic payment system, transport coordination system etc., One of the interesting applications of ICT in public transport organization is the introduction of ticket issuing machines by various state road transport organizations. A Ticket Issuing Machine (TIM) typically carried by the bus conductors are a handheld device that makes it easy for the city bus conductors to issue the ticket.
Information Technology Application in Issuing Tickets
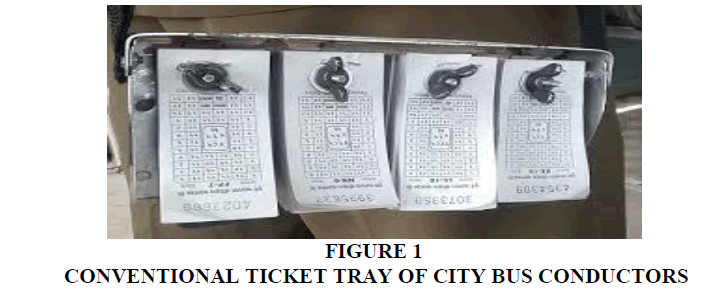
The conventional practice of manually issuing tickets to the passengers by the bus conductors is typically tedious. The bus conductors generally carry a bulky ticket tray with preprinted tickets of multiple denominations. A picture of the conventional ticket tray is shown in figure 1. The process starts with the conductor making an entry of the starting serial number of various ticket denominations on a document known as “Statistical Ticket Accountable and Record” (STAR) document. Once the journey starts, the conductor starts issuing tickets to the passengers by calculating the fare based on the origin and destination of the travel plan of individual passengers. This is quite cumbersome as the conductor has to select the tickets of different denominations to arrive at the final combination of tickets to match the fare and then punch holes on the tickets (indicating the stage of boarding of the passenger) and finally hand over the tickets to the passenger. The bus conductor collects the money and issues the balance amount to the passenger if the passenger gives the higher denomination currency against the travel fare.
The process doesn’t end there for the conductor as he/she is should update the STAR document periodically along with the progress of the journey. This involves the conductor entering the serial numbers of tickets of all denominations multiple times during the progress of the journey. For example if a conductor is carrying ten denominations of the tickets and if there are 10 points /stops in the journey (where the passenger can either alight or board), the bus conductor must make at least 200 entries in the STAR documents he or she has done all this in moving bus, while issuing tickets, collecting fare from the passengers and returning the money due to the passenger.
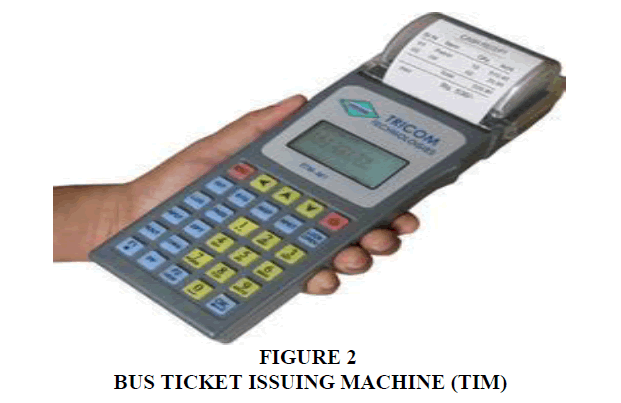
In this context, the transport organization has introduced ticket issuing machines (TIMS) to the conductors. A picture of the Ticket Issuing Machine is shown in figure 1. The machine comes with pre-loaded information of various routes, distances and the fares for various destinations and a paper roll would be present in the machine on which the ticket would be printed once the conductor enters the origin and destination of passenger. A single ticket can be issued to a group of passengers who are travelling as a group with same origin and destination. The bus conductors need not make entries in the STAR document as the details would be displayed on the machine screen just by pushing a button. The advantages of using TIM that the conductors are spared with all the above burdensome duties. The TIM automatically prints the time, date, boarding and destination stages. With the use of TIM there is no possibility of re-issue of tickets.
The TIM also helps issue of a single ticket for a group of six passengers and the stage-wise data will help the authorities analyse operations and plan accordingly.
Despite the advantages of the machine, there are quite a few challenges in the execution. The conductor needs to be trained on the new machine, issues like safety, reliability, maintenance etc., need to be addressed.
According to Ajzen I (1991) people by their very inherent nature will try to resist change unless they are convinced that they can directly benefit from the change. Any innovation should face the challenge of securing the end user acceptance and continuation of the usage of innovation even though the organization has decided to adopt the ticket issuing machines. As per (Dziallas, M., & Blind, K. (2019), the acceptance and usage of the innovation is critical for the successful deployment of the innovation Figure 2.
Gap of the Study
Many studies focused on the use of perceived usefulness and perceived ease of use of the innovation from the perspective of customers (e.g. internet banking) rather than the service providers.
Small numbers of studies are available on the factors that influence the employee adoption of innovation, especially in the context of a public transport organization. This study investigates the impact of individual attitude and risk perception in the adoption of innovation.
Study Background and Formulation of Hypothesis
(TAM) Technology Acceptance Model by Davis et al., (1989) is one of the most popular models used to investigate the adoption of technology. Theory of planned behavior (TPB) is considered as an extension of theory of reasoned action (Fishbein et al., 1975). These two models were considered as incomplete by some of the researchers (Pavcou et al., 2006, Hanson et al., 2004, George 2004, Liuetal et al., 2004). The inclusion of perceived risk should be considered to understand the behavioral intention with regards to the use of technologies. Belldard et al., (2010) felt that more systematic research is needed for the antecedents of the adoption of electronic services. Researchers like A Benson et al., (2015), Chen and Dhillon (2003), Lui et al., (2004) noted that perceived risk and trust associated with the technology based transactions likely influence the behavioral intentions of the users. The technology acceptance model (TAM) given by Davis et al., (1989) has explained the following important presumptions/ postulations.
1. Perceived ease of use understood as the degree to which a user should find a particular technology to be free from effort on their part (Davis et al., 1989)
2. Perceived usefulness understood as that using the technology would improve the way a user could complete a given task (Davis et al., 1989).
3. Perceived risk understood as the probability of certain outcomes given a behavior, and the danger and severity of negative consequences from engaging in those behaviors (Cunninggham).
4. Attitudes understood as a psychological tendency that is expressed by evaluating a particular entity with some degree of favor or disfavor (Eagly and Chaiken, 1993, p. 1)
The current study proposes that in addition to the perceived risk of using the innovation from the perspective of the user is also an important factor that will play a key role in deciding the behavioral intentions. It is therefore postulated that Perceived Risk is negatively associated with the attitude of the user and thereby influences the user’s behavioral intention to use the technology.
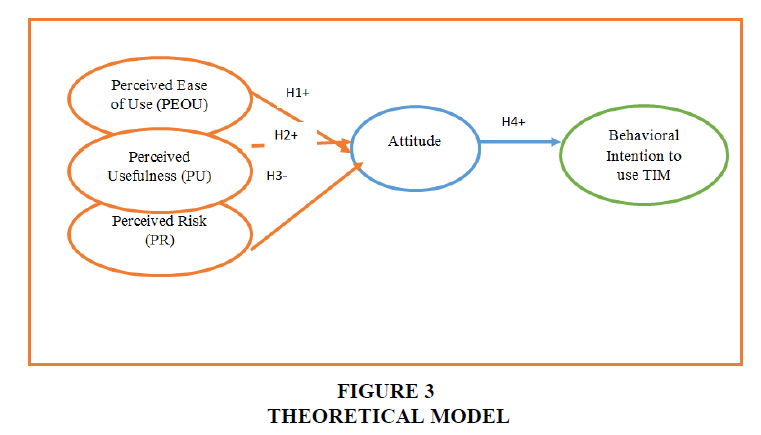
In order to gain a deeper understanding of the process by which conductors decide whether to use TIM, the model shown in figure 3 was developed. We propose three antecedent beliefs as predictors of attitude towards a TIM. Ease of use and usefulness has been explored in the TAM literature, however perceived risk have not been extensively explored. This new antecedent belief is expected to extend the research based on the technology acceptance model. In addition, attitude towards a TIM is proposed to impact the overall behavioral intentions to use the TIM. These relationships are shown in Figure 3. And specific hypotheses based on the model and descriptions of the constructs are discussed in the following paragraphs.
Antecedent Beliefs
Above model (figure 3) includes three antecedent predictors of attitude towards the Ticket Issuing Machines (TIMs). These three predictors are Perceived Usefulness (PU), Perceived Ease of Use (PEOU), and Perceived Risk (PR). Each of these four factors has been described below.
Perceived ease of use has been defined as the degree to which a user would find the use of a technology to be free from effort on their part (Davis et al., 1989). According to Davis et al., (1989) this construct is central to the technology acceptance model and has been used in many studies since (Adam et al., 1992; Igbaria et al., Jackson et al., 1997; Mathieson, 1991; Taylor and Todd, 1995). Therefore, it is hypothesized as follows:
H1: The perceived ease of use of the Ticket Issuing Machine (TIM) is positively related to attitude toward the Ticket Issuing Machine (TIM).
As per Davis et al., Perceived usefulness is the degree to which a person believes that using a particular system would enhance his or her job performance". It means whether or not someone perceives that technology to be useful for what they want to do. It has received a great deal of attention in adoption literature (Adam et al., 1992; Igbaria et al., Jackson et al., 1997; Mathieson, 1991; Taylor and Todd, 1995). In this study the perceived usefulness is related to whether the TIM will enhance the employee’s (his or her) job performance. Therefore, it is hypothesized as follows:
H2: The perceivedusefulness of the Ticket Issuing Machine (TIM) is positively related to the attitude towards the Ticket Issuing Machine (TIM).
Cunningham (1967) discussed Perceived Risk (PR) in terms of the probability of certain outcomes given a behavior, and the danger and severity of negative consequences from engaging in those behaviors. This concept has been discussed in the technology framework under the terms of reliability (Dabholkar, 1996), accuracy and recovery (Meuter and Bitner, 1998). Therefore, it is hypothesized:
H3: The perceived risk of using the Ticket Issuing Machine (TIM) is negatively related to attitude towards the TIM.
According to Eagly and Chaiken (1993), attitude is a psychological tendency that is expressed by evaluating an entity with some degree of favor or disfavor. The notion that attitude influences behavioral intentions (Ajzen and Fishbein, 1980; Fishbein and Ajzen, 1975) has been researched extensively over the past few years and this relationship has been well established in the literature regarding the adoption of technology (Allen et al., 1992; Barki and Hartwick, 1994; Dabholkar, 1996; Harrison et al., 1997; Taylor and Todd, 1995).
H4: Employee (service provider) attitude towards Ticket Issuing Machine (TIM) is positively related to his/her behavioral intentions to use the TIM.
Construct Definitions
The following table (Table 1) provides the operational definitions of the constructs used in this study.
| Table 1 Operational Definition Of The Constructs |
|
|---|---|
| Constructs | Operational Definitions |
| Perceived Ease of Use (PEOU) | The strength of one’s belief that interacting with TIM would be free of effort. |
| Perceived Usefulness (PU) | The strength of one’s belief that using TIM will enhance his or her service. |
| Perceived Risk (PR) | The strength of one’s belief about the possibility of the product malfunctioning and not performing thereby failing to deliver the desired benefits. |
| Conductor's Attitude | It is one’s psychological tendency that is expressed by evaluating a particular entity with some degree of favor or disfavor (Eaggly and Chaiken, 1993) |
| Behavioral Intention to Use (BIU) | The strength of one’s willingness to use TIM as a service. |
Research Methodology
Rutberg, S., & Bouikidis, C. D. (2018), states that quantitative research is a social research that employs empirical methods and empirical statements. Goertzen, M. J. (2017), stated that quantitative research as a type of research that is “explaining phenomena by collecting numerical data that are analyzed using mathematical based methods (Statistics).”
In order to capture the determinants of intended usage of Ticket Issuing Machines (TIMs), a survey approach was adopted targeting bus conductors of the Telangana State Road Transportation Corporation (TSRTC). This corporation was selected because of its deployment of technology (TIMs) in service delivery.
The present study was designed based on the definition given by Creswell (1994). The research is descriptive in nature and involved the collection of primary data from the respondents (city bus conductors) using a structured questionnaire. The structured questionnaire was developed using the constructs mentioned in TAM model by Davis (1989). The questionnaire consisted of 23 Likert type statements with 5-point Likert types statements with five points from strongly disagree to strongly agree.
The information from the respondents was collected by directly interviewing the bus conductors.Hyderabad city the capital of Telangana State in India was chosen for the study. The state transport corporation runs a city bus fleet of around 4000 buses travelling different routes of the city making approximately 40000 trips a day and carrying around 36 hundred thousand commuters. During the course of data collection for the study the bus conductors were met during the lunch break at various bus depots and the interviews were carried out by the researchers Tables 2 & 3.
Results and Discussion
| Table 2 Study Demographics |
||
|---|---|---|
| Number | Percentage | |
| Gender | ||
| Male | 264 | 88.0 |
| Female | 36 | 12.0 |
| Age | ||
| Under 35 | 124 | 41.3 |
| 35 to 50 | 101 | 33.6 |
| Above 50 | 75 | 25 |
| Income | ||
| Under 25, 000 25, 000 – 49, 999 Above 50, 000 |
92 198 10 |
30.6 66.0 3.3 |
| Education | ||
| Intemediate | 8 | 2.6 |
| Bachelor degree | 199 | 66.3 |
| Master degree | 93 | 31.0 |
Note 1: constructs are measured using 5 point Likert scale.
Note 2: AVE means average variance extracted, CR means composite reliability.
| Table 3 Total Variance Explained |
|||||||||
|---|---|---|---|---|---|---|---|---|---|
| Component | Initial Eigenvalues | Extraction Sums of Squared Loadings | Rotation Sums of Squared Loadings | ||||||
| Total | % of Variance | Cumulative % | Total | % of Variance | Cumulative % | Total | % of Variance | Cumulative % | |
| 1 | 7.232 | 31.444 | 31.444 | 7.232 | 31.444 | 31.444 | 7.177 | 31.203 | 31.203 |
| 2 | 4.363 | 18.97 | 50.414 | 4.363 | 18.97 | 50.414 | 4.284 | 18.627 | 49.83 |
| 3 | 3.314 | 14.407 | 64.821 | 3.314 | 14.407 | 64.821 | 3.144 | 13.667 | 63.498 |
| 4 | 1.977 | 8.597 | 73.418 | 1.977 | 8.597 | 73.418 | 1.987 | 8.638 | 72.136 |
| 5 | 1.469 | 6.387 | 79.805 | 1.469 | 6.387 | 79.805 | 1.764 | 7.669 | 79.805 |
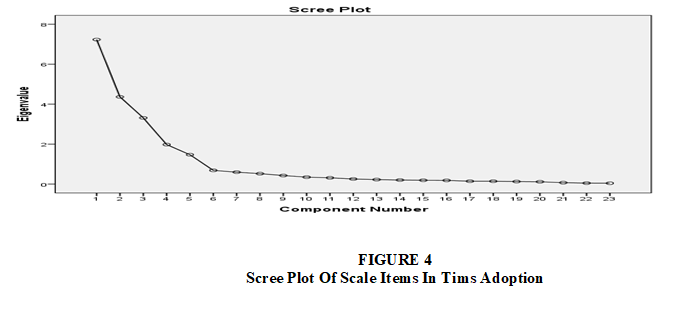
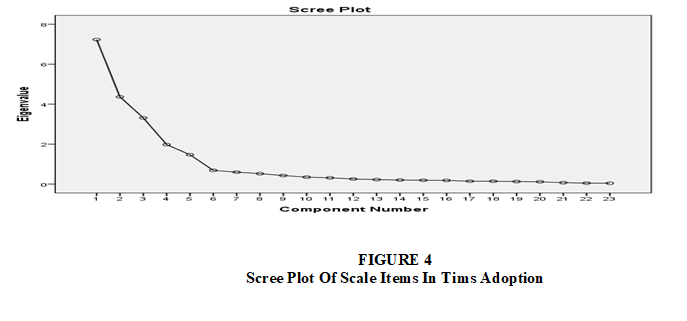
All the reliabilities are above 0.7 which is the threshold limit suggested in literature for the scale development (Hair et al., 2006). A 23 item with five factors is derived from the EFA from the study. KMO and Bartlett’s test measure of sampling adequacy is 0.838. Total variance explained by five factors 79.805 Figure 4.
Confirmatory Factor Analysis
Confirmatory factor anlysis was carried out using AMOS 20.0 for the three independent constructs PU, PEU, and PR. Two item under PEU and one item under PR had to be dropped due to validity issues. The various model fit statistics of the measurement model is given in table Table 4.
| Table 4 Model Fit Statistics Of The Measurement Model For Independent Constructs |
|||
|---|---|---|---|
| Measure | Actual value | Threshold | Source |
| Cmin/df | 2.103 | <3.0 | Hair et al., (2006) |
| CFI | 0.986 | >0.95 great | |
| GFI | 0.913 | >0.9 good | |
| AGFI | 0.898 | >0.80 good | |
| IFI | 0.970 | >0.9 good | |
| RMR | 0.044 | <0.09 good | |
| RMSEA | 0.036 | <0.05 good | |
| Pclose | 0.821 | >0.05 good | |
Structural Equation Modeling (SEM)
SEM is used to evaluate the model and the significance of relationship between the constructs. The basic model of TAM is evaluated in the context of the road transport corporation employees with regards to ticket issuing machine (TIM) usage. The various model fit statistics and the threshold values are given in the above table. The model fit statistics clearly indicate that the TAM model is validated as a useful model to study the usage or adoption of Ticket Issuing Machines (TIMs) by the employees (ticket conductors) in India Figure 5.
| Table 5 Regression Weights And The Significance Of Relationship Between Constructs |
||||||
|---|---|---|---|---|---|---|
| Estimates | S.E. | C.R. | P | |||
| ATT | ß | PEU | 0.511 | 0.081 | 6.847 | *** |
| ATT | ß | PU | 0.691 | 0.108 | 7.964 | *** |
| ATT | ß | PR | 0.085 | 0.091 | 4.761 | 0.003 |
| BI | ß | ATT | 0.688 | 0.069 | 10.541 | *** |
Note: PEU means perceived ease of use, PU means perceived usefulness, PR Means perceived risk, ATT means Attitude, BI means behavioural intention to use Tables 5 & 6.
| Table 6 Model Fit Statistics For Technology Issuing Machines (Tims) |
|||
|---|---|---|---|
| Measure | Actual value | Threshold | Source |
| Cmin/df | 1.544 | <3.0 | Hair et al., (2006) |
| CFI | 0.963 | >0.95 great | |
| GFI | 0.888 | >0.9 good | |
| AGFI | 0.850 | >0.80 good | |
| IFI | 0.961 | >0.9 good | |
| RMR | 0.039 | <0.09 good | |
| RMSEA | 0.046 | <0.05 good | |
| Pclose | 0.578 | >0.05 good | |
Reliability and Validity of the Scale
The composite reliability of the constructs is above 0.7: average variance extracted (AVE) is above 0.5 convergent validity of the items in the construct: and maximum shared variance (MSV) along with the square root of AVE greater than the correlation among the constructs indicating discriminat validity of the constructs.
Findings
?The basic model of TAM is evaluated in the context of the road transport corporation employees with regards to ticket issuing machine (TIM) usage and respondents (ticket conductors) are much comfortable with the TIM machine over manual ticketing process.
?The bus conductors were convinced with the perceived usefulness of TIMs, as it eliminates many of the problems of the conventional mode of issuing tickets.
?Perceived ease of use also played a significant role in the adoption, as with adequate among the conductors could operate the electronic machines.
?Interestly, from the ticket conductors perspective ease of use of TIM machine also contributing for the convenience and usefulness during onboard travelling.
?The ticket conductors did not perceive much risk while using the TIM machine.
?Overall, ticket conductors are seeking out most comfort, much usefulness and maximum ease while delivering service to the passengers.
Thoeretical Contribution
The present study validated the technology acceptance model with regards to employee (conductors) behaviour towards usage of information and communication technological devices i.e. ticket issuing machine in the context of urban public trasportation corporation.
Implication of the Study for Policy Suggestion
The current study provide profound insights for managers of road and transportation corporation limited companies across India to emphasis on problems of manual ticketing and encourage the employees usage of TIMs without any inhibitions on job safety.
The present study findings also highlight, and extremely helpful for the managers at the time of resource (budget) allocation.
Conclusion
Public transportation system plays a crucial role in the development of modern cities. With rapid urbanization countries like India face major challenges in the adoption of ICT in the context of delivering public services, which is also true in the case of public transportation in urban areas. The basic TAM model has been improved by including the construct perceived risk in addition to perceived usefulness and perceived ease of use, constructs.The study reveals that Information and communication technologies (ICT’s) can be successfully deployed to address the urbanization challenges. ICT based innovations have tremendous potential for addressing the challenges related to mass urbanization.
References
Arnold, M., Reynolds, K., Ponder, N., & Lueg, J. (2005). Customer delight in a retail context: investigating delightful and terrible shopping experiences.Journal of Business Research,58(8), 1132-1145.
Indexed at, Google Scholar, Cross Ref
Arunachalam, V. (2005). Technology and Economic Growth: Quo Vadis, India?.Vikalpa: The Journal For Decision Makers,30(1), 1-6.
Indexed at, Google Scholar, Cross Ref
Bagdare, S., & Jain, R. (2013).Measuring retail customer experience.International Journal of Retail & Distribution Management,41(10), 790-804.
Indexed at, Google Scholar, Cross Ref
Bagozzi, R., & Yi, Y. (1988).On the evaluation of structural equation models.Journal of the Academy Of Marketing Science,16(1), 74-94.
Indexed at, Google Scholar, Cross Ref
Barras, R. (1990). Interactive innovation in financial and business services: the vanguard of the service revolution.Research policy,19(3), 215-237.
Indexed at, Google Scholar, Cross Ref
Bitner, M., Brown, S., & Meuter, M. (2000). Technology Infusion in Service Encounters.Journal of The Academy Of Marketing Science,28(1), 138-149.
Indexed at, Google Scholar, Cross Ref
Bitner, M., Ostrom, A., &Meuter, M. (2002).Implementing successful self-service technologies.Academy of Management Perspectives,16(4), 96-108.
Indexed at, Google Scholar, Cross Ref
Bitner, M.J. (1992). Services capes: the impact of physical surroundings on customers and employees, Journal of Marketing, 56, 57-71.
Indexed at, Google Scholar, Cross Ref
Chahal, H., & Kaur, J. (2014).Development of marketing capabilities scale in banking sector.Measuring Business Excellence,18(4), 65-85.
Indexed at, Google Scholar, Cross Ref
Curran, J., & Meuter, M. (2005). Self-service technology adoption: comparing three technologies.Journal of Services Marketing,19(2), 103-113.
Indexed at, Google Scholar, Cross Ref
Curran, J., Meuter, M., & Surprenant, C. (2003). Intentions to Use Self-Service Technologies: A Confluence of Multiple Attitudes.Journal of Service Research,5(3), 209-224.
Indexed at, Google Scholar, Cross Ref
Dabholkar, P. (1996). Consumer evaluations of new technology-based self-service options: An investigation of alternative models of service quality.International Journal Of Research In Marketing,13(1), 29-51.
Indexed at, Google Scholar, Cross Ref
Indexed at, Google Scholar, Cross Ref
Garg, R., Rahman, Z., & Qureshi, M. (2014). Measuring customer experience in banks: scale development and validation.Journal of Modelling In Management,9(1), 87-117.
Indexed at, Google Scholar, Cross Ref
Garg, R., Rahman, Z., Qureshi, M., & Kumar, I. (2012). Identifying and ranking critical success factors of customer experience in banks.Journal Of Modelling In Management,7(2), 201-220.
Indexed at, Google Scholar, Cross Ref
Harris, K., Grewal, D., Mohr, L., & Bernhardt, K. (2006). Consumer responses to service recovery strategies: The moderating role of online versus offline environment.Journal Of Business Research,59(4), 425-431.
Indexed at, Google Scholar, Cross Ref
Kaushik, A., & Rahman, Z. (2015). Innovation adoption across self-service banking technologies in India.International Journal of Bank Marketing,33(2), 96-121.
Indexed at, Google Scholar, Cross Ref
The role of customer brand engagement and brand experience in online banking
Indexed at, Google Scholar, Cross Ref
Ladhari, R., Souiden, N., & Dufour, B. (2017). The role of emotions in utilitarian service settings: The effects of emotional satisfaction on product perception and behavioral intentions.Journal Of Retailing And Consumer Services,34, 10-18.
Indexed at, Google Scholar, Cross Ref
Indexed at, Google Scholar, Cross Ref
Lemon, K., &Verhoef, P. (2016). Understanding Customer Experience Throughout the Customer Journey.Journal of Marketing,80(6), 69-96.
Indexed at, Google Scholar, Cross Ref
Lin, J., & Hsieh, P. (2006).The role of technology readiness in customers' perception and adoption of self-service technologies.International Journal of Service Industry Management,17(5), 497-517.
Indexed at, Google Scholar, Cross Ref
Meuter, M., Ostrom, A., Bitner, M., & Roundtree, R. (2003).The influence of technology anxiety on consumer use and experiences with self-service technologies.Journal Of Business Research,56(11), 899-906.
Indexed at, Google Scholar, Cross Ref
Michelle Bobbitt, L., &Dabholkar, P. (2001). Integrating attitudinal theories to understand and predict use of technology-based self-service.International Journal Of Service Industry Management,12(5), 423-450.
Indexed at, Google Scholar, Cross Ref
Montoya-Weiss, M., Voss, G., & Grewal, D. (2003).Determinants of Online Channel Use and Overall Satisfaction with a Relational, Multichannel Service Provider.Journal Of The Academy Of Marketing Science,31(4), 448-458.
Indexed at, Google Scholar, Cross Ref
Sarel, D., & Marmorstein, H. (1998).Managing the delayed service encounter: the role of employee action and customer prior experience.Journal Of Services Marketing,12(3), 195-208.
Indexed at, Google Scholar, Cross Ref
Shamdasani, P., Mukherjee, A., &Malhotra, N. (2008).Antecedents and consequences of service quality in consumer evaluation of self-service internet technologies.The Service Industries Journal,28(1), 117-138.
Indexed at, Google Scholar, Cross Ref
Sun, L. (2002). The experiential dimensions of internet shopping: An ethnographic analysis of online store websites.Asian Journal Of Communication,12(2), 79-99.
Indexed at, Google Scholar, Cross Ref
Thai Hoang, D., Igel, B., & Laosirihongthong, T. (2006).The impact of total quality management on innovation.International Journal of Quality & Reliability Management,23(9), 1092-1117.
Indexed at, Google Scholar, Cross Ref
Verhoef, P., Lemon, K., Parasuraman, A., Roggeveen, A., Tsiros, M., & Schlesinger, L. (2009). Customer Experience Creation: Determinants, Dynamics and Management Strategies.Journal of Retailing,85(1), 31-41.
Indexed at, Google Scholar, Cross Ref
Walter, U., Edvardsson, B. and Ostrom, A. (2010). Drivers of customers’ service experiences: a study in the restaurant industry, Managing Service Quality, 20(3), 236-258.
Indexed at, Google Scholar, Cross Ref
Received: 15-Dec-2022, Manuscript No. AMSJ-22-13018; Editor assigned: 16-Dec-2022, PreQC No. AMSJ-22-13018(PQ); Reviewed: 17-Jan-2023, QC No. AMSJ-22-13018; Revised: 11-Feb-2023, Manuscript No. AMSJ-22-13018(R); Published: 12-Mar-2023
