Research Article: 2025 Vol: 29 Issue: 1
Economic Influencers of Climate Change: A Comparative Study of South Asian Nations
Charu Bhurat, SVKM’s ASMSOC NMIMS (Deemed to be) University, Mumbai
Harsh Thakrar, SVKM’s ASMSOC NMIMS (Deemed to be) University, Mumbai
Citation Information: Bhurat, C., & Thakrar, H. (2025). Economic influencers of climate change: A comparative study of south asian nations. Academy of Marketing Studies Journal, 29(1), 1-16.
Abstract
This paper investigates the phenomenon of climate change and how economic parameters like – Real GDP, Government Debt, Health Expenditure and Inflation influence climate change amongst South Asian nations. The data underwent evaluation through the utilisation of statistical techniques including a Correlational Matrix, ANOVA, and Linear Regression. The study also integrates the Climate Risk Index reports published by German Watch, which were afterwards compared to indicators of mortality and GDP per capita. Certain countries exhibited a positive association between the aforementioned characteristics and average temperature, whereas others had a negative correlation. The study aims to build a linear equation utilising real GDP as a predictor to assess the influence of economic development on climate. Given the prevailing circumstances characterised by limited financial resources, inadequate infrastructure development, and a lack of technological proficiency, it is imperative for nations to prioritise the promotion of environmentally friendly technologies, explore alternative avenues for financial support, and implement measures to curtail carbon dioxide emissions.
Keywords
Climate Change, Sovereign Debt, Real GDP, Inflation, Health Expenditure, Climate Risk Index, South Asian Countries.
JEL Classification
Q540, Q280, H630, I180.
Introduction
Climate Change is one of the biggest problems being identified across the globe. One of the area that is most susceptible to climatic shocks is South Asia. This region, which comprises of 8 countries namely Afghanistan, Bangladesh, Bhutan, India, Maldives, Nepal, Pakistan is the most populated region in Asia and is home to 25.2 per cent of the world’s total population (Worldometer, 2024). More than half of all South Asians have been devastated by one or more climate-related disasters which includes unforeseen droughts, instances of flooding, and an unparalleled increase in temperatures in the last two decades. This might drastically alter living circumstances for up to 800 million people in South Asia that already has among of the world’s poorest and most vulnerable populations (World Bank, 2011). The rapidly increasing loss of snow cover in the Himalayas, as well as rising sea levels, endanger the livelihoods of nearly 200 million people in Bangladesh, Bhutan, the Maldives, Nepal, and Sri Lanka (Asian Development Bank, 2013). Temperatures could climb by 4.6 degree Celsius if global climate action is not taken. The economies of six nations - Bangladesh, Bhutan, India, the Maldives, Nepal, and Sri Lanka - might decrease by up to 1.8 per cent each year by 2050 and 8.8 per cent by 2100, on average (Asian Development Bank, 2014). The individuals in question are observed to be confronted with the consequences associated with a decline in labour productivity, occurrences of riverine floods, subpar crop yields, and disruptions to ecosystems.
The predominantly agrarian nature of these countries is resulting in significant repercussions on their agricultural output, the well-being of their populations, and the emergence of social discontent inside these nations. The majority of these countries, who are classified as developing nations, lack the necessary resources and infrastructure to effectively address, prevent, or recover from the consequences of these disasters. Consequently, they are compelled to seek financial assistance in the form of loans, resulting in a compounding effect on their national debt.
This has led to an increased interdependency as the actions of countries surrounding also deeply impact their neighbouring countries. Hence, it becomes imperative for countries not only to take action for themselves but hold the others also accountable for their actions.
Moreover, in addition to exacerbating the issue, it is noteworthy that a significant number of these nations have yet to undertake any measures to address climate change, so exposing themselves to a far higher vulnerability when confronted with the cumulative effects.
This issue presents a formidable challenge that the global community has regrettably reached a point where complete resolution is unattainable. However, proactive measures can still be implemented to mitigate the adverse consequences and curtail further deterioration.
The study aims to analyse the following research objectives:
1. To evaluate and test the models that have been used as a measure to check the climate risk using economic factors, such as, Real Gross Domestic Product (GDP) and Government Debts, Health Expenditure and Inflation.
2. To construct an alternate model that uses the essence of previous models and assess its validity through the examination of its statistical significance.
3. To forecast possible climate change in South Asian countries using the alternative model and make suggestions based on the same.
With the above objectives in mind, the paper is organized as follows. Section 2 discusses the available literature on climate change and different economic parameters that affect it and vice versa. Section 3 discusses the methodology of the paper. Section 4 presents the data and runs all the tests for analysis. Section 5 discusses the conclusion and limitations of the study. Corrective measures undertaken by countries to mitigate climate change are also discussed.
Literature Review
Major macroeconomic repercussions of climate change typically last for a very long time. One of the most impacted aspects that will have a negative impact on any economy is labour productivity. The Stochastic Growth Model was used as a computation in one of the publications from the International Monetary Fund (IMF) to understand the productivity across 174 different nations. The study’s main finding was that temperature rise and real GDP are strongly inversely connected, meaning that as average temperatures rise, real GDP declines more than they do. The multi-country stochastic model takes into account factors of production that might promote long-term economic development coupled with advances in technology and efficiency (Matthew Kahn, 2019); Kahn et al. (2021).
Klusak et al. (2021) employed a sample of 1385 annual long-term foreign-currency sovereign ratings for 108 countries, issued by S&P between 2004 and 2020 to investigate the effects of climate change on sovereign credit ratings. They conclude that as of 2030, climate change will have significant impact on the deepening downgrades of sovereigns. The findings suggest that costs of corporate borrowing will rise as a result of rise in costs of sovereign debt due to deferred green investments.
Research by Cevik & Jalles (2021) aims to bridge the research gap between climate change and sovereign debt by calculating the probability of sovereign debt default based on sensitivity and adaptability to climate change. They discover that climate change vulnerability and resilience have a significant impact on the likelihood of sovereign debt default, particularly in low-income countries, using data from 116 countries from 1995 to 2017.
Jalles (2020) investigate the impact of climate change vulnerability and resilience on government bond yields and spreads. The research is done across 98 advanced and developing countries over a period of 22 years from 1995. They found that vulnerability and resilience to climate change have a significant impact on cost of government borrowing, keeping the conventional determinants of sovereign risk in check.
Kling et al. (2021) draw a relationship between climate vulnerability, the cost of capital of firms and the financial exclusions of firms. The paper suggests that firms in countries with higher climatic risks have greater financial constraints as they tend to have a higher finance cost. The implication of this is that the economic development takes a hit as a high corporate financing cost leads to reduced tax revenue, hence reducing government investment in environmental policies and infrastructure.
Alayza & Caldwell (2021) analyse the impact of COVID-19 on climate financing in seventeen developing countries. The authors find that even before the pandemic, developing nations were finding it tough to allocate funds to climate action due to an increasing debt burden but during the pandemic domestic budgets were reallocated towards social, health and economic sectors.
Mallucci (2020) investigates how natural disasters caused by climate change can worsen fiscal vulnerabilities and trigger sovereign defaults. He develops a standard sovereign default model that incorporates disaster risk and adjusts it to a sample of seven Caribbean countries frequently hit by hurricanes, concluding that hurricane risk reduces the government’s ability to issue debt and that climate change may further restrict market access.
Christina Nikitopoulos (2021) shows that carbon dioxide emissions are positively related to sovereign bond yields and spreads, for advanced as well as developing countries. Reduced natural resource rents and increased consumption of renewable energy is associated with reduced sovereign borrowing cost for the advanced country group. However, the relationship does not hold true for the developing country group.
In terms of European sovereigns, Zenios (2022) employs integrated assessment models to examine their exposure to climate risk over time. He concludes that EU institutions working together to develop regional instances will guarantee applicability, raise ambitions in dealing with climate-related risks, and encourage fiscal authorities to consider solutions (Ahmed & Suphachalasai, 2014).
Agarwala et al. (2021) shed insights on the impact of climate change on the financial system, sovereign debt markets, and fiscal sustainability. This study demonstrates the correlation between the visual manifestations of climate change and the potential fiscal hazards they provide, therefore influencing the expenses associated with public borrowing and the creditworthiness of sovereign entities.
Battiston, et al. (2019) applied the CLIMAFIN framework to give a future-looking climate transition risk assessment of the sovereign bonds’ portfolios of insurance companies in Europe. Solo data of insurers from 31 countries in EU/EEA that reported Solvency II data at the end of 2018 are employed. The final dataset contains 1576 insurance companies, 142 bond issuers and 10746 bonds. The paper concludes that a disorderly low-carbon transition might have a rather large effect on insurers’ investments of sovereign bonds.
In order to understand the different climate change metrics (in terms of performance, exposure to extreme events, vulnerability, and readiness) that impact the cost of government borrowing, Iustina Alina Boitan (2022) conducted research in a panel of European countries over the period 2000-2020. It was found that climate-vulnerable countries that show low climate disaster managerial abilities in adapting and mitigating the climate challenges pay a higher risk premium on sovereign debt (Lane, 2013).
The effects of climate change on the economy vary depending on where you are in the world. As a result, the physical effects of climate change on the people and the environment in Asia are quite different from those in any other part of the world (Auffhammer, 2019).
The locational variables are one of the main causes of the consequences of climate change on economic growth. The research analyses short- to mid-term effects of climate change from 1980 to 2019 by utilising data from states and districts. In more numerical terms, the ultimate interpretation was identical to the one offered by Matthew E. Kahn. They hypothesised that a 1-degree Celsius increase in temperature causes a 4.7 per cent decline in the growth rate of the district’s income per-capita (Medhavi Sandhani, 2020).
To conclude, the study by Kraemer & Volz (2022) shows that if the biodiversity is hampered it will have a substantial impact on the debt sustainability. Hence any calamity although cannot be predicted should be accounted for. It is even more imperative for developing countries to incorporate an estimate for calamities in their debt sustainability analysis as they are highly dependent on their natural resources.
Methods
The present study employs a research design that is both descriptive and analytical in nature. The primary objective of employing this specific design is to evaluate and quantify the variables that influence the climate, particularly their long-term impact. The research conducted was an exploratory study that integrated many prior findings and developed a novel model through analysis.
The selected sample comprised several models and reports pertaining to the subject of climate change. This encompasses several indices such as the Environmental Performance Index, which is given by Yale University, the Climate Risk Index (CRI) report released by German Watch, the Climate Change Performance Index by Climate Action Network, and several others.
The Climate Risk Index is a measure of which country suffers the most in extreme weather conditions. The model is one of the most important and famous interpretations of German Watch Organisation for the global change in climate. The first report was presented in 2005, which showed the CRI and calculations for 2003. One rationale for include data from two years prior to the publication date of the report is to ensure the utilisation of precise and reliable information sourced from the World Health Organisation (2021) and government data spanning multiple countries. The most recent report was published in December 2021, which included an analysis of 2019. As the name suggests, the CRI measure the risk level for each and every country in the world which takes into account over 22 indicators from 11 different categories. These indicators include natural disaster rates, scarcity of resources, no. of people getting affected in the economy, etc. A part of the analysis is to link the number of deaths per 1000 in the country and the overall population’s purchasing power parity to the pre-calculated CRI from German Watch and understand whether or not a co-relation exists between them.
While constructing a new model and testing its significance, the study required data for all the South Asian countries that would or would not affect the changes in temperature of those countries. There are two new models which would test this theory that was inspired by the research objectives.
(A) The first model uses Real Gross Domestic Product in terms of US Dollars (billions) as a factor that would lead to a change in the Average Temperature of that country during the summer season (temperature was measured in Celsius). Firstly, the study tried to establish a Correlation between the two which was then tested using Regression and ANOVA. All the tests were conducted at a 5 per cent significance level, meaning that the calculated p-value must be below 0.05 for it to be significant and not above. The Linear Regression was then used to formulate a linear equation that followed y = mx + c, wherein y was the Average Temperature in Summer and x was the Real GDP. M represented the coefficient of Real GDP which changes with the country and c is the intercept. This equation was further used to forecast the expected Average Temperature in Summer based on the macro-economic policies that the government of the aforesaid countries are planning to implement to boost their GDP (and in turn the economy itself); based on which the study recommends the impact of these policies.
(B) The second model also measures the change in the Average Temperature of that country during the summer season (temperature was measured in Celsius) but rather than just Real GDP, it uses 3 more factors in it, which includes, Total Government Debt as a per cent of GDP, Current Health Expenditure as per cent of GDP and the Annual Inflation Rate. Primary objective of this model was to establish a correlation that would give us a more accurate measure to estimate the Average Temperature in Summer. This measure was further tested using Regression and ANOVA. All the tests were conducted at a 5 per cent significance level, meaning that the calculated p-value must be below 0.05 for it to be significant and not above (Mallucci, 2020).
Both models share a shared objective, which is to develop a predictive model for forecasting the Average Temperature in Summer, a key determinant of Climate Risk. Why is temperature higher during the summer compared to other seasons, and how does it vary throughout the year? The rationale behind this phenomenon might be attributed to the distinct habitats that these countries possess. A country situated closer to the equator, such as Sri Lanka, is likely to experience consistently humid weather throughout the year. In contrast, a country like Nepal, located in the Northern Hemisphere, would generally enjoy colder conditions in comparison. Therefore, we utilised data corresponding to the specific period of the year characterised by the most elevated temperatures, irrespective of geographical location. The data utilised in this study was sourced exclusively from reputable platforms, namely the Trading Economics website, Macro Trends network, and the Climate Knowledge Portal provided by the World Bank (Narain, 2021).
Results
The Climate Risk Index (CRI) is a measure of which country suffers the most in extreme weather conditions. The model is one of the most important and famous interpretations of German Watch Organisation for the global change in climate. As the name suggests, the CRI measure the risk level for each and every country in the world which takes into account over 22 indicators from 11 different categories. These indicators include natural disaster rates, scarcity of resources, no. of people getting effected in the economy, etc. A part of the research paper’s analysis is to link the number of deaths per 1000 in the country and the overall population’s purchasing power parity to the pre-calculated CRI from German Watch and understand whether or not a co-relation exists between them.
Islamic Republic of Afghanistan
The country is ranked 6th in German Watch’s CRI ranking for the year 2019, which clearly shows that the country is at the brink of facing major climatic complications in the near future, if necessary, steps are not taken.
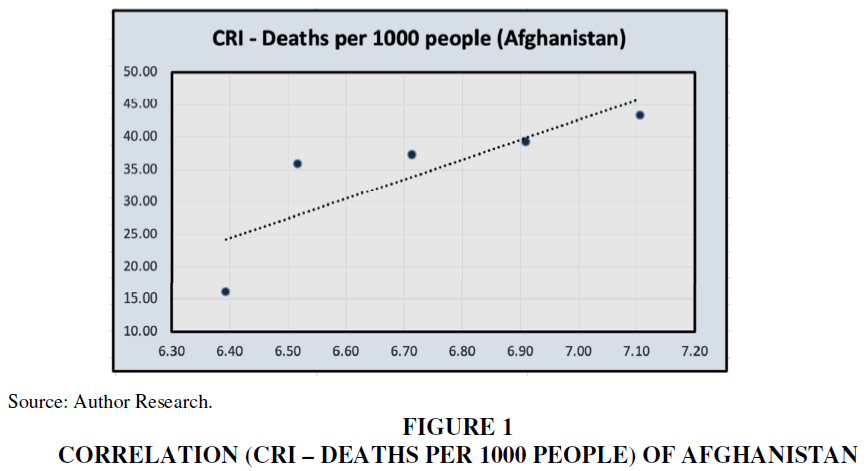
Based on the analysis conducted using data from the German Watch report and the official statistics released by the Government of the Islamic Emirate of Afghanistan, this study aims to examine the correlation between the two variables and the CRI. The initial step involves conducting a correlational study on the Climate Risk Index Score within a time frame of five years, specifically from 2015 to 2019.
Correlation coefficient for mortality viz-a-viz CRI is 0.818 which being > 0.8 indicates a very strong positive correlation Figures 1-12.
Source: Author Research.
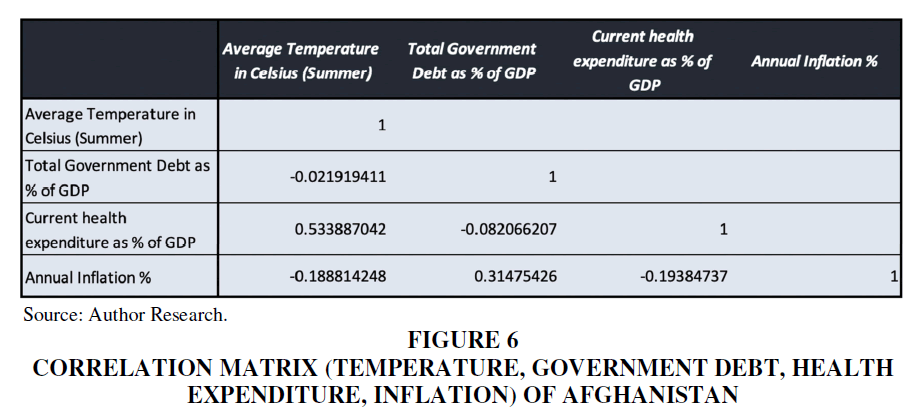
Figure 6 Correlation Matrix (Temperature, Government Debt, Health Expenditure, Inflation) of Afghanistan
Source: Author Research.
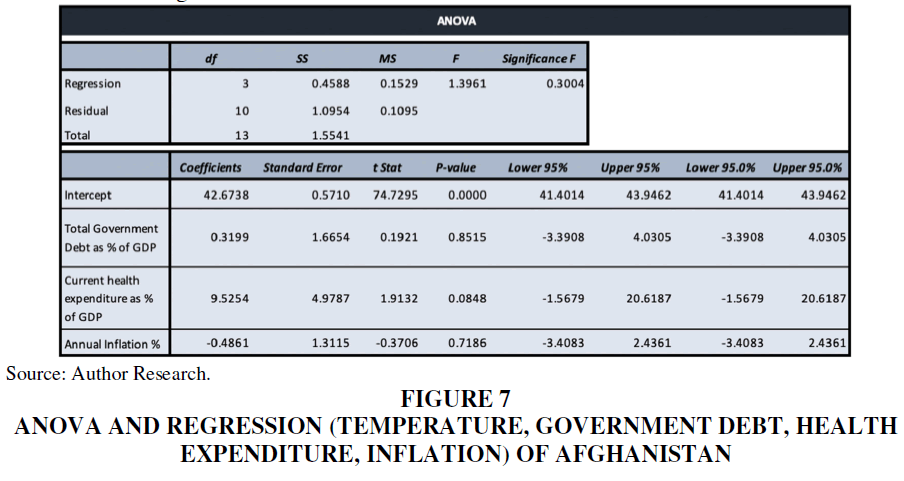
Figure 7 Anova And Regression (Temperature, Government Debt, Health Expenditure, Inflation) of Afghanistan
Source: Author Research.
Figure 9 Correlation of Cri; Deaths Per 1000, GDP Per Capita PPP of Bangladesh
The trendline is upward sloping and steep giving a visual representation of the strong positive correlation. Y axis (dependent variable) is represented by CRI and Deaths per 1000 people (independent) is represented by the X axis.
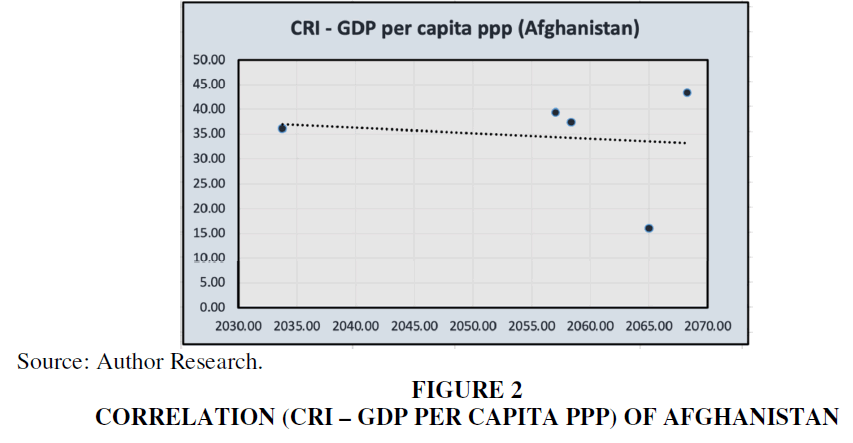
Correlation coefficient for GDP per capita PPP viz-a-viz CRI is -0.139 which being between 0.00 to 0.20 indicates a very weak negative correlation. This can be represented better using the graph below.
The trendline is downward sloping and very gradual giving a visual representation of the very weak negative correlation. Y axis (dependent variable) is represented by CRI and GDP per Capita PPP (independent) is represented by the X axis.
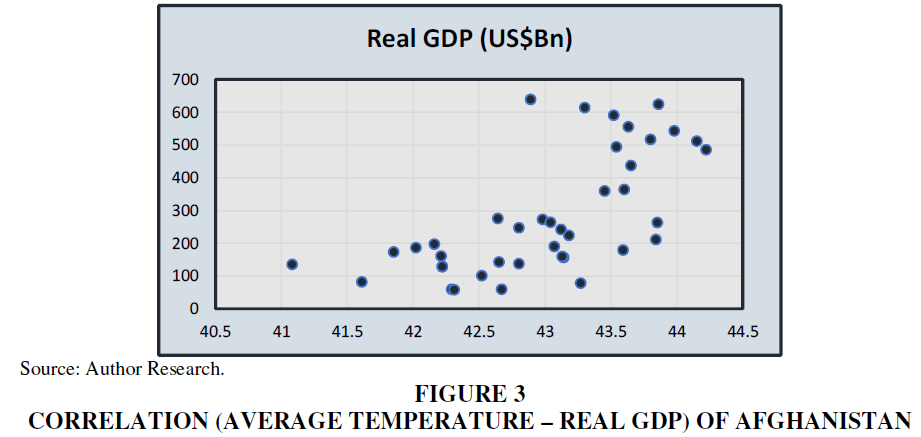
The subsequent phase of the nation’s analysis encompassed an assessment of the mean temperature observed during the summer season from 1960 onwards. The Islamic Emirate of Afghanistan refrained from outsourcing certain critical data of their nation as a consequence of an ongoing civil conflict within the country. The temperature was utilised as a variable to examine its potential correlation with the GDP of the country. The ensuing results are as follows:
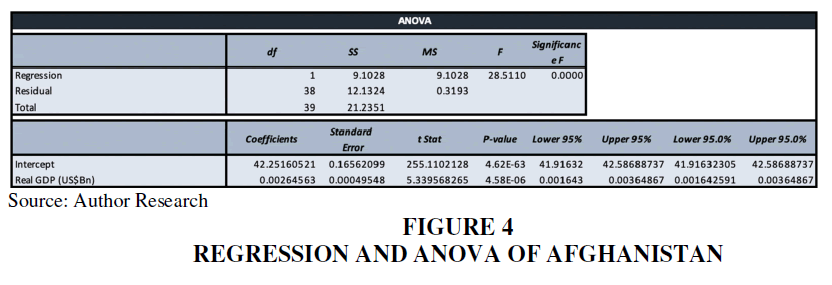
The findings revealed a significant positive association between Real GDP and Average Temperature throughout the summer season. Through the use of a mathematical model, a linear equation was derived to represent this relationship. By utilising this methodology, it becomes possible to predict the fluctuations in temperature in relation to the desired GDP that a nation aims to attain.
Subsequently, a multiple variable factor correlation analysis was performed, wherein the Average Temperature in summer was examined in relation to the government’s total debt, expenditure on healthcare, and the yearly inflation rate. It was anticipated that increased government expenditure on the health sector would lead to improvements in individuals’ well-being and potentially contribute to climate management. However, it is important to note that this may also result in a subsequent increase in the overall national debt. Nevertheless, neither of these assumptions was applicable to the Islamic Republic of Afghanistan. It was anticipated that inflation would increase in conjunction with the rise in the country’s overall debt, as observed in the case of the Islamic Republic of Afghanistan.
The paper also tested the significance level of these results using a regression analysis which suggested that only one of the three variables (Current health expenditure as a per cent of GDP) was significantly related to the Average Temperature in Summer. However, even this gave us a linear equation to forecast the Average Temperature of Afghanistan in the next few years of summer, but an assumption cannot be made on this, given that two of the three variables are in-significant.
People’s Republic of Bangladesh
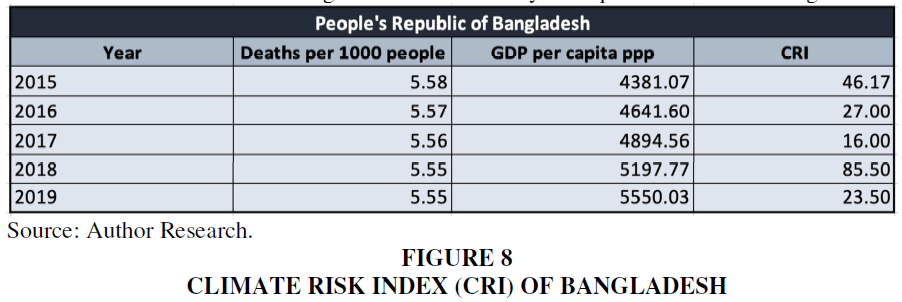
The country is ranked 13th in German Watch’s CRI ranking for the year 2019, which shows that it is better off than Afghanistan but still very susceptible to climate change.
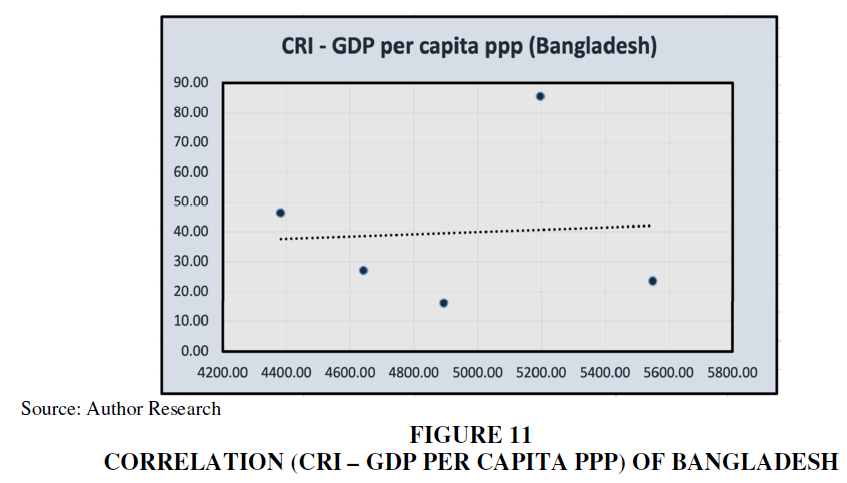
The study aims to establish the correlation between the two factors and the CRI. The initial step involves conducting a correlational study on the Climate Risk Index Score within a time frame of five years, specifically from 2015 to 2019.
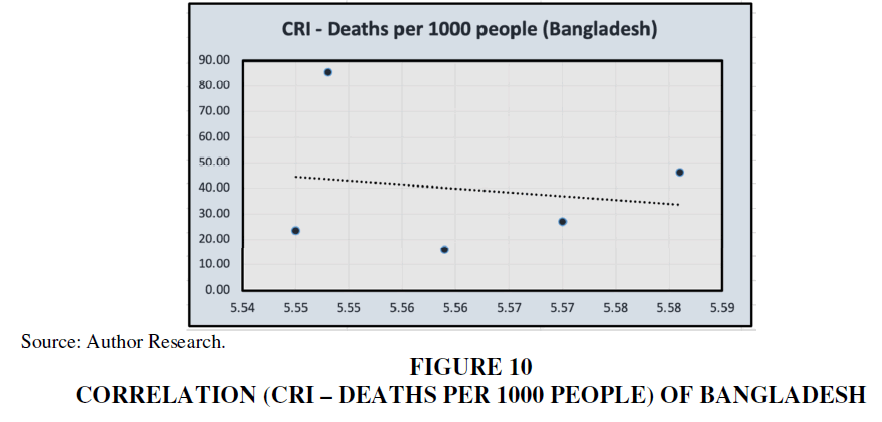
Correlation coefficient for mortality viz-a-viz CRI is -0.162 which being between 0 - 0.20 indicates a very weak negative correlation. This can be represented better using the graph below.
The trendline is downward sloping and very gradual giving a visual representation of the very weak negative correlation. Y axis (dependent variable) is represented by CRI and Deaths per 1000 people (independent) is represented by the X axis.
Correlation coefficient for GDP per capita PPP. viz-a-viz CRI is 0.062 which being between 0.00 to 0.20 indicates a very weak positive correlation.
The trendline is upward sloping and very gradual giving a visual representation of the very weak positive correlation. Y axis (dependent variable) is represented by CRI and GDP per Capita PPP (independent) is represented by the X axis.
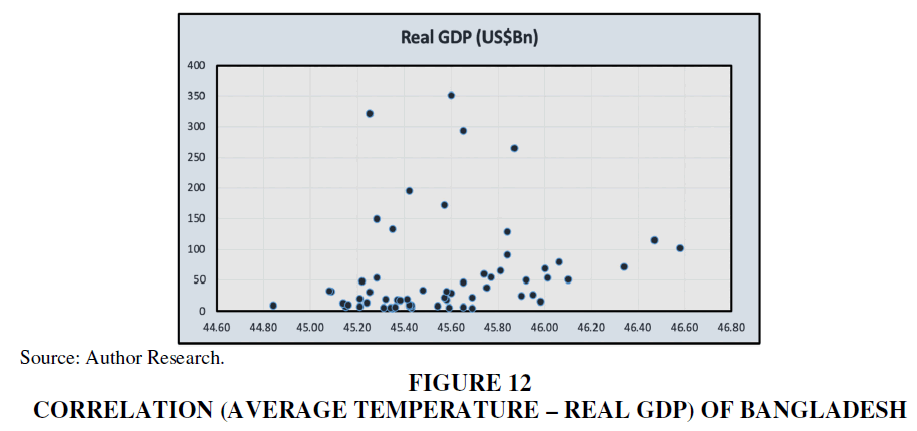
Throughout the examination of the average temperature of Bangladesh throughout the summer season, it was anticipated that the Real GDP would align with this variable, as indicated by the results of the regression analysis. The data pertaining to Bangladesh was collected starting from 1960, with the inclusion of 11 years of data that was considered as part of India's territory until the partition resulting in the formation of Bangladesh as an independent nation in 1971.
Even though the coefficient of the linear equation that will be used for forecasting is relatively low, a p-value of less than 0.05 shows that the factor is significant in determining the temperature. The forecasted Real GDP during 2023-2027 and the expected average temperature in Bangladesh.
The analysis of several variables indicates a positive correlation between the inflation rate in Bangladesh and the average temperature throughout the summer season. One possible explanation for this phenomenon could be attributed to the substantial expenditure on non-durable commodities and services, including but not limited to automotive fuel and mass-produced items. The government likely implemented measures to mitigate inflationary pressures through the provision of subsidies and increased expenditures on durable goods, so potentially reducing the availability of resources allocated to the health sector.
A regression analysis was conducted to assess the significance of the variables. The results indicate that only the total government debt as a percentage of GDP exhibited a p-value below 0.05, indicating statistical significance. Nevertheless, although providing a linear equation for predicting the Average Temperature of Bangladesh during upcoming summer seasons, it is important to note that this assumption cannot be considered valid due to the insignificance of two out of the three variables.
Kingdom of Bhutan
The country is ranked 130th in German Watch’s CRI ranking for the year 2019, which clearly shows that the country is at the best position in terms of climate change risks relative to all the other countries not just in South Asia but across the world.
The study aims to establish the correlation between the two factors and the Climate Risk Index (CRI). The initial step involves conducting a correlational study on the Climate Risk Index Score within a time frame of five years, specifically from 2015 to 2019.
Correlation coefficient for mortality viz-a-viz CRI is -0.895 which being > -0.8 indicates a very strong negative correlation.
The trendline is downward sloping and very steep giving a visual representation of the very strong negative correlation. Y axis (dependent variable) is represented by CRI and Deaths per 1000 people (independent) is represented by the X axis.
Correlation coefficient for GDP per capita PPP. viz-a-viz CRI is 0.789 which being between 0.60 to 0.80 indicates a strong positive correlation.
The trendline is upward sloping and very steep giving a visual representation of the strong positive correlation. Y axis (dependent variable) is represented by CRI and GDP per Capita PPP (independent) is represented by the X axis.
After evaluating Real GDP as a factor of Average Temperature of Bhutan, the results were both satisfying and in-line with the expectation. A rise in Real GDP led to a rise in Average Temperature as people started spending more.
The coefficient of the linear equation that will be used for forecasting is pretty good, and a p-value of less than 0.05 shows that the factor is significant in determining the temperature. The forecasted Real GDP during 2023-2027 and the expected average temperature in Bhutan.
The discrepancy between the observed impact of several variable factors on the average temperature of Bhutan during the summer season and the anticipated outcomes, as well as the findings of other nations' analyses, is evident. One significant factor contributing to this phenomenon is the substantial level of national debt incurred by the government. During the period from 2013 to 2019, the nation exhibited a debt-to-GDP ratio that above that of other countries, therefore positioning it as an outlier. In order to uphold the credit rating of Bhutan, it was imperative to substantially reduce inflation, as indicated by the International Monetary Fund. The investigation suggests that the expenditures on healthcare were among the contributing factors that may support this proposition for Bhutan.
The obtained outcome of the significance level testing for these variables was as anticipated. The variables had a considerable impact on the average temperature. Consequently, an equation was derived from these elements, which can be utilised to estimate the Average Temperature in summer for future years.
Republic of India
The country is ranked 7th in German Watch’s CRI ranking for the year 2019, which clearly shows that the country is at the brink of facing major climatic complications in the near future, if necessary, steps are not taken.
The study aims to establish the correlation between the two factors and the CRI. The initial step involves conducting a correlational study on the Climate Risk Index Score within a time frame of five years, specifically from 2015 to 2019.
Correlation coefficient for mortality viz-a-viz CRI is -0.516 which being between -0.40 to -0.60 indicates a moderate negative correlation.
The trendline is downward sloping and neither very steep nor very gradual giving a visual representation of the moderate negative correlation. Y-axis (dependent variable) is represented by CRI and Deaths per 1000 people (independent) is represented by the X axis.
Correlation coefficient for GDP per capita PPP. viz-a-viz CRI is 0.226 which being between 0.20 to 0.40 indicates a weak positive correlation.
The trendline is upward sloping and gardual giving a visual representation of the weak positive correlation. Y-axis (dependent variable) is represented by CRI and GDP per Capita PPP (independent) is represented by the X-axis.
While analysing the Real GDP as a factor for the average temperature in India during summer, the outcome was fairly similar to that of the other countries in this research paper and what was expected. The coefficient was positive and the p-value was less than 0.05, showing significance.
Forecasting becomes more manageable when the predetermined degree of significance is achieved, and the observed outcome aligns with the anticipated results. The projected Real GDP for the period of 2023-2027 and the anticipated average summer temperature in India, assuming the attainment of the USD 5-trillion economy objectives.
Study and outcome of the multiple variable factors on Average Temperature of India in summer is probably the best of what was expected, indicating an efficient impact of the policies. All the three factors are positively correlated to temperature and their significance also suggests that except for government spending, both the remaining factors can be considered as a good measure to estimate future temperature during summer.
Federal Democratic Republic of Nepal
The country is ranked 12th in German Watch's CRI ranking for 2019, indicating that it is doing better than many South East Asian countries but remains vulnerable to climate change.
The study aims to establish the correlation between the two factors and the CRI. The initial step involves conducting a correlational study on the Climate Risk Index Score within a time frame of five years, specifically from 2015 to 2019.
Correlation coefficient for mortality viz-a-viz CRI is 0.669 which being between 0.60 to 0.80 indicates a strong positive correlation.
The trendline is upward sloping and steep, giving a visual representation of the strong positive correlation. Y-axis (dependent variable) is represented by CRI and Deaths per 1000 people (independent) is represented by the X-axis.
Correlation coefficient for GDP per capita PPP viz-a-viz CRI is -0.508 which being between -0.4 to -0.6 indicates a moderate negative correlation.
The trendline is dowanward sloping and neither too steep nor too gradual, giving a visual representation of the weak positive correlation. Y-axis (dependent variable) is represented by CRI and GDP per Capita PPP (independent) is represented by the X-axis.
Nepal has been one of the highest growing nations in terms of GDP, they have grown over 6000 per cent since 1960, and has been one of the cooler nations during summer time in this list. The coefficient between Real GDP and average temperature during summer in Nepal are highly correlated and also majorly significant when compared to the other countries.
The linear equation pertaining to Nepal exhibits a higher degree of accuracy in comparison to other countries, as seen by its regression equation having the lowest p-value among them. It is anticipated that a more precise estimation of the projected temperature can be obtained by utilising the estimated GDP in the forthcoming period.
The multiple variable factors to find the average temperature in summer suggested that as the inflation in Nepal went up, the average temperature also went up. The government must have tried to control the inflationary pressure by subsidising and increasing spendings on durable goods, which ultimately made it less available for the health sector. This spending must and should have costed them a fortune, forcing them to take more debts along the time. All of which contributed to the average temperature of the country during summer.
The significance testing of the three variables however, suggested otherwise. All of them were more than the significance level of 5 per cent, indicating that the measure may not be the best measure to determine the temperature change in future.
Islamic Republic of Pakistan
The country is ranked 15th in German Watch’s CRI ranking for the year 2019, which shows that it is better off than many South East Asian countries but is still very susceptible to climate change.
The study aims to establish the correlation between the two factors and the Climate Risk Index (CRI). The initial step involves conducting a correlational study on the Climate Risk Index Score within a time frame of five years, specifically from 2015 to 2019.
Correlation coefficient for mortality viz-a-viz CRI is -0.227 which being between 0.00 to -0.20 indicates a very weak negative correlation.
The trendline is downward sloping and very gradual giving a visual representation of the very weak negative correlation. Y-axis (dependent variable) is represented by CRI and Deaths per 1000 people (independent) is represented by the X-axis.
Correlation coefficient for GDP per capita PPP. viz-a-viz CRI is 0.376 which being between 0.20 to 0.40 indicates a weak positive correlation.
The trendline is upward sloping and gradual giving a visual representation of the weak positive correlation. Y-axis (dependent variable) is represented by CRI and GDP per Capita PPP (independent) is represented by the X-axis.
Post the evaluation of Real GDP as a factor of Average Temperature of Pakistan; the results were not just satisfying but also exactly as what was expected. A rise in Real GDP led to a rise in Average Temperature as people started spending more on non-durable products.
The expected change in temperature as a result of the change in Real GDP as a forecast for the next 5 years. The analysis of several variables indicates that there is an inverse relationship between inflation in Pakistan and the average temperature throughout the summer season. One possible explanation for this phenomenon could be the tendency of citizens to refrain from expenditures on non-durable goods and services, such as gas. The government likely implemented measures to manage inflationary pressures by providing subsidies and raising expenditures in the healthcare sector. Notably, the government’s ability to do so without incurring additional debt is praiseworthy.
The level of significance of these variables were tested using a regression analysis which showed that only the annual inflation rate had a p-value of more than 0.05, which is insignificant. However, even this gave us a linear equation to forecast the Average Temperature of Pakistan in the next few years of summer, on which an assumption can be made, given that 2 out of 3 variables have a significant p-value.
Democratic Socialist Republic of Sri Lanka
The country is ranked 30th in German Watch's CRI ranking for 2019, indicating that it is doing better than many South East Asian countries but still needs supervision.
The study aims to establish the correlation between the two factors and the CRI. The initial step involves conducting a correlational study on the Climate Risk Index Score within a time frame of five years, specifically from 2015 to 2019.
Correlation coefficient for mortality viz-a-viz CRI is -0.39 which being between -0.20 to -0.40 indicates a weak negative correlation.
The trendline is downward sloping and gradual, giving a visual representation of the weak negative correlation. Y-axis (dependent variable) is represented by CRI and Deaths per 1000 people (independent) is represented by the X-axis.
Correlation coefficient for GDP per capita PPP viz-a-viz CRI is -0.494 which being between -0.40 to -0.60 indicates a moderate negative correlation.
The trendline is dowanward sloping and neither too steep nor too gradual, giving a visual representation of the weak positive correlation. Y-axis (dependent variable) is represented by CRI and GDP per Capita PPP (independent) is represented by the X-axis.
Since the collected data and analysis is only until 2019, the recent civil-crisis would not affect the findings of the research, but it will certainly affect the forecasts according to Real GDP. While analysing the Real GDP as a factor for the average temperature in Sri Lanka during summer, the outcome was fairly similar to that of the other countries in this research paper and what was expected. The coefficient was positive and the p-value was significantly less than 0.05.
Over the past decade, Sri Lanka has experienced a notable expansion in its GDP. However, due to the prevailing economic crisis, it is anticipated that this growth trajectory will decelerate in the forthcoming years. However, it is anticipated that the overall trend would remain consistent. The following is the projected mean temperature during the summer season in Sri Lanka.
The multiple variable factors to find the average temperature in summer were completely different from what was expected. All the three factors were showing a negative correlation and the level of significance of those were all greater than 0.05. This clearly shows that there is no linkage between total debt of the government, government’s expenditure on healthcare and the annual inflation rate with that of the Average temperature of Sri Lanka during summer.
Discussion
This study endeavours to provide a historical examination of the influence of economic factors such as Real GDP, Sovereign Debt, Health Expenditure and Inflation on Climate change in South Asian countries, followed by a projection for future years. For Afghanistan, the sovereign debt and average temperature were negatively correlated and it was forecasted that the GDP would rise at a more rapid rate than the average temperature. For Bangladesh, a positive correlation was observed between the sovereign debt and the average temperature. However, the forecast could not be relied upon as the country is not very developed in comparison to other South Asian countries. As for Bhutan, a negative correlation was observed between government debt and temperature and forecast suggested that real GDP has a significant impact on the average temperature which will rise accordingly. India is the most multi-factorial significant nation in terms of debt, government expenditure and inflation. Forecasted reports use the country’s objective of reaching a USD 5-trillion economy which would adversely affect the country’s temperature and climate risk. Nepal observed a positive correlation between government debt as a percent of GDP and average temperature and forecasts suggest that Nepal, one of the highest growing countries had a relatively low affecting significance of their real GDP on average temperature. The results for Pakistan have suggested the effects of government debt and inflation are clearly visible on average temperature rise. The forecast indicates that there is no significant correlation between real GDP and average temperature, and this relationship is expected to persist in the future. In the case of Sri Lanka, it proved to be highly disappointing as it failed to meet the anticipated standards. The sustainability of the prognosis may be uncertain in light of the prevailing economic crisis experienced by the country. In conclusion, it is evident that the global community is vulnerable to the impacts of climate change, necessitating the implementation of substantial steps to ensure the preservation of the environment for future generations. It is imperative for each nation to diligently oversee its financial affairs and implement suitable fiscal and monetary measures in order to address the balance of payment challenges in relation to climate change.
During the course of analysis and model development, the study encountered certain restrictions that could potentially impact the final model and subsequent conclusions.
The data used for the analysis of the Climate Risk Index was solely sourced from the publications produced by the German Watch group. A total of 16 reports were released by the aforementioned individuals. However, only the most recent 5 reports are currently accessible to the general public. Consequently, when attempting to assess the association, the results consistently indicated insignificance.
One further limitation encountered by the study was the reliance on data released up to two years prior to the date of publication. The most recent release, which occurred in 2021, encompassed data collected in 2019. Therefore, the predictions generated by the models may lack accuracy.
Due to the absence of data for the years 2020 and 2021, the model fails to incorporate the effects of significant events like as the COVID-19 pandemic, the Russia-Ukraine War, the Sri-Lankan economic crisis, the Taliban takeover, and the Atmanirbhar Bharat Campaign. These events are likely to have a substantial impact on the growth of the factors under consideration. ASEAN countries exhibited varying responses to the impact of climate change, with certain nations promptly implementing effective measures, while others just acknowledged its existence as a pressing concern. It is imperative that they take immediate action. This phenomenon presents numerous challenges, including inadequate financial resources, insufficient infrastructure, and limited technological capabilities. Nonetheless, its significance extends beyond national borders, encompassing global implications. Even in cases where countries are not directly accountable for climate change, they are nonetheless required to address the consequences.
Acknowledgment
We are grateful to all our fellow colleagues and industry experts here for giving their comments as well as suggestions on the paper.
Disclosure Statement
No potential conflict of interest was reported by the author(s).
Declarations
No funding was received to assist with the preparation of this manuscript. The authors have no financial or proprietary interests in any material discussed in this article.
Availability of Supporting Data
We also confirm that the dataset used in this paper is available and accessible upon request from the corresponding author.
References
Agarwala, M., Burke, M., Klusak, P., Mohaddes, K., Volz, U., & Zenghelis, D. (2021). Climate change and fiscal sustainability: Risks and opportunities. National Institute Economic Review, 258, 28-46.
Indexed at, Google Scholar, Cross Ref
Ahmed, M. (2014). Assessing the costs of climate change and adaptation in South Asia. Asian Development Bank.
Alayza, N., & Caldwell, M. (2021). Financing climate action and the COVID-19 pandemic: An analysis of 17 developing countries. World Resources Institute.
Asia, E. (2022). World Bank Group.
Auffhammer, M. (2019). The (economic) impacts of climate change: Some implications for Asian economies (No. 1051). ADBI Working Paper Series.
Battiston, S., Jakubik, P., Monasterolo, I., Riahi, K., & van Ruijven, B. (2019). Climate Risk Assessment of the sovereign bond of portfolio of European Insurers. In: EIOPA Financial Stability Report, December 2019.
Cevik, S., & Jalles, J. T. (2022). An apocalypse foretold: Climate shocks and sovereign defaults. Open Economies Review, 33(1), 89-108.
Kahn, M. E., Mohaddes, K., Ng, R. N., Pesaran, M. H., Raissi, M., & Yang, J. C. (2021). Long-term macroeconomic effects of climate change: A cross-country analysis. Energy Economics, 104, 105624.
Indexed at, Google Scholar, Cross Ref
Kling, G., Volz, U., Murinde, V., & Ayas, S. (2021). The impact of climate vulnerability on firms’ cost of capital and access to finance. World Development, 137, 105131.
Indexed at, Google Scholar, Cross Ref
Klusak, P., Agarwala, M., Burke, M., Kraemer, M., & Mohaddes, K. (2023). Rising temperatures, falling ratings: The effect of climate change on sovereign creditworthiness. Management Science, 69(12), 7468-7491.
Indexed at, Google Scholar, Cross Ref
Kraemer, M., & Volz, U. (2022). Integrating nature into debt sustainability analysis.
Lane, K (2013). Clean Technologies Could Cut South Asia Emissions by a Fifth by 2020 at Little Cost.
Mallucci, E. (2022). Natural disasters, climate change, and sovereign risk. Journal of International Economics, 139, 103672.
Indexed at, Google Scholar, Cross Ref
Medhavi Sandhani, A. P. (2020). Impact of Climate Change on Economic Growth: A Case Study of India. Madras School of Economics, 1-54.
Narain, S. (2021, November 2). It will reach 500 GW of non-fossil energy capacity. Retrieved from Down to Earth.
Sklibosios Nikitopoulos, C., Puente Moncayo, D., Richards, K. A., & Ryan, L. S. (2021). Climate Change Transition Risk on Sovereign Bond Markets. SSRN Electronic Journal.
Indexed at, Google Scholar, Cross Ref
World Bank. (2011). A guide to the World Bank. The World Bank.
World Health Organization. (2021). Global patient safety action plan 2021-2030: towards eliminating avoidable harm in health care. World Health Organization.
Zenios, S. A. (2022). The risks from climate change to sovereign debt. Climatic Change, 172(3), 30.
Received: 05-Aug-2024, Manuscript No. AMSJ-24-15118; Editor assigned: 06-Aug-2024, PreQC No. AMSJ-24-15118(PQ); Reviewed: 26-Sep-2024, QC No. AMSJ-24-15118; Revised: 26-Oct-2024, Manuscript No. AMSJ-24-15118(R); Published: 14-Nov-2024
