Research Article: 2024 Vol: 28 Issue: 6S
Dynamic Relationship Between Oil Price Shocks and Stock Market Returns: Evidence from G7 and BRICS Countries
Swamy Perumandla, Indian Institute of Management Nagpur, Nagpur
Citation Information: Perumandla, S. (2024). Dynamic relationship between oil price shocks and stock market returns: evidence from g7 and brics countries. Academy of Marketing Studies Journal, 28(S6), 1-19.
Abstract
The purpose of this paper is to examine the dynamic relationship between oil price shocks and the returns of stock markets in both G7 and BRICS nations. The authors employ Quantile Regression Analysis, and two asymmetric GARCH models, namely the exponential GARCH and the threshold GARCH. This study examines the impact of oil price changes on stock market index returns, considering both symmetric and asymmetric impacts across three distinct market circumstances. Overall, the findings reveal that an investigation of the shock's origin plays a crucial role in determining the time-varying link between oil prices and stock markets. Price shocks have a substantial impact on the stock returns of many G7 and BRICS nations. In this study, the authors demonstrate the significance of oil's role as a catalyst for return dynamics of both G7 and BRICS countries’ stock markets and the analysis of time-varying relationships in investment decision-making. The authors assert that it is crucial to recognize the significant impact of COVID-19 shocks on oil prices alongside shocks relating to oil when examining the dynamics of oil prices and stock returns.
Key Words
Oil price shocks, Time-varying Relationships, Quantile Regression, COVID-19, G7 and BRICS, Energy.
JEL
C31, C32, C34, G15, Q40.
Introduction
As countries undergo modernization and urbanization, their dependence on crude oil intensifies, earning it the metaphorical status of being the lifeblood of global economies. The prices of crude oil exert a substantial influence on the progression of any economy. Based on projections, oil continues to be the predominant energy source (Newell, Raimi, & Aldana, 2019). Consequently, fluctuations in oil prices are poised to exert a substantial influence on key macroeconomic indicators.
Many previous research works have explored the complex relationship between macroeconomic variables and the volatility of oil prices (e.g., Hamilton, 2003; Cunado & Perez de Garcia, 2005; Bachmeier, 2008; Lee and Chiu, 2011a, 2011b; Lee & Ning, 2017). A substantial body of literature has also addressed the relationship between oil prices and stock returns (Smyth and Narayan, 2018). These studies have examined how changes in oil prices impact stock market returns, serving as a tool for hedging risk and contributing to the formulation of inflation management strategies in macroeconomic policy. Especially during turmoil periods, investors can adjust asset allocation and regulators can keep a check on interest rates and inflation shock to consider appropriate actions. The results have shown both positive and negative relationships between oil prices and stock returns (Kilian and Park, 2009). The positive effect is due to higher oil prices. This indicates greater demand and stronger business, which results in a bull market (Narayan & Narayan, 2010; Zhu, Li, & Yu, 2011; Zhu, Li, & Li. 2014). However, higher oil prices proliferate the cost of production which reduces the earnings of organisation and have a negative influence on the stock market (Papapetrou, 2001; Park and Ratti, 2008; Chen, 2009; Filis, 2010). This mixed outcome underscores the necessity for a more comprehensive understanding of oil price volatility and its impact on stock returns through updated data and methodologies.
Because the dynamic fluctuations in global crude oil have a profound impact on stock markets worldwide, it becomes imperative to understand the intricate connection between crude oil and stock markets. This research aims to decipher this complex link, specifically looking at the relationship between changes in oil prices and stock market volatility in the BRICS (Brazil, Russia, India), as well as the G7 countries (Canada, Germany, France, Italy, Japan, and the United States). This research aims to make noteworthy contributions to the field of financial economics for several reasons. Firstly, considering that the G7 and BRICS, collectively represent a substantial portion of the global economy, investigating the link between oil prices and stock markets in these economies holds significant relevance. The G7 and BRICS countries were chosen because they are significant global producers and consumers of oil as well as having large GDPs; as a result, there is a very dynamic link between the performance of the oil market and the stock market. Secondly, employing different methodologies and connecting different stands of literature will benefit policy-making and enhance economic benefits. To ascertain the dynamic link between the oil price shocks and stock market returns, the study uses three distinct econometric techniques: DCC GARCH and Quantile Regression. From June 1, 2000, to May 2020, the study's time frame encompasses the major financial and economic crises (Housing Market Boom, 9/11 terrorist attack in the US, Second World War in Iraq, pre- and post-crisis effects of the massive oil price shock of 2008, Covid-19 crisis with lockdowns, and recent trends in oil prices).
Further, oil price-stock relationships respond differently during economic volatility caused by external events such as financial crises, trade wars and geopolitical tensions. Research conducted before to 1999 that disregarded the time-varying link discovered a negative correlation between oil prices and stock returns, indicating that the relationship has since become unstable (Miller and Ratti, 2009; Jamnmazi and Aloui, 2010; Kumar, et al. 2012).
Applying Markov-switching VARs, and regime-switching models, studies have identified that oil price shocks on stock markets are regime-dependent (Managi and Okimoto, 2013; Chang and Yu, 2013; Xu, 2015; Zhang, 2017; Zhu, Su, You, & Ren, 2017). The effect of oil price on stock return has been influenced by external events, especially events like the Iraq war, terrorist attack, and Arab Spring (Kollias et al. 2013). With the increased number of external events, significant volatility can be found in the oil prices and stock markets generating a non-linear process. Therefore, analysis absorbing these events or information impact needs to be studied as one can find the dynamic relationship between oil price shocks and stock returns of G7 and BRICS countries.
For oil prices, the study considers the weekly spot price of West Texas Intermediate (WTI) crude oil prices from the US Energy Information Agency (http://www.eia.doe.gov). Brent and Dubai, the prices of the other two main categories of crude oil, are closely associated with WTI oil price, which is frequently used as the benchmark for oil pricing.
The time span considered for the study includes from 1 June 2000 till May 2020, which includes the major crisis financial and economic crisis Figure 1.

Figure 1 Crude Oil Prices React to A Variety of Geopolitical and Economic Events
Sources: U.S. Energy Information Administration, Refinitiv.
Here is the structure of the paper. Related literature is provided in Section 2. The approach is presented in Section 3. Data description and preliminary analysis are presented in Section 4. The empirical findings and the commentary that goes along with them are presented in the fifth part. The paper is concluded in Section 6.
Literature Review
The price of oil is widely recognized as a significant worldwide economic indicator that exerts a considerable impact on economic growth. Extensive scholarly research has been conducted to explore the multiple factors linked with oil prices, in response to the observed growing volatility in the oil market and its major impact on macroeconomic conditions. The extant literature pertaining to the correlation between oil price shocks and stock market returns can be classified into two primary categories: linear models and non-linear models. Furthermore, scholars have further developed these approaches by investigating the effects of oil price shocks on equity indices and sectors in diverse nations, while also considering different currencies and macroeconomic variables. For a complete analysis and in-depth debate on this topic, refer to the work of Lang and Auer (2020). As stated before, the research employed two separate econometric approaches. The subsequent section presents a thorough examination of the scholarly literature about these tactics.
Studies on the ripple effects of oil price volatility that are now available have mostly focused on major stock markets, such as those in the US, Norway, Canada, and Japan.
The nations examined in this research include of Italy, Germany, Netherlands, and France (Filis, Degiannakis, & Floros, 2011; Guesmi and Fattoum, 2014; Boldanov, Degiannakis & Filis, 2016). Considerable scholarly research has been devoted to analyzing the correlation between the United States and China, with a specific focus on their individual stock markets. Nevertheless, a significant lack of scholarly investigation exists regarding the stock markets of alternative economies. Therefore, conducting a study on the projected consequences of oil price variations on the stock markets of various nations is of considerable importance (Smyth and Narayan, 2018; Lang and Auer, 2019). Khalfaoui, et al. (2019) put forth a study inquiry into the divergence witnessed in oil price shocks, considering the uncertain nature of responses exhibited by oil-importing nations towards these shocks.
The current corpus of early research lacks sufficient empirical evidence to effectively distinguish the effects of oil prices on stock returns in nations that are net importers of oil vs those that are net exporters. Nevertheless, the aforementioned constraint has been investigated in a recent study undertaken by Smyth and Narayan (2018). Kilian and Park (2009) conducted a study wherein they noticed that the impact of aggregate demand shocks and oil-specific demand shocks on stock returns in the United States is more significant in comparison to supply shocks. Lee and Zeng (2011) conducted a study wherein they noticed that the impact of oil price shocks on stock returns demonstrates differences contingent upon the performance of the stocks, particularly in bull and bear markets. A number of studies utilizing the quantile technique have found a stronger impact on the lower quantile compared to the upper quantile (Sim and Zhou, 2015; Zhu, et al. 2016; Reboredo & Ugolini, 2016). To achieve a thorough comprehension of the dynamics of oil prices in diverse market scenarios, it is crucial to ascertain analogous impacts across various quantiles.
Recent study (Smyth & Narayan, 2018) has focused on the limitation mentioned above. Supply shocks have less of an effect on US stock returns than do aggregate demand shocks and demand shocks related to oil, according to Kilian and Park's 2009 research. A research by Lee and Zeng (2011) revealed that the effect of shocks to oil prices on stock returns differs based on how well firms perform in bull and bear markets.
Several studies utilizing a quantile technique have found that the impact is more prominent in the lower quantile compared to the upper quantile (Sim and Zhou, 2015; Zhu, Guo, You & Xu, 2016; Reboredo & Ugolini, 2016). To achieve a thorough comprehension of the dynamics of oil prices in diverse market conditions, it is crucial to ascertain analogous impacts across various quantiles.
Impact of Oil Prices on Stock Returns: A Literature Review
Impact of Oil Prices on Stock Returns: DCC GARCH Models
The existing body of literature pertaining to the estimation of oil price volatility's impact on stock returns demonstrates a shared reliance on econometric methods, specifically vector autoregressive models (Cong, et al. 2008; Miller and Ratti, 2009; Gupta and Modise, 2013; Kang, et al. 2015). The recent literature has embraced GARCH-type models in order to gain a better understanding of the fluctuations in oil prices. This increasing focus on comprehending oil price volatility is seen in the works of Chang, McAleer, and Tansuchat (2010), Filis et al. (2011), Guesmi and Fattoum (2014), Khalfaoui et al. (2019), and Xu, Zhu, Guo, You, and Xu (2019).
Aloui and Jammazi (2009) used a univariate regime-switching EGARCH model to examine the relationship between significant developed stock markets and crude oil shocks. With respect to the system's mean and variance, the researchers identified two unique patterns of activity. Whereas the other pattern had a high mean and low variation, the first pattern had a low mean and high variance. It was shown that the regime of low mean and large variance was connected to recessionary times. Lee and Chiou (2011) examined the association between WTI oil prices and S&P 500 returns using a similar univariate regime-switching GARCH model.
The findings indicated that the presence of asymmetric price movements has a detrimental effect on the performance of stock returns. Previous literature has assumed that oil prices and stock returns follow a linear and symmetric pattern (Zhu et al., 2011). However, more recent studies have highlighted the presence of asymmetric volatility in the past. Despite this, there is limited research available that incorporates these asymmetries in the estimation of volatility spillover (Smyth and Narayan, 2018; Xu et al., 2019). In their study, Mohammadi and Su (2010) utilized various GARCH models to examine the dynamics of oil prices on stock returns. They specifically considered both symmetric and asymmetric specifications in their analysis. The findings of the study indicated that the volatility of oil returns displayed fluctuations over time, and the effects of variance asymmetry were inconclusive. In their study, Filis et al. (2011) employed a multivariate asymmetric DCC-GARCH methodology to discern the dynamic connections between Brent oil prices and stock markets in both oil-importing and oil-exporting nations. The findings of the study indicate that the connection between variables was contingent upon the source of the oil shock, with demand-related shocks exhibiting a stronger influence compared to supply-related shocks. Guesmi and Fattoum (2014) employed a multivariate GJR-DCC-GARCH model to estimate the dynamic volatility spillover between oil prices and oil-exporting-importing countries. This approach was utilized to identify any presence of asymmetric volatility. The findings of the study demonstrate that there is a positive relationship between conditional correlation coefficients and aggregate demand. Additionally, it was shown that considerable fluctuations in oil prices can be attributed to the presence of economic uncertainty. Trabelsi (2017) utilized the DCC-GARCH methodology to examine the temporal patterns of the spillover impact of oil prices on three stock market indices of oil-exporting countries, namely Saudi Arabia, United Arab Emirates, and Russia. The study's findings suggest that the spillover effect can be attributed to the origin of the oil stock events. In their study, Ping, Ziyi, Tianna, and Qingchao (2018) employed the DCC-GARCH and VAR-BEKK-GARCH frameworks to assess the spillover effect of fuel oil spot and futures on energy stock markets in China. The results of their analysis indicated a bidirectional flow between oil price and the energy stock market. In their study, Khalfaoui et al. (2019) employed the DCC-GARCH model to analyze both symmetric and asymmetric scenarios. The results of the study indicate that nations reliant on oil imports may not exhibit a substantial response to fluctuations in oil prices. Nevertheless, it is noteworthy that delayed oil price shocks do exert a noteworthy influence on these oil-importing nations. In their study, Xu et al. (2019) employed an asymmetric generalized dynamic conditional correlation (AG-DCC) model to examine the relationship between oil prices and the stock market. The results of their analysis revealed that bad news had a stronger influence compared to positive news, suggesting the presence of an asymmetric effect.
The Impact of Oil Price Fluctuations on Stock Returns: A Quantile Regression Analysis
The influence of oil prices on stock returns exhibits variability across distinct market contexts, namely bullish and bearish market conditions. Furthermore, the magnitude of this effect is subject to variation in response to both significant oil price shocks and lesser shocks, as observed in the study conducted by Sim and Zhou (2015). Previous research has employed quantile regression analysis to investigate the impact of exogenous variables on stock index returns in relation to oil prices under varying market conditions (Mensi, Hammoudeh, Reboredo, & Nguyen, 2014; Sim and Zhou, 2015; Zhu et al, 2016; Reboredo and Ugolini, 2015; Nusiar and Olson, 2018; Tiwari, Jena, Mitra, & Yoon., 2018; Balcilar, Demirer, & Hammoudeh, 2019). In their study, Mensi et al. (2014) examined the impact of global factors, oil prices, gold prices, the VIX, and the economic policy uncertainty index on the economies of the BRICS countries. They employed a quantile technique to analyze these relationships. The findings indicate that there is a positive correlation between gold prices and stock prices in both the upper and lower extremes. Additionally, it was seen that the VIX index had a notable influence during bear markets in the BRICS countries. Conversely, economic policy uncertainty did not have any discernible impact in either bull or bear markets. In their study, Sim and Zhou (2015) discovered that negative oil price shocks had a beneficial impact on US stocks under the condition that the US market experienced favourable performance. This conclusion was reached by the utilization of the quartile technique. In their study, Reboredo and Ugolini (2015) employed a quantile regression methodology to examine the response of equities to oil price shocks. They classified the quantiles of stock returns based on changes in oil prices within the interquartile range. The analysis focused on three developed economies (United States, United Kingdom, and European Union) as well as the BRICS countries. The findings indicate that minor fluctuations in oil prices do not have a discernible effect on stock returns. However, when comparing the lower quartile to the upper quartile, it becomes evident that the former exerts a considerable influence. In their study, Zhu et al. (2016) investigated the correlation between oil prices and industry-specific stock returns in China. The findings revealed that the stock returns in the lower quantiles are influenced by both cost and demand dependence. In their study, Nusair and Al-Khasawneh (2018) conducted an analysis to examine the relationship between oil prices and stock returns in Gulf Cooperation Council (GCC) countries. Their findings indicate that, in a bullish market, an upward movement in oil prices positively affects stock returns. Conversely, in a bearish market, a decline in oil prices negatively impacts stock returns. In their study, He and Westerhoff (2005) conducted an analysis to examine the impact of nonlinear interactions among market participants on the formation of bull and bear markets. In their study, Tiwari et al. (2018) conducted an estimation of the effects of oil price shocks on thirteen sectorial indicators within the Indian equities market. In general, it has been observed that nine sectors offer diversification options in a bullish market due to their substantial influence on oil price fluctuations. Conversely, during a bearish market, three sectors have been identified as having a significant impact. Nusiar and Olson (2019) conducted a study that examined the effects of oil price shocks on Asian exchange rates by employing a quantile regression methodology. The findings suggest that in a bullish market, there was an appreciation of the currency, and in a bearish market, there was a depreciation of the currency. In their study, Balcilar et al. (2019) assessed the asymmetric influence of oil prices on emerging and frontier stock markets. They employed a quantile-on-quantile approach for their analysis. The study revealed that there is a notable level of risk associated with oil price shocks, particularly at lower quantiles, inside emerging and frontier economies. Interestingly, certain eastern European nations demonstrated positive oil risk exposures even during periods of bullish market conditions. In their study, Lyócsa, Š. et al. (2020) utilized quantile regression analysis to examine the effects of hacking assaults on the conditional distribution of bitcoin volatility. The researchers discovered that these attacks exert a notably significant influence on the upper quantiles of the distribution.
Methodology
The GARCH Model and Asymmetric Extensions
The Engle (2002) dynamic conditional correlation (DCC) model is estimated in two steps. In the first step, the GARCH parameters are estimated. In the second step, the conditional correlations are estimated. ytdz
 [1]
[1]
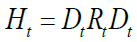
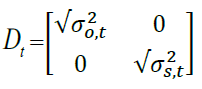
“Ht is a n×n conditional covariance matrix. is the conditional correlation matrix is the k×k diagonal matrix of time-varying standard deviations from univariate GARCH models.
with  on the ith diagonal
 [2]
[2]
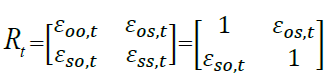
is the time varying correlation matrix.
 [3]
[3]
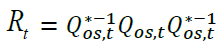
Further, R has to be definite positive, and all the parameters should be equal to or less than one. In order to ensure this Rt has been modeled as
 [4]
[4]
Where
 [5]
[5]
Where is the unconditional variance between series and i and j and follows a GARCH process, Q* is the unconditional covariance between the series estimated in step 1 and the scalar parameters θ1 and θ2 are non-negative and satisfy θ1+θ2< 1.
Following the methodology of Engle [2002], the parameters θ1 and θ2 are estimated by maximizing the log-likelihood function. The log-likelihood function can be expressed as:
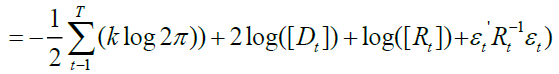 [6]
[6]
As the above model DCC model does not allow for asymmetries and asset specific news impact parameter, the modified model of Cappiello, Engle, & Sheppard, [2006] for incorporating the asymmetrical effect and asset specific news impact can be written as:
 [7]
[7]
Where
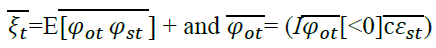
Here θ3 is the asymmetric term which captures periods where both oil and stock market experience bad news making  This model is estimated using Maximum Likelihood techniques based on BFGS optimization algorithm. We adopt student-t multivariate distribution of the time series returns, which is more suitable and gives better estimation results”.
Quantile Regression Analysis (QRA)
Since the QRA takes into account a collection of regression curves that vary across different quantiles of the conditional distribution of the dependent variable, it has become a widely used technique for modeling the degree and structure of dependency. It was first developed by Koenker and Bassett in 1978. The quantile functions yield a more accurate and exact conclusion of the effects of conditional variables on the dependent variable than do traditional linear correlation or regression, or even non-linear regression techniques. Utilizing QRA also has the benefit of being able to offer information on both extreme tail dependency (i.e., upper and lower tails) and average dependence. Let y be a dependent variable assumed to be linearly dependent on x. Thus, the τ th conditional quantile function of y is specified as follows:
 [8]
[8]
where “{fy (b|x) is the conditional distribution function of y given x, and the QR coefficient β(τ) determines the dependence relationship between vector x and the τ th conditional quantile of y. Dependence is unconditional if no exogenous variables are included in x, while it is conditional if exogenous variables are added to x. The values of (τ) for τ ∈ [0, 1] determine the complete dependence structure of y. The dependence of y, based on a specific explanatory variable in vector x, could be: (a) constant when the values of (τ) do not change for different values of τ; (b) monotonically increasing (decreasing) when (τ) increases (decreases) with the value of τ; and (c) symmetric (asymmetric) when the value of (τ) is similar (dissimilar) for low and high quantiles”.
The coefficients (τ) for a given τ are estimated by minimising the weighted absolute deviations between y and x:
 [9]
[9]
Where “is the usual indicator function. The solution to this problem is obtained using the linear programming algorithm recommended in Koenker and D’Orey (1987). The standard errors for the estimated coefficients can be obtained using the paired bootstrapping procedure proposed by Buchinsky (1995), since this procedure provides standard errors that are asymptotically valid under heteroscedasticity and misspecifications of the QR function”.
Data and Analysis
The present study considered weekly return of the G7 and BRICS countries - Canada, United States, Japan, France, Germany, Italy, United Kingdom. Brazil, Russia, India, China and India. For oil prices, the study considers weekly spot price of West Texas Intermediate (WTI) crude oil prices from the US Energy Information Agency (http://www.eia.doe.gov). The WTI oil price is frequently utilized as the industry standard for oil pricing and has a strong correlation with the prices of the other two main crude oil categories, Brent and Dubai. The time span considered for the study includes from 1 June 2000 till May 2020, which includes the major crisis financial and economic crisis (Housing Market Boom, 9/11 terrorist attack in US, second world war in Iraq, pre, post crises impact of big oil price shock of 2008, Covid-19 crisis and the recent oil price trends).
The returns of the variables are calculated by taking the natural logarithm of closing prices using equation 16.
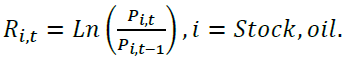 [16]
[16]
The WTI oil prices and the stock market return series are shown in Table 1 with descriptive statistics. Each series' returns are negatively skewed, meaning that there is a greater chance of losses than profits throughout the specified time. All of the series had kurtosis values more than 3, suggesting the existence of dramatic fluctuations in both the direction and the series' departure from a normal distribution.
Similar deviation from normal distribution was confirmed from Jarque–Bera (JB) statistics. These deviations of the data are well captured in the Quantile regression analysis, which assess for both lower and upper tails of the distribution.
Further, correlation between the stock index returns and WTI oil price returns indicate negative relationship with G7 countries France, Germany, Italy and BRICS countries Brazil, India, and South Africa. Positive relationship with Canada, Japan, UK, USA and China, Russia
apparently, a strong positive correlation is found between oil returns and USA, China, Japan, Canada, Russia stock market. Economic development and industrial earnings growth are positively correlated with rising oil prices, according to this positive association.
Correlation analysis is unconditional and static, which represents long-run average and does not capture the effects of unforeseen events (Swamy, P., & Padma, K, 2020). Therefore, Asymmetric Dynamic Conditional Correlations (ADCC) -GARCH are used to capture the time varying movements of WTI Oil and stock markets. In order to assess stationarity, we used three common unit root tests: the Kwiatkowski–Phillips–Schmidt–Shin (KPSS) test, the Phillips–Perron (PP) test, and the Augmented Dickey–Fuller (ADF) test. According to the ADF, PP, and KPSS tests, WTI Oil and each return series are stationary at level.
Results and Discussions
ADCC GJR & EGARCH Estimation
The results of asymmetric DCC- GJR GARCH and EGARCH model are presented in Table 2. The ADCC-GARCH-GJR Approach indicates that shocks have statistically significant effect on conditional volatility for the developed stock market. ADCC-GARCH-GJR captures the impact of news on stock market behaviour, where bad news is more important than good news. The short run persistence parameter θ1 is negative and significant for all G7 and BRICS Countries. θ2 is positive and significant in the long run for most of the countries except Canada, USA from G7 Countries and Brazil from BRICS. However, θ2 is negative and significant only for the USA and Canada which indicates the persistence of negative shocks on the dynamic conditional correlation. Asymmetry in the dynamic conditional correlation θ3 is negative and significant for Germany, Japan, Italy, USA; This indicates that bad news is more important than good news for the dynamic conditional correlation behaviour of oil and stock market similarly, positive and significant for India and South Africa. This indicates that good news is more important than bad news for the dynamic conditional correlation behaviour of oil and stock market. Asymmetry-DCC EGARCH is employed to estimate leverage effect. Asymmetry-DCC EGARCH helps to identify the positive or negative relationship between volatility and returns. The result from the estimation show θ1 is negative and significant for all G7 and BRICS Countries. This explains the persistence of negative shocks on the dynamic conditional correlation in short run. θ2 is positive and significant for most of the countries, θ2 is negative and significant for USA and Canada and Brazil. Asymmetry in the dynamic conditional correlation θ3 is negative and significant for USA Canada Japan, Italy, which indicates the relationship between volatility and returns is negative. θ3 is positive and significant for India which indicates the positive relationship between volatility and return.
The graphs produced by the ADCC-GARCH GJR model's computation of the time-varying correlation coefficients between the prices of WTI oil and each stock market index are displayed in Figure 2. Changes in the precautionary demand for crude oil during the 9/11 terrorist assault in the United States, the massive strike in Venezuela, and the second Iraqi conflict all occurred between 2000 and 2004.

Figure 2 Time Varying Correlations of WTI Oil and Developed Countries’ Stock Returns
However, in mid-2001 and early 2002 an increasing and positive dynamic conditional correlation for Germany, Japan, China and India can be noted. The invasion of Iraq marked a significant event for oil markets and stock markets, due to presence of large global oil reserves in Iraq. A spike in oil prices resulted from this occurrence, and this had a detrimental knock-on effect on global financial markets. We see that there is a significant negative or low link between WTI oil prices and those of South Africa, Russia, the USA, Canada, Italy, and the UK in 2003. An increasing pattern in dynamic co-movements for most of the OECD countries in 2004 is due to recovery in all the main economies of the OECD region. Similarly, decreasing pattern in time-varying correlations for France, Germany, can be found in 2005. These decreasing time-varying correlations pattern could be due to US supply disruption, growth rate in Euro-zone and the uncertainty in Gulf of Mexico. The analysis further show volatility in oil market during 2006-2007 due to rapid economic growth in emerging countries. This led oil prices to unprecedented levels, where moderate fluctuations in dynamic conditional correlations are noted. From 2007-2009, low and negative dynamic correlations viewed in case of Canada, and the US. In the year 2008 found a steep decline in Germany, France, Italy, Japan, UK and Italy. The global financial crisis triggered the uncertainty in financial system led to crisis both in the stock markets and the oil market.
The fact that a crisis of this nature drove oil prices steadily lower and forced stock markets into negative territory explains the positive association.
France, Germany, Italy, Japan, and the UK show downward shift in dynamic conditional correlations with WTI oil (specially in mid-2008 global financial crisis period). These nations are among the largest contributors of volatility transmissions during the Global Financial Crisis B.R. Guru et al. The BRICS countries stock markets (Brazil, Russia, India, China and South Africa) also got affected by the uncertainty over the US bailout plans continued to stoke fears of a looming recession and the worldwide spread of the turmoil. The decision in July 2008 by Saudi Arabia to increase oil output caused little significant influence on prices. However, the financial crisis continued (bubble-bursting sell-off began), and petroleum demand growth was dented by the dominant bearish outlook this led to steep decline in oil prices to $32. The economic crisis of 2008 continued to affect in the year 2009.
We observe decreased trend in time-varying co-movements in 2012. Arab Spring and geopolitical unrest in MENA region, followed by supply glitches in European and East African crude oil production are some of the factors. Increase in co-movements is noticed at early 2013, however, this trend gradually declined at the end of 2014. Additionally, in 2014 crude oil prices dropped by about a third with increased production in U.S. tight oil (shale oil). The decreased economic activity led to decrease in oil demand, which was further coupled with crisis in Ukraine and OPEC decision to continue oil production which increased volatility in oil prices.
In this context, Japan followed similar co-movements. Early 2020, the time varying co-movements increased in Canada. Italy, the USA. While significant decline in co-movements was evidenced from March 2019 among countries such as Japan, and the UK. Overall, oil prices also witnessed volatility in 2019 - 20 due to rising geopolitical tensions in several oil producing countries, as well as trade tensions between major economies. In February 2020, oil reached its lowest level, with the widespread of COVID-19 pandemic and lockdown of major economies.
The main conclusion of the study is that there appears to be a substantial correlation between oil and stock market prices during times of global unrest or as a result of changes in the global business cycle (expansion or contraction). Additionally, precautionary demand-side shocks (such as the second Iraq War and the 9/11 terrorist attack) typically result in a negative correlation between oil and stock markets, but aggregate demand-side shocks to oil prices (such as the COVID-19 Pandemic, the Asian Crisis, the Housing Market Boom, Chinese Economic Growth, and the Latest Global Financial Crisis) typically cause a significant positive correlation. Table 3 offers a synopsis of the results.
Quantile Regression Analysis
The effect of oil shocks on stock index returns is examined under three distinct market scenarios: the conditional distribution of stock returns is positive (bullish) when it is high (τ = 0.70, 0.80, 0.90), negative (bearish) when it is low (τ = 0.10, 0.20, 0.30), and normal (average) when it is medium (τ = 0.40, 0.50, 0.60). The results for three market conditions and symmetric quantile test results are presented in Table 4.
Market with a Positive Outlook-Bullish Market The values of τ = 0.70, 0.80, and 0.90 are indicative of a high correspondence.
The fluctuation in oil prices has a detrimental effect on the economies of G7 countries. Germany has a value of τ = 0.7, whereas Italy has values of τ = 0.7, 0.8, and 0.9. Among the BRICS countries, Russia has a value of τ = 0.9. This finding suggests that fluctuations in oil prices have a notable adverse impact on stock market returns, particularly in the upper quantiles. Nevertheless, it is worth noting that there is evidence of a beneficial effect in Japan (τ = 0.8) and in the BRICS country of China (τ = 0.9). This finding suggests that fluctuations in oil prices have a notable and favorable impact on the returns of the stock market, particularly at higher levels of quantiles. Moreover, it is observed that countries such as Canada, the United States, France, the United Kingdom, Brazil, India, and South Africa demonstrate a limited susceptibility to fluctuations in aggregate oil prices. The stock indexes of nations that remain unaffected by external factors serve as safe investments for hedging against the danger of oil price fluctuations in a bullish market. Moreover, during a bull market, international portfolio investors have the opportunity to mitigate oil price risk by diversifying their investments among the indexes of the aforementioned countries. In relation to stock exchange returns, it is imperative to direct attention towards Germany, Italy, and Russia in the context of oil price uncertainty, as fluctuations in oil prices have a detrimental effect on the bullish market.
In this analysis, we examine the occurrence of a bear market, specifically focusing on instances where the market experiences low values of τ (0.10, 0.20, 0.30).
The fluctuation in oil prices has a favorable effect on the United States (τ = 0.1,0.2), Canada (τ = 0.1), and Japan (τ = 0.1,0.2,0.3). Russia (τ = 0.1) and China (τ = 0.1) are two countries that will be discussed in this academic context. This finding suggests that fluctuations in oil prices have a statistically significant positive impact on stock market returns, particularly at lower levels of quantiles. Nevertheless, it is worth noting that the impact of oil price shocks on the returns of the Indian stock exchange is statistically significant and negative, particularly at lower quantiles (τ = 0.3). In contrast, the stock indices of France, Germany, Italy, the United Kingdom, Brazil, and South Africa remain untouched. Therefore, it is plausible that foreign portfolio investors (FPI), foreign institutional investors (FII), portfolio managers (PMs), and other investors may exhibit a preference for investing in the stock markets of these nations as a means of hedging and diversifying during bearish market conditions. The impact of oil prices on sectoral returns becomes more diversified and diverse during a bear market, according to Broadstock and Filis (2014) and Falzon and Castillo (2013). In this study, we examine the characteristics of a normal market with corresponding average values of τ = 0.40, 0.50, and 0.60.
In typical market conditions, which align with the quantiles (τ = 0.40, 0.50, 0.60) of the return distribution. The findings indicate that fluctuations in oil prices have a detrimental impact on the stock returns in India, with a time lag of 0.4 and 0.5. Nevertheless, it is worth noting that only Japan (τ = 0.4) exhibits a positive and statistically significant impact on stock market returns at normal or average quantiles. The stock market returns of the United States, Canada, France, Germany, Italy, United Kingdom, Brazil, Russia, China, and South Africa remain unaffected by oil price shocks under normal market conditions. Ultimately, the outcomes pertaining to France and the United Kingdom Brazil and South Africa propose that oil price shocks do not exert a statistically significant influence on stock returns across all quantiles. Therefore, it is plausible that financial institutions such as FPI, FII, portfolio managers, and investors may exhibit a preference for investing in stock indices of countries that remain unaffected by oil price shocks across various market conditions, including bull, normal, and bear markets. This preference is driven by the need to achieve diversity in their investment portfolios.
The findings suggest a combination of symmetric and asymmetric effects of oil price fluctuations on the returns of stock market indices in the G7 and BRICS countries. The symmetric quantile test yields a �� 2 statistic for the Wald test, indicating the rejection of the null hypothesis for all coefficients at varying quantiles (specifically, the 10th and 90th quantiles). The test results indicate that there is symmetry in the data for Canada, France, Germany, Italy, the United Kingdom, and Brazil. The aforementioned nations' stock returns are significantly affected by idiosyncratic oil-market shocks, and according to Kisswani and Elian (2017), Arouri et al. (2011), and Zhang (2013), our results are in line with their earlier research. However, for both the USA and Japan, the �� 2 statistic obtained from the Wald test is insufficient to exclude the null hypothesis that the coefficients at the 10th and 90th quantiles are symmetric. Russia, India, China, and South Africa are among the nations being examined.
Conclusion
The dynamics between oil price shocks, and stock market return is a topic of high interest for investors, policy makers and researchers given its implications on asset allocation, risk management, and economic forecasting. Study reveals that the relationship between oil price shocks and stock returns are time varying and important events have significant impact on their dynamic relationship. Based on our research, it seems that oil risk exposures are dynamic in developed stock markets and exhibit asymmetric, time-varying, and quantile-specific features. In both bull and downturn markets, the stock market is more reliant on oil prices. Additionally, the data indicate a positive link during bear markets and a negative relationship during bull markets. But in a typical market, we discover a weak correlation between oil prices and stock returns. Bearish market situations are associated with good relationships between the major oil-exporting countries, particularly the United States and Canada.
Additionally, our analysis holds significant practical implications pertaining to the stability of the global financial system and the effective handling of extreme financial risks. The management and control of significant financial risks is of utmost importance for BRICS and G7 countries, particularly during periods of extraordinary events. It is imperative for regulators to prioritize the establishment of a multifaceted, flexible, competitive, and resilient financial system. The phenomenon of risk spillovers within the global financial system refers to the transmission and propagation of risks across many interconnected financial markets and institutions on a worldwide scale. one can employ effective hedging strategies to mitigate the potential impact of severe risks associated with oil price shocks with G7 and BRICS stock markets. Identifying the origin of shock is crucial aspect for market participants in order to optimize their investment portfolios.
The study's conclusions have significant ramifications for investors and decision-makers. First, there is variation and temporal variability in the impact of oil price shocks on the stock market returns of the G7 and BRICS nations. As a result, key triggering events and their effects on the dynamic correlations between oil and stock market returns should be the attention of investors and policymakers. It is recommended that investors and policymakers take note of the stock markets' dynamic behavior in different market situations, such as bullish, normal, and bearish. This information may be useful in making judgments about pricing, diversification, and risk management.
References
Aloui, C., Jammazi, R. (2009), “The effects of crude oil shocks on stock market shifts behaviour: A regime switching approach”, Energy Economics, 31(5) 789-799.
Indexed at, Google Scholar, Cross Ref
Arouri, M. E. H., Lahiani, A., & Nguyen, D. K. (2011), “Return and volatility transmission between world oil prices and stock markets of the GCC countries”, Economic Modelling, 28(4), 1815-1825.
Indexed at, Google Scholar, Cross Ref
Bachmeier, L. (2008), “Monetary policy and the transmission of oil shocks”, Journal of Macroeconomics, Vol. 30 No.4 pp. 1738-1755.
Indexed at, Google Scholar, Cross Ref
Balcilar, M., Demirer, R., & Hammoudeh, S. (2019), “Quantile relationship between oil and stock returns: Evidence from emerging and frontier stock markets”, Energy Policy, 134:110931.
Indexed at, Google Scholar, Cross Ref
Boldanov, R., Degiannakis, S., & Filis, G. (2016), “Time-varying correlation between oil and stock market volatilities: Evidence from oil-importing and oil-exporting countries”, International Review of Financial Analysis, 48:209-220.
Indexed at, Google Scholar, Cross Ref
Broadstock, D. C., & Filis, G. (2014), “Oil price shocks and stock market returns: New evidence from the United States and China”,Journal of International Financial Markets, Institutions and Money, 33, 417-433.
Buchinsky, M. (1995), “Estimating the asymptotic covariance matrix for quantile regression models a Monte Carlo stud”, Journal of Econometrics, 68(2), 303-338.
Cappiello, L., Engle, R. F., Sheppard, K. (2006), “Asymmetric dynamics in the correlations of global equity and bond returns”, Journal of Financial Econometrics, 4(4):537-572.
Chang, C. L., McAleer, M., Tansuchat, R. (2010), “Analyzing and forecasting volatility spillovers, asymmetries and hedging in major oil markets”, Energy Economics, 32(6):1445-1455.
Indexed at, Google Scholar, Cross Ref
Chen, S. S. (2009), “Revisiting the inflationary effects of oil prices”, The Energy Journal, 30(4):141-154.
Cong, R. G., Wei, Y. M., Jiao, J. L., Fan., Y. (2008), “Relationships between oil price shocks and stock market: An empirical analysis from China”, Energy Policy, 36(9):3544-3553.
Indexed at, Google Scholar, Cross Ref
Cunado, J., & De Gracia, F. P., (2005), “Oil prices, economic activity and inflation: evidence for some Asian countries”, The Quarterly Review of Economics and Finance, 45(1), 65-83.
Engle, R. (2002), “Dynamic conditional correlation: A simple class of multivariate generalized autoregressive conditional heteroskedasticity models”, Journal of Business & Economic Statistics, 20(3), 339-350.
Indexed at, Google Scholar, Cross Ref
Falzon, J., & Castillo, D. (2013), “A VAR approach to the analysis of the relationship between oil prices and industry equity returns”, In Bank Performance, Risk and Securitization (pp. 235-265). London: Palgrave Macmillan UK.
Filis, G. (2010), “Macro economy, stock market and oil prices: do meaningful relationships exist among their cyclical fluctuations?”, Energy Economics, 32(4):877-886.
Filis, G., Degiannakis, S., & Floros, C. (2011), “Dynamic correlation between stock market and oil prices: The case of oil-importing and oil-exporting countries”. International review of financial analysis”, 20(3):152-164.
Indexed at, Google Scholar, Cross Ref
Guesmi, K., & Fattoum, S. (2014), “Return and volatility transmission between oil prices and oil-exporting and oil-importing countries”, Economic Modelling, 38:305-310.
Gupta, R., & Modise, M. P. (2013), “Does the source of oil price shocks matter for South African stock returns? A structural VAR approach”, Energy Economics, 40:825-831.
Hamilton, J.D. (2003), “What is an oil shock?”, Journal of Econometrics, 113:363–398.
He, X.Z., and Westerhoff, F.H. (2005), “Commodity markets, price limiters and speculative price dynamics”, Journal of Economic Dynamics and Control, 29(9), 1577-1596.
Indexed at, Google Scholar, Cross Ref
Kang, W., Ratti, R. A.,Yoon, K. H. (2015), “Time-varying effect of oil market shocks on the stock market”, Journal of Banking & Finance, 61:50-S163.
Khalfaoui, R., Sarwar, S., Tiwari, A. K. (2019), “Analysing volatility spillover between the oil market and the stock market in oil-importing and oil-exporting countries: Implications on portfolio management”, Resources Policy,
Indexed at, Google Scholar, Cross Ref
Kilian, L., Park, C. (2009), “The impact of oil price shocks on the US stock market”, International Economic Review, 50(4), 1267-1287.
Kisswani, K. M., & Elian, M. I. (2017), “Exploring the nexus between oil prices and sectoral stock prices: Nonlinear evidence from Kuwait stock exchange”, Cogent Economics & Finance, 5(1), 1286061.
Indexed at, Google Scholar, Cross Ref
Koenker, R., Bassett Jr, G. (1978), “Regression quantiles”, Econometrica, Vol. 46 No.1 pp.33-50.
Kollias, C., Kyrtsou, C., Papadamou, S. (2013), “The effects of terrorism and war on the oil price–stock index relationship”, Energy Economics, 40:743-752.
Indexed at, Google Scholar, Cross Ref
Kumar, S., Managi, S. and A. Matsuda, S. (2012), "Stock Prices of Clean Energy Firms, Oil and Carbon Markets: A Vector Autoregressive Analysis", Energy Economics, 34(1), 215–226.
Lang, K., Auer, B. R.. (2020), “The economic and financial properties of crude oil: A review”, The North American Journal of Economics and Finance, 52:100914.
Indexed at, Google Scholar, Cross Ref
Lee, C. C., Lee, C. C., Ning, S. L. (2017), “Dynamic relationship of oil price shocks and country risks”, Energy Economics, 66:571-581.
Indexed at, Google Scholar, Cross Ref
Lee, C. C., Zeng, J. H. (2011), “The impact of oil price shocks on stock market activities: Asymmetric effect with quantile regression”, Mathematics and Computers in Simulation, 81(9): 1910-1920.
Indexed at, Google Scholar, Cross Ref
Lee, C., Chiu, Y. (2011a), “Nuclear energy consumption, oil prices, and economic growth: evidence from highly industrialized countries”, Energy Economics, 33(2):236–248.
Indexed at, Google Scholar, Cross Ref
Lee, C., Chiu, Y. (2011b), “Oil prices, nuclear energy consumption, and economic growth: new evidence using a heterogeneous panel analysis. Energy Policy”, 39(4):2111–2120. https://doi.org/10.1016/j.enpol.2011.02.002. Google Scholar
Indexed at, Google Scholar, Cross Ref
Lee, Y. H., Chiou, J. S. (2011), “Oil sensitivity and its asymmetric impact on the stock market”, Energy, 36(1):168-174.
Lyócsa, Š., Molnár, P., Plíhal, T. and Šira?ová, M. (2020), “Impact of macroeconomic news, regulation and hacking exchange markets on the volatility of bitcoin”, Journal of Economic Dynamics and Control, 119, p.103980
Managi, S., and T. Okimoto. (2013), “Does the Price of Oil Interact with Clean Energy Prices in the Stock Market?”, Japan and the World Economy 27: 1-9. Google Scholar.
Mensi, W., Hammoudeh, S., Reboredo, J. C., Nguyen, D. K. (2014), “Do global factors impact BRICS stock markets? A quantile regression approach”, Emerging Markets Review, 19:1-17.
Miller, J. I., Ratti, R. A. (2009), “Crude oil and stock markets: Stability, instability, and bubbles”, Energy economics, 31(4):559-568.
Indexed at, Google Scholar, Cross Ref
Mohammadi, H., Su, L. (2010), “International evidence on crude oil price dynamics: Applications of ARIMA-GARCH models”, Energy Economics, 32(5), 1001-1008.
Indexed at, Google Scholar, Cross Ref
Narayan, P. K., Narayan, S. (2010), “Modelling the impact of oil prices on Vietnam’s stock prices”, Applied Energy, 87(1):356-361.
Indexed at, Google Scholar, Cross Ref
Newell, R., Raimi, D., Aldana, G. (2019), “Global energy outlook 2019: the next generation of energy”, Resources for the Future, 8-19.
Nusair, S. A., Al-Khasawneh, J. A. (2018), “Oil price shocks and stock market returns of the GCC countries: empirical evidence from quantile regression analysis”, Economic Change and Restructuring, 51(4):339-372.
Indexed at, Google Scholar, Cross Ref
Papapetrou, E. (2001), “Oil price shocks, stock market, economic activity and employment in Greece”, Energy Economics, 23(5):511–532.
Indexed at, Google Scholar, Cross Ref
Park, J., Ratti, R.A. (2008), “Oil price shocks and stock markets in the US and 13 European countries”, Energy economics, 30(5), 2587-2608.
Ping, L., Ziyi, Z., Tianna, Y., Qingchao, Z. (2018), “The relationship among China’s fuel oil spot, futures and stock markets”, Finance Research Letters, 24:151-162.
Indexed at, Google Scholar, Cross Ref
Reboredo, J.C., Ugolini, A. (2016), “Quantile dependence of oil price movements and stock returns”, Energy economics, 54:33-49.
Indexed at, Google Scholar, Cross Ref
Sim, N., Zhou, H. (2015), “Oil prices, US stock return, and the dependence between their quantiles”, Journal of Banking & Finance, 55:1-8.
Indexed at, Google Scholar, Cross Ref
Smyth, R., Narayan, P.K. (2018), “What do we know about oil prices and stock returns?”, International Review of Financial Analysis, 57:148-156.
Indexed at, Google Scholar, Cross Ref
Swamy, P., Padma, K. (2020), “An empirical examination of correlation dynamics between commodity and equity derivative indices: evidence from India using DCC-GARCH models”, Afro-Asian Journal of Finance and Accounting, 10(2): 207-234.
Tiwari, A.K., Jena, S.K., Mitra, A., Yoon, S.M. (2018), “Impact of oil price risk on sectoral equity markets: Implications on portfolio management”, Energy Economics, 72:120-134.
Trabelsi, N. (2017), “Tail dependence between oil and stocks of major oil-exporting countries using the CoVaR approach”, Borsa Istanbul Review, 17(4):228-237.
Indexed at, Google Scholar, Cross Ref
Xu, B. (2015), “Oil prices and UK industry-level stock returns”, Applied Economics, 47(25): 2608-2627.
Indexed at, Google Scholar, Cross Ref
Xu, W., Ma, F., Chen, W., Zhang, B. (2019), “Asymmetric volatility spillovers between oil and stock markets: Evidence from China and the United States”, Energy Economics, 80:310-320.
Indexed at, Google Scholar, Cross Ref
Zhang, D. (2017), “Oil shocks and stock markets revisited: Measuring connectedness from a global perspective”, Energy Economics, 62:323-333.
Indexed at, Google Scholar, Cross Ref
Zhu, H. M., Li, R., Li, S. (2014), “Modelling dynamic dependence between crude oil prices and Asia-Pacific stock market returns”, International Review of Economics & Finance, 29:208-223.
Indexed at, Google Scholar, Cross Ref
Zhu, H., Guo, Y., You, W., Xu, Y. (2016), “The heterogeneity dependence between crude oil price changes and industry stock market returns in China: Evidence from a quantile regression approach”, Energy Economics, 55:30-41.
Indexed at, Google Scholar, Cross Ref
Zhu, H.M., Li, S.F, Yu, K. (2011), “Crude oil shocks and stock markets: A panel threshold cointegration approach”, Energy Economics, 33(5):987-994.
Indexed at, Google Scholar, Cross Ref
Received: 29-Jan-2024, Manuscript No. AMSJ-24-14587; Editor assigned: 30-Jan-2024, PreQC No. AMSJ-24-14587(PQ); Reviewed: 29-May-2024, QC No. AMSJ-24-14587; Revised: 26-Jun-2024, Manuscript No. AMSJ-24-14587(R); Published: 04-Aug-2024