Research Article: 2021 Vol: 20 Issue: 4S
Digital Transformation Strategies of UAE Enterprises: A Dynamic Capabilities Perspective
Suja Pradeep, Khawarizmi International College
Majdi Khaleeli, Khawarizmi International College
Adnan Jawabri, Khawarizmi International College
Keywords:
Digital Transformation, Dynamic Capabilities, Strategic Management, Covid 19, UAE Enterprises
Abstract
The UAE vision 2021 gives strong thrust towards digital initiatives, such as e-governance in the government sector, digital currency and block chain etc. In this respect, the UAE companies are much more well placed than their global peers in Digital Transformation even before the covid-19 pandemic spread. The IMD World ranking 2019 placed the UAE first in the region and 12th Globally in Digital Competitiveness. The study throws light on the organization wide strategies undertaken by the UAE based pre digital enterprises in their process of digital transformation. It explores organizational practices that shape a successful digital transformation strategy and a number of factors that can hinder the execution of their transformation from the perspective of front-line and middle-level executives. The findings provide enterprises a framework to assess their current processes and strategies against the key building blocks of successful digital transformation in their endeavour to achieve a dynamic fit with the environment. This paper fulfills an identified need to develop a process model encompassing the pertinent variables of DT strategies of the UAE enterprises.
Introduction
The UAE vision 2021 gives strong thrust towards digital initiatives, such as e-governance in the government sector, digital currency and block chain etc. In this respect, the UAE companies are much more well placed than their global peers in Digital Transformation even before the covid-19 pandemic spread. The IMD World ranking 2019 places UAE as the first in the region and the 12th Globally in Digital Competitiveness. It shows that the macro-economic imperatives are supportive to such an endeavor. Nonetheless it is whimsical to assume that every firm tunes to swan events and disruptions, those firms which are in the path of innovations are seemed to be successful enterprises that sense, organize capture and renew (Teece et al., 2020). The explanation given by Porter (2015) highlights that these transformations substantially change the classic organizational structure, systems, control and coordinating mechanisms in every layer of the firm. This according to Hartl & Hess (2017) substantiate it as a ‘blended strategy approach’, where the basic elements of organizational design, structure, control and culture evolve on a top-down vision and bottom-up strategic initiatives to emerge (Grant, 2003) and in this the role of strategic leadership (Burgelman & Grov, 2007) is to appropriately balance exploitation and exploration (Lavie et al., 2010; Gupta et al., 2006; March, 1991).
Digital Transformation is ubiquitous, involving nearly in every domain, (Tihinen & Kääriäinen, 2016), and is profoundly transforming the economy and contemporary society (Schwab, 2015). Digital technologies as per Sebastian, et al., ( 2017), is social, mobile analytics, cloud and IoT, platforms etc, which enables major organizations wide transformations. This helps the business to develop new business models as illustrated by Warner (2018). Several view it as a process giving rise to changes in manifold ways as a result of its introduction (Agarwal et al., 2009; Majchrzak et al., 2016). Today it is viewed as a survival strategy for the global firms to overcome the issues of competition and in this way it is a live area for the social science research fraternity to develop newer dimensions (Bharadwaj et al., 2013; Piccinini et al., 2015a; Fitzgerald et al., 2014; Westerman et al., 2011). Hess, et al., (2016) view it as innovative digital strategies or technology in improving operational efficiency of the firms. Many view DT is strategy linked to structural changes as well as process and culture (Bharadwaj et al., 2013; Matt et al., 2015; Selander & Jarvenpaa, 2016; Karimi & Walter, 2015), all these help to generate into the creation of value (Svahn et al., 2017a). Some have focussed DT on dynamic capabilities of firms (Skog et al., 2018) primarily describing firm’s ability to “create, deploy, modify, reconfigure, upgrade or leverage its resources over time”, whereas Rothaermel & Hess (2007) use DT to prevent firm’s core competencies so as to overcome core rigidities (Lucas & Goh, 2009; Raisch & Birkinshaw, 2008; Barton, 1992). Yet some argue about the causes of ruptures of firms that may cause threats on DT (Bonnet et al., 2015). In this respect the assessment of risks is paramount in determining the success of firms (Lucas et al., 2013; Legner et al., 2017, Mouef et al., 2020). Despite the availability of prolific literature on DT, literature particularly sheds light to its implications in the form of value creation are still missing. The Covid-19 crisis forced companies worldwide to work on overtime with several responding 40 times quicker than that of the pre-crisis period, which in turn comes with an average of 11 days to articulate a workable solution. Several barriers have to change, such as the fear of customer resistance in use of cloud-based software (McKinsey, 2020). Undoubtedly there have been several winners and losers, but the bounty in the form of revenue generation exemplify the need for a strategy that warrants firms to have better technological capabilities (Kaufman & Horton, 2015). Based on this backdrop, the present article explores the content and process of digital transformation strategies of the UAE enterprises through the bottom-up lens of strategic management. Drawing heavily on the dynamic capabilities, it is tried to develop a digital transformation index of UAE enterprises in their preparedness and responses embedding the COVID-19 Pandemic havoc. It is expected that this framework helps companies to identify the key success factors for the successful implementation of Digital Transformation Strategy to navigate well in the troubled waters so as to generate an ocean of opportunities to the firms.
Theoretical Framework And Methodology
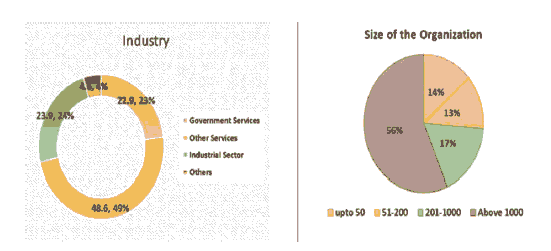
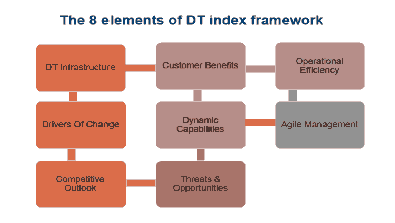
The theoretical framework of the study sits on 8 key elements of DT, such as DT Infrastructure, Customer benefits, Operational Efficiency, Competitive Outlook, Drivers of change, Dynamic capabilities, Agile management, Threats and Opportunities. This is embedded into a single theoretical base giving rise to DT aspects, this is further classified into 68 sub-indicators in an analytical framework. The present and future approaches towards their DT Strategy are evolved from the performance of the enterprises in terms of these indicators, hence chosen as the theoretical basis of the study. Figure 1 and Figure 2 outlines the basic profile and size of the respondents’ organizations. Enterprises having 1000 and more employees form 56% of the sample.
UAE based digitally changed firms prior to digital revolution are considered as the universe of this study, as these enterprises have not been born digital (Sebastian et al., 2017) as Uber or Facebook, but existed prior to digital revolution (Engesmo & Panteli, 2020). In the case of pre-digital enterprises, digital transformation is found to be posing existential enigma hence needs to undergo huge transformations (Chanias et al., 2019). Structured questionnaires are sent to 200 executives and 110 have responded are collected, hence forms the sample for the study. To identify, the underlying variables enabling digital transformation, statistical tools like factor analysis and indexing methods are used. A sector-wise comparison of each indicator is also worked out and presented in an Indexed form. The result is evaluated on the basis of a process model encompassing the pertinent variables of DT strategies of the UAE enterprises.
Results and Discussions
Digital Transformation Infrastructure
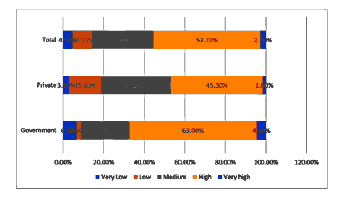
Based on this-12 sub variables relating to DT infrastructure available in the enterprise are recorded which include Analytics, Cloud Computing, Social Media, AI, Mobile App, Interactive Website, 3D Prinitng, Robotics, Digital Platforms, Payment Gateways, Online Shopping and IOT and thereby an aggregate score is obtained. The result is shown in Figure 4. Though, 52.7 percent perceive that the performance with regard to the DT infrastructure is high, 30 percent have the opinion that the DT infrastructure in their enterprise has grown or performs at moderate level. Sector-wise, percentage of government institutions with high DT infrastructure are higher than the private sector (63 percent for government and 45.3 percent for the private). About 34.4 percent of the employees in the private sector have given DT infrastructure in their institution with medium score, 18.7 percent feel that the DT infrastructure in their organisation has low (15.6 percent) or very low (3.1 percent) levels of performance. Overall, the private-government sector differences relating to DT infrastructure is evident but it is small. In aspects like digital platform, mobile apps and analytics, the government sector has a clear edge over the private sector as shows in Figure 3.
The Factor Analysis (FA) is used to identify the pertinent DT infrastructure indicators and this is given in Table 1. Kaiser-Meyer-Olkin (KMO) Measure of Sampling Adequacy test value is 0.640 and Bartlett's Test of Sphericity is significant. Five components are extracted as per the component matrix. However, the first component has seven indicators with scores of 0.49 and above. This shows that 3D printing and robotics have scores below the threshold value in all the components. The other three indicators of DT viz. IOT, AI and online shopping feature as components 3, 4 and 5, respectively.
| Table 1 Factor Analysis Results : DT Infrastructure Variables |
|||||
|---|---|---|---|---|---|
| Component | |||||
| 1 | 2 | 3 | 4 | 5 | |
| Analytics | 0.497 | 0.02 | 0.431 | 0.2 | -0.203 |
| CloudComputing | 0.547 | -0.442 | 0.337 | 0.117 | -0.071 |
| SocialMedia | 0.496 | -0.416 | -0.311 | 0.288 | 0.212 |
| MobileApp | 0.554 | 0.421 | -0.041 | 0.222 | -0.424 |
| AI | 0.481 | 0.16 | -0.307 | 0.257 | 0.546 |
| InteractiveWebsite | 0.637 | -0.255 | 0.029 | -0.291 | -0.252 |
| 3D Prinitng | 0.486 | 0.443 | -0.435 | 0.112 | -0.281 |
| Robotics | 0.428 | -0.13 | 0.174 | 0.374 | 0.314 |
| DigitalPlatforms | 0.497 | -0.359 | -0.095 | -0.432 | -0.164 |
| PaymentGateways | 0.521 | 0.452 | -0.011 | -0.33 | 0.207 |
| OnlineShopping | 0.345 | 0.168 | 0.184 | -0.586 | 0.402 |
| IOT | 0.046 | 0.332 | 0.723 | 0.149 | 0.098 |
| Kaiser-Meyer-Olkin Measure of Sampling Adequacy: 0.640; Bartlett's Test of Sphericity: Approx. Chi-Square-172.566, Sig.-.000 | |||||
Customer Benefits
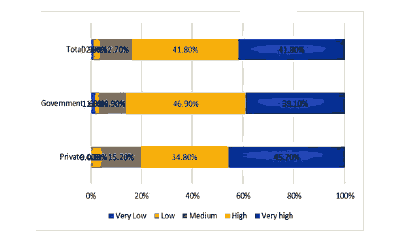
The six attributes relating to the customer benefits owing to the adoption of DT in their organisation viz. Understand customers’ changing digital needs and preferences, Responsive to the changing digital needs of the customers, Developing compelling new digital experiences for the customers, New digital products and services, Digitalized existing products and services and Enhanced customer experience are compiled in the form of an index and evaluated sector-wise and presented in Figure 4 Sector-wise, the customer benefits are given very high scores of 45.7 percent of the private sector employees compared to 39.1 percent in the government sector. The result evinces that though both government and private sectors have set a standard in providing customer benefits by understanding the digital needs of the customers and responding to the same, the private sector has more responses giving very high aggregate rating. In fact, if evaluated separately, all the six sub-indicators have impressive scores. The result of the FA (Table 2) seconds this inference as all the six indicators feature as the first component.
Despite the fact that the present focus of their institution is on improving operational efficiency, the performance is impressive in terms of customer benefits as the institution is still able to understand the customer needs and providing new digitalised products and services together with their old products/services. Nonetheless the focus is on improving operational efficiency aspects through DT as a business-customer model, the benefit of digitalisation also trickles down to the customers giving them an enhanced customer experience as shows in Table 2.
| Table 2 Factor Analysis Results : DT Customer Benefit Variables |
||
|---|---|---|
| Component | ||
| 1 | ||
| Understand customers’ changing digital needs and preferences | 0.86 | |
| Responsive to the changing digital needs of the customers | 0.853 | |
| Developing compelling new digital experiences for the customers | 0.875 | |
| Has new digital products and services | 0.835 | |
| Has digitalized existing products and services | 0.753 | |
| DT has enhanced customer experience for your company | 0.862 | |
| Kaiser-Meyer-Olkin Measure of Sampling Adequacy: 0.850; Bartlett's Test of Sphericity: Approx. Chi-Square-472.808, Sig.-.000 | ||
Operational Efficiency
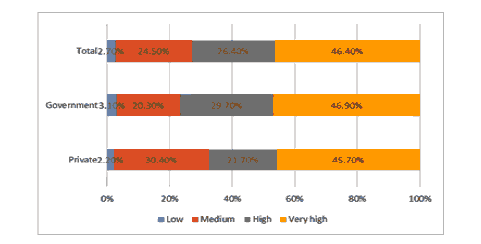
Two aspects relating to the DT operational efficiency, Strength in digital capabilities to drive operational efficiency and Digitalisation of supply chains are compared. About 72.8 percent of the enterprises have succeeded in achieving operational efficiency, whereas 26.4 percent have high and 46.4 percent with very high scores. None has a very low score in the Index relating to this attribute. It also shows that 24.5 percent have given moderate rating in terms of Operational Efficiency of their enterprise. Sector-wise comparison also shows minimal difference. Figure 5 depicts the results. It is evident that the focus of the enterprises in improving operational efficiency have produced the desired results.
Drivers of Change
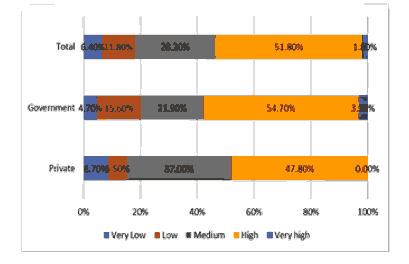
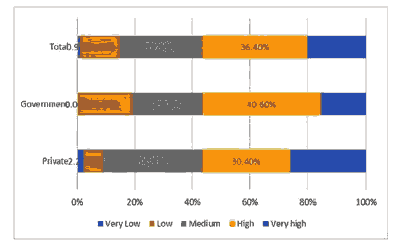
The DT drivers of change are connected with 9 attributes. It includes, Preparedness For Covid-19, Senior Leadership Changes, Automation, Business Strategy, Technology, Change in Customer Behaviours, Competition, Increasing Generational Mix and Macro Environment. The Drivers of Change Index (DoCI) is shown in Figure 7. The scores with regard to the drivers of change are high or moderate in most of the cases (81.8 percent with high score and 28.2 percent with medium score). Even though 11.8 percent of the responses have low scores and those in very low category are 6.4 percent. Similarly, only 1.8 percent of the responses have achieved very high score in terms of DoCI. Sector-wise results also show similar inferences. FA (Table 3) is used to assess the DoCI variables. KMO test value of 0.649 and significant Bartlett's Test of Sphericity score are in favour of performing FA. Here, three components are extracted. Competition, increasing generational mix, customer benefits and macro environment are the first component and hence can be termed as the major drivers of change. Automation, Business Strategy and Technology feature the second component. Two aspects viz. preparedness for COVID 19 and Senior leadership changes feature as the third component and can be considered as the least prominent drivers of change. This might be because of an unexpected entrant of the pandemic with which none of the institutions has planned or prepared. However, the DT that has already been carried out by the institutions succeeded in their functioning even in the present pandemic situation as shows in Figure 6.
| Table 3 Factor Analysis Results : DT Drivers of Change |
|||
|---|---|---|---|
| Component | |||
| 1 | 2 | 3 | |
| Prepardness For Covid 19 | 0.043 | -0.186 | 0.807 |
| Senior Leadership Changes | 0.134 | 0.189 | 0.565 |
| Automation | 0.111 | 0.797 | -0.158 |
| Business Strategy | -0.062 | 0.754 | 0.376 |
| Technology | 0.277 | 0.554 | 0.015 |
| Customer Behaviour | 0.478 | 0.286 | 0.355 |
| Competition | 0.764 | -0.084 | 0.011 |
| Increasing Generational Mix | 0.731 | 0.153 | 0.085 |
| Macro Environment | 0.673 | 0.195 | 0.098 |
| Kaiser-Meyer-Olkin Measure of Sampling Adequacy-0.649; Bartlett's Test of Sphericity: Approx. Chi-Square-130.866, Sig.-.000 | |||
Dynamic Capabilities
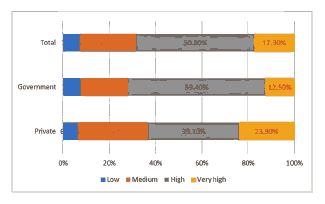
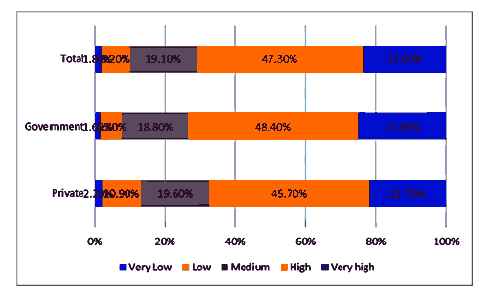
“Dynamic capabilities are disaggregated into (1) the capacity to sense and shape opportunities and threats, (2) capacity to seize opportunities, and (3) capacity to maintain competitiveness through enhancing, combining, protecting, and, when necessary, reconfiguring the business enterprise’s intangible and tangible assets” (Teece, 2007). The dynamic capabilities of UAE enterprises are evaluated by echoing the process model developed by Warner, et al., (2018), where the external factors trigger digital sensing, digital scouting and digital transformation of traditional enterprises, that refresh or replace their business model, collaborative approach, and culture. Ten indicators of dynamic capabilities are aggregated and presented in Figure 8 in the form of an index viz. Dynamic Capability Index (DCI). About 50.9 percent of the enterprises have high level of dynamic capability as per the results and those have medium dynamic capability are 24.5 percent. Sector-wise, government sector has lesser percent of responses in the very high category and more percent of responses in the high category, whereas it shows opposite direction in the case of private sector as the percent of responses in medium category are more in the private sector.
To identify the pertinent dynamic capabilities variables from a set of 10 variables, FA is performed. The KMO test result value of 0.896 and significant Bartlett's Test result indicate towards proceeding with FA. The FA result in Table 4 shows that out of the two components extracted, nine variables except chief digital officer have featured in the first component. The management support in developing digital capabilities is well portrayed in the results. Proper training has been provided and the enterprise is also keeping a track of employee and also customer satisfaction. Investment in DT helps in tackling new opportunities. Further to this the fast decision-making capability helps the organisation. All these lead to improve dexterity for the dynamic capability of the enterprises.
| Table 4 Factor Analysis Results: Dynamis Capability Variables |
||
|---|---|---|
| Component | ||
| 1 | 2 | |
| Investing in digital capabilities to target new opportunities | 0.844 | 0.004 |
| Augmenting the workforce with flexible tools to enhance their digital capabilities | 0.859 | 0.014 |
| Chief Digital Officer | -0.191 | 0.91 |
| External recruiting of digital talents from outside your organization | 0.633 | -0.256 |
| Cross functional teams to take up the digital challenges of your company | 0.829 | -0.236 |
| Fast enough in decision making | 0.794 | 0.023 |
| Higher management is supportive of building up digital capabilities | 0.888 | -0.058 |
| Organization ensures employees receive training, assistance and support to learn new technology applications ? | 0.854 | 0.265 |
| Organization has a process is in place and followed for the assessment of stake holders(eg employees and customers) satisfaction with the new digital technology applications | 0.84 | 0.239 |
| investing in training and coaching to develop the digital skills of the employees | 0.63 | 0.193 |
| Kaiser-Meyer-Olkin Measure of Sampling Adequacy-0.896; Bartlett's Test of Sphericity: Approx. Chi-Square-751.316, Sig.-.000 | ||
Agile Management
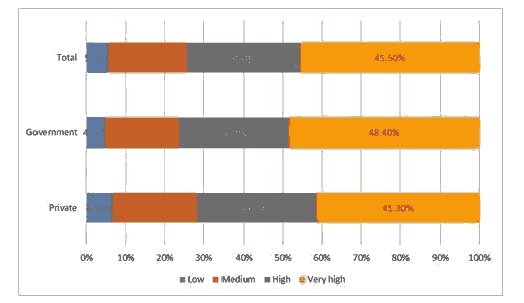
The support of higher management and fast decision-making capabilities are well identified while assessing the drivers of change variables. A further evaluation of the agility of top management is done by recording the perception of employees on 9 variables relating to the same and presented as Management Effectiveness Index (MEI) in Figure 9. The result seems to be an indicator towards better performance indicators as majority have perceived the performance at high or very high levels. The percentage of low ratings are comparatively more in the government sector with 18.8 percent than the private sector with 6.5 percent. Similarly, the percentage of responses giving very high rating are more in the private sector than the government sector. This shows a comparatively low performance of the government sector despite impressive values. The result of FA in Table 5 shows all the indicators have textured as the first component and hence could be termed as important in determining the management efficiency attribute of the enterprises.
| Table 5 Factor Analysis Results : Effectiveness of Top Management Variables |
|
|---|---|
| Component | |
| 1 | |
| Working as a team | .804 |
| Amplifying the customer voice inside the enterprise | .717 |
| Moving from a Command and Control orientation to a Coach and Communicate orientation | .847 |
| Dealing with the markets | .787 |
| Developing a cross business/product customer experience | .829 |
| Encouraging innovation | .857 |
| Communicating the company vision and the milestones | .883 |
| Promoting Collaboration among different teams | .912 |
| Promoting evidence based decision making | .835 |
| Kaiser-Meyer-Olkin Measure of Sampling Adequacy-0.902; Bartlett's Test of Sphericity: Approx. Chi-Square-846.944, Sig.-.000 | |
Competitive outlook
The competitive outlook in terms of DT is evaluated by comparing 7 aspects relating to the same and also in sector-wise in an indexed form i.e., Competitive Outlook Index (COI) and is depicted in Figure 10. Near to 75 percent of the responses have given very high or high rating to this attribute. Sector-wise comparison also shows similar results with a minor advantage to the government sector which has more responses in the very high category. None of the responses has recorded very low score in terms of competitive outlook. The results of FA in Table 6 shows that all the indicators have featured as the first factor in determining competitive outlook of the enterprise.
| Table 6 Factor Analysis Results: Competitive Outlook Variables |
|
|---|---|
| Component | |
| 1 | |
| Revenue growth | 0.657 |
| Cost of operations | 0.829 |
| Time to market for new product or service offerings | 0.811 |
| Customer experience | 0.918 |
| New business model | 0.908 |
| Employee experience | 0.827 |
| Organizational agility | 0.869 |
| Kaiser-Meyer-Olkin Measure of Sampling Adequacy-0.880; Bartlett's Test of Sphericity: Approx. Chi-Square-663.679, Sig.-.000 | |
Threats and Opportunities
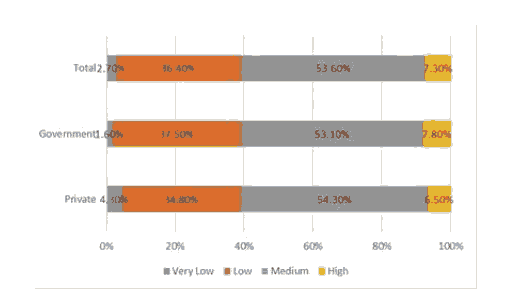
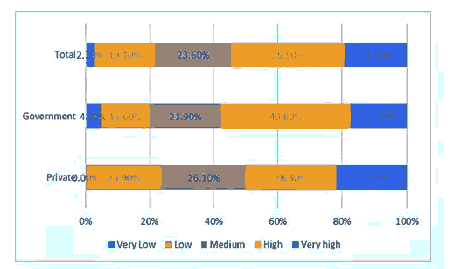
Challenges/issues or threats and opportunities of DT are evaluated with 13 variables. Threats and opportunities are compared sector-wise as separate indices. It is evident from result in Figure 12 that the DT issues have been mostly given moderate rating by 53.6 percent of the respondents. About 36.4 percent have given the issues low rating and those stating that the impact of DT issues is high in the functioning of the enterprise comes to only 7.3 percent. A sector-wise comparison of this also shows similar inferences. The major threat that has been identified seems to be the Covid-19 pandemic. The opportunities relating to the DT are compiled into an index and evaluated in Figure 11. Majority have given very high or high scores to the opportunities in place for the enterprise. However, sector-wise comparison shows reduced percent of responses in the private sector in the very high or high category compared to the public sector. Similarly, more respondents from the private sector have given low score to the opportunities compared to the private enterprises.
To identify the pertinent threats and opportunities of the enterprises connected with DT, the 13 statements together are evaluated using FA and the result is given in Table 7. The KMO test results have attained a score of 0.768 and Bartlett’s test result is also significant. Here, three components are extracted as per the FA results. Seven statements which include 3 opportunities feature as the first component. The second component has four threats and the remaining two aspects are given as the third component. Though the employees are optimistic about the opportunities of growth which are open owing to the DT in their enterprises, a reduction in revenue is a worrying factor. The respondents anticipate such a revenue dip in future also due to the Covid-19 pandemic, which has badly affected their business. However, they expect a better market value for their company owing to the adoption of DT. Apart from Covid-19, the other deterring factors is the entry of competitors. One factor which will help in digital transformation in terms of opportunities is the entry of employees with DT experience into their institution. However, the advantage becomes a threat to the organisation which is clear from the four statements featuring as the second factor. Data security and privacy issues are the two major reasons for the employee’s perception of DT as a threat to their organisation. Another threat factor is the fear of loss of job. Adoption of technology helps to improve efficacy of the workforce, which in turn helps the employer to lay-off some of their employees. The last factor indicates towards the ease of use of the digital platform among the employees and the customers. A good example to cite is, the finance and government services are using more of digital mode than the present paper works for their transactions.
| Table 7 Factor Analysis Results: Threats and Opportunities |
|||
|---|---|---|---|
| Component | |||
| 1 | 2 | 3 | |
| Facing data security and privacy issues | .051 | .701 | .206 |
| Causing data security and privacy issues to your customers | -.038 | .820 | .111 |
| Perceive digital transformation as a threat to your organization | -.009 | .852 | -.115 |
| Perceive your colleagues feel insecure about their jobs | .051 | .581 | -.123 |
| Perceive your colleagues are capable of seamlessly operating in the new digital environment | .091 | .004 | .851 |
| Perceive your customers are capable of seamlessly navigating through the new digital environment | .038 | .027 | .920 |
| Actions by traditional competitors | .812 | .126 | .045 |
| Reductions in margin/revenue (now or anticipated | .856 | .022 | .135 |
| New entrants(competitors) to your industry | .777 | .179 | -.093 |
| Opportunities for growth using digital transformation | .881 | -.102 | .163 |
| New members to the team with a digital focus | .755 | -.012 | .273 |
| Share price/market value of your company | .834 | .007 | -.073 |
| Pandemic COVID 19 | .842 | -.102 | -.075 |
| Kaiser-Meyer-Olkin Measure of Sampling Adequacy-0.768; Bartlett's Test of Sphericity: Approx. Chi-Square-798.349, Sig.-.000. | |||
Capabilities of DT in Tackling Covid-19 Pandemic
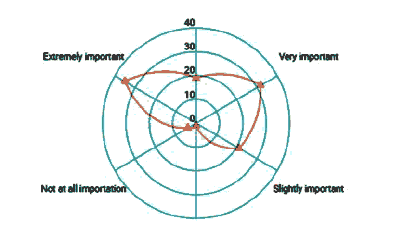
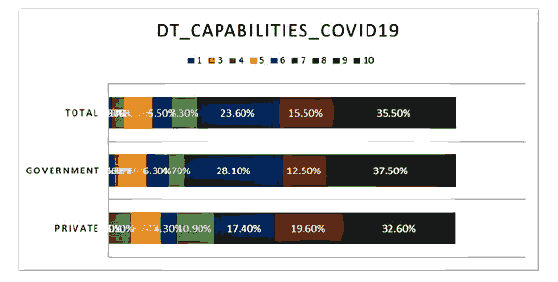
A further evaluation is done to ascertain the role of DT capabilities in countering the present situation. For analysing this rating is given on a scale of 1 to 10 with 10 being very much helped and 1 not at all assisted (Figure 13). Nearly, 75 percent have given the rating of 8 to 10 for the capabilities shown by the DT in tackling the pandemic issue, out of which 35.5 have given full marks for their DT capabilities in combating the pandemic issue. The responses with scores less than 5 are only 12.7 percent. The study supports that DT has been instrumental in assisting the enterprises in overcoming the business issues owing to the Covid-19 pandemic. Even with the difficulties and threats put forth by the Covid-19, the DT in their institution has assisted in quashing these threats to a certain extent.
Overall Outlook on DT
Compared to the rival firms the employees perceive that their enterprise has a better DT level which is evident from the results shown in Figure 14. Majority i.e., 70.9 percent feel that the level of DT attained by their organisation is impressive or at high/very high levels compared to their competitors in the field. About 20 percent have given moderate scores. A sector-wise comparison also shows similar results.
Digital Transformation Index
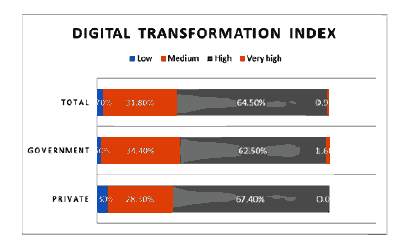
As final process for evaluation of DT a Digital Transformation Index (DTI) is constructed by compiling all the 9 sub-relating factors to the DT of the enterprises and the same is portrayed in Figure 15. This shows that 64.5 percent have high DTI scores and 31.8 percent have medium scores. Whereas those in low and very high category are less. Sector-wise also the inference is comparable. To find out which is the prominent indicator among the 8 sub-indices except threats or issues in determining the DT of the enterprise, FA is worked out. The KMO test criterion and Bartlett's Test of Sphericity criterion are fulfilled which are in favour of using FA. Of which three components are extracted as per the results. Operational efficiency, customer benefits and dynamic capabilities feature as the first component. The second component has three indices viz. managerial efficiency, competitive outlook and opportunities. Drivers of change and infrastructure feature as the third factor as shows in Table 8.
| Table 8 Determinants of DT |
|||
|---|---|---|---|
| Component | |||
| 1 | 2 | 0.782 | |
| Infrastructure | 0.004 | -0.117 | -0.072 |
| Dynamic Capabilities | 0.824 | 0.241 | 0.075 |
| Managerial efficiency | 0.310 | 0.823 | -0.035 |
| Competitive outlook | 0.364 | 0.793 | -0.073 |
| Customer benefits | 0.871 | 0.143 | 0.013 |
| Operational efficiency | 0.874 | 0.131 | 0.846 |
| Drivers of change | -0.098 | -0.020 | |
| Opportunities | -0.041 | 0.771 | -0.254 |
| Kaiser-Meyer-Olkin Measure of Sampling Adequacy-0.733; Bartlett's Test of Sphericity: Approx. Chi-Square-307.057, Sig.-.000. | |||
This shows that the results are in line with the earlier responses by the employees that the present focus of the institution is improving operational efficiency. It was identified that the customer benefit attribute relating to the DT has also attained a notable rating. Further to this, factor analysis result has also shown that the customer benefit featured as the first factor. Hence, it is augmented that DT drive with focus on improving operational efficiency is improving the customer benefits as well.
Conclusion
This study supports in building a coaching approach sustained by evidence-based decision making that served as a key success factor in structuring an innovation-oriented culture with agility in its core.. In the UAE context, this study proves that organisations are primarily driven by either streamlining operations or enhancing customer experiences, in either case, the firms are successful in passing on the benefits to the customers. Only small differences are found between private and public sector firms in terms of DT infrastructures. Drivers of Change Index encompasses senior leadership changes, automation, changing customer behaviour, macro environment, Covid-19 issue etc as majority, irrespective of private or public sectors, have obtained moderate or high rating. None of the enterprises has come to the range of low score with regard to the Dynamic Capability Index. In the case of Competitive Outlook, three-fourth of responses are in favour of very high or high rating that supports all the factors appear to be prominent in determining this aspect. Though the major threat identified by the respondents is Covid-19 pandemic, many have given very high or high scores to the opportunities factor as it generates growth to the firms. The spread of the pandemic is necessitating the need for more customer friendly digitalisation of the enterprises, to recover with strong financial performance in the new normal. In the FA analysis, among the 8 sub-indices; Operational efficiency, Customer benefits and Dynamic capabilities feature as the basic components. The overall findings of the study provide that enterprises need a DT framework and strategy to assess their current processes and strategies to smoothen effectively the success curve of business using a need based digital transformation befitting the time and environment by understanding the macro-economic dynamics of the economy.
Conflict of Interest
The authors confirm that there is no conflict of interest to declare for this publication.
References
- Barton, D.L. (1992). Core capabilities and core rigidities: A paradox in managing new product development. Strategic management journal, 13(1), 111-125.
- Bharadwaj, A., Sawy, O.A., Pavlou, P.A., & Venkatraman, N. (2013). Digital business strategy: Toward a next generation of insights. Management Information Systems Quarterly, 37, 471-482.
- Bonnet, D., Buvat, J., & Kvj, S. (2015). When digital disruption strikes: How can ?ncumbents respond. Digital Transformation Review, (7), 78-89.
- Burgelman, R.A., & Grove, A.S. (2007). Let chaos reign, then rein in chaos—repeatedly: Managing strategic dynamics for corporate longevity. Strategic management journal, 28(10), 965-979.
- Chanias, S., Myers, M.D., & Hess, T. (2019). Digital transformation strategy making in pre-digital organizations: The case of a financial services provider. The Journal of Strategic Information Systems, 28(1), 17-33.
- Engesmo, J., & Panteli, N. (2020). D?g?tal transformat?on and ?ts ?mpact on ?t structure and leadersh?p.
- Fitzgerald, M., Kruschwitz, N., Bonnet, D., & Welch, M. (2014). Embracing digital technology: A new strategic imperative. MIT Sloan Management Review, 55(2), 1.
- Grant, R.M. (2003). Strategic planning in a turbulent environment: Evidence from the oil majors. Strategic management journal, 24(6), 491-517.
- Gupta, A.K., Smith, K.G., & Shalley, C.E. (2006). The interplay between exploration and exploitation. Academy of management journal, 49(4), 693-706.
- Hartl, E., & Hess, T. (2017). The role of cultural values for digital transformation: Insights from a delphi study. AMCIS.
- Henfridsson, O., & Bygstad, B. (2013). The generative mechanisms of digital infrastructure evolution. MIS quarterly, 907-931.
- Hess, T., Matt, C., Benlian, A., & Wiesböck, F. (2016). Options for formulating a digital transformation strategy. MIS Quarterly Executive, 15(2), 123-139.
- Karimi, J., & Walter, Z. (2015). The role of dynamic capabilities in responding to digital disruption: A factor-based study of the newspaper industry. Journal of Management Information Systems, 32(1), 39–81.
- Kaufman, I., & Horton, C. (2015). Digital transformation: Leveraging digital technology with core values to achieve sustainable business goals. Eur. Financ. Rev.(December–January), 63-67.
- Legner, C., Eymann, T., Hess, T., Matt, C., Böhmann, T., Drews, P., Maedche, A., Urbach, N., & Ahlemann, F. (2017). Digitalization: Opportunity and challenge for the business and ?nformation systems engineering community. Business & Information Systems Engineering, 59, 301-308.
- Leonard?Barton, D. (1992). Core capabilities and core rigidities: A paradox in managing new product development. Strategic management journal, 13(S1), 111-125.
- Leonardi, P. (2020). You’re going digital-now what. MIT Sloan Management Review, 61(2), 28-35.
- Lavie, D., Stettner, U., & Tushman, M.L. (2010). Exploration and exploitation within and across organizations. Academy of Management annals, 4(1), 109-155.
- Lucas, H.C., & Goh, J.M. (2009). Disruptive technology: How Kodak missed the digital photography revolution. Journal of Strategic Information Systems, 18(1), 46–55.
- Lucas Jr, H., Agarwal, R., Clemons, E.K., El Sawy, O.A., & Weber, B. (2013). Impactful research on transformational information technology: An opportunity to inform new audiences. Mis Quarterly, 371-382.
- March, J.G. (1991). Exploration and exploitation in organizational learning. Organization science, 2(1), 71-87.
- Matt, C., Hess, T., & Benlian, A. (2015). Digital transformation strategies. Business & Information Systems Engineering, 57(5), 339-343.
- Majchrzak, A., Markus, M., & Wareham, J. (2016). Designing for digital transformation: Lessons for information systems research from the study of ICT and societal challenges. Management Information Systems Quarterly, 40, 267-277.
- Moeuf, A., Lamouri, S., Pellerin, R., Tamayo-Giraldo, S., Tobon-Valencia, E., & Eburdy, R. (2020). Identification of critical success factors, risks and opportunities of Industry 4.0 in SMEs. International Journal of Production Research, 58(5), 1384-1400.
- Porter, M.E., & Heppelmann, J.E. (2015). How smart, connected products are transforming companies. Harvard business review, 93(10), 96-114.
- Piccinini, E., Hanelt, A., Gregory, R.W., & Kolbe, L.M. (2015). Transforming industrial business: The impact of digital transformation on automotive organizations. In 2015 International Conference on Information Systems: Exploring the Information Frontier, ICIS 2015. Association for Information Systems.
- Raisch, S., & Birkinshaw, J. (2008). Organizational ambidexterity: Antecedents, outcomes, and moderators. Journal of Management, 34(3), 375–409.
- Rothaermel, F.T., & Hess, A.M. (2007). Building dynamic capabilities: Innovation driven by individual-, firm-, and network-level effects. Organization science, 18(6), 898-921.
- Ross, J.W., Beath, C.M., & Sebastian, I.M. (2017). How to develop a great digital strategy. MIT Sloan Management Review, 58(2), 7.
- Schwab, K. (2015). The Fourth Industrial Revolution.
- Sebastian, I.M., Moloney, K.G., Ross, J.W., Fonstad, N.O., Beath, C., & Mocker, M. (2017). How big old companies navigate digital transformation. MIS Quarterly Executive, 16(3), 197–213.
- Selander, L., & Jarvenpaa, S.L. (2016). Digital action repertoires and transforming a social movement organization. mis Quarterly, 40(2), 331-352.
- Svahn, F., Mathiassen, L. & Lindgren, R., (2017). Embracing digital innovation in incumbent firms: How Volvo cars managed competing concerns. MIS Q, 41(1), 239–254.
- Skog, D.A., Wimelius, H., & Sandberg, J. (2018). Digital disruption. Business & Information Systems Engineering, 60(5), 431-437.
- Teece, D.J. (2007). Explicating dynamic capabilities: The nature and microfoundations of (sustainable) enterprise performance. Strategic management journal, 28(13), 1319-1350.
- Teece, D.J., Paul, G.R., & David R.C. (2020), “Plotting strategy in a dynamic world”, reboot your strategy, m?t sloan management review, Special Collection, Fall 2020, 1-6.
- Tihinen, M., Kääriäinen, J., Ailisto, H., Komi, M., Parviainen, P., Tanner, H., ... & Valtanen, K. (2016). The ?ndustrial ?nternet in Finland: On route to success?.
- Warner, K.S., & Wäger, M. (2019). Building dynamic capabilities for digital transformation: An ongoing process of strategic renewal. Long Range Planning, 52(3), 326-349.
- Westerman, G., Calméjane, C., Bonnet, D., Ferraris, P., & McAfee, A. (2011). Digital transformation: A roadmap for billion-dollar organizations. MIT Center for Digital Business and Capgemini Consulting, 1, 1-68.
