Research Article: 2021 Vol: 27 Issue: 2S
Developing a Conceptual Model of Implementation of Business Functions Integration in the Internal Business Process Performance
Erwin Yulianto, Langlangbuana University
Iman Sudirman, Pasundan University
Sutarman, Pasundan University
Awan Setiawan, Langlangbuana University
Ruhanda, Langlangbuana University
Keywords
Market Based View, Resource Based View, Corporate Culture, Integration of Business Functions, Internal Business Process Performance
Abstract
The research used in assessing the performance of internal business processes in this study uses strategic management theory and operations management through the Resource-Based View approach, Market-Based View aspects and Organization Culture. The Banking Industry has to think about the business processes and workflows to empower employees and what they need to do to stay competitive in the face of rapidly changing competition. The method used in this research is a Literature Review with a descriptive approach that will produce a conceptual model. The resulting conceptual model development was adopted from DeLone and McLean's Model about the success of the Information System which was combined with the input variables studied to produce an implementation model for the integration of business functions to improve the performance of internal business processes.
Introduction
The rapid development of systems, information and communication technology causes the world to appear bordered less so that information that occurs can be known very quickly. In the era of the Third Millennium and the Industrial Revolution 4.0., which is often referred to as the era of globalization, led to changes in banking such as modernization, privatization, internalization, guarantee of fund safety, customer experience (user experience) and Capital Adequacy Ratio? (Syaifuddin, 2009b).
Banking in General
The intense competition in businesses in the banking industry causes each bank to be more careful in determining business strategies in the business activities and services of the bank it manages. Bank business activities are businesses that must be managed very carefully because of the enormous responsibility in carrying out the mandate of customers (Diredja, 2012). Cuesta and Oreo argued that when banks experience increased competitive pressure, they must adopt a new strategy to survive, and one way that can be done is to reduce operational costs through increased productivity. Banks must formulate a strategy to carry out daily banking operations effectively and efficiently, so as to improve their performance, which in turn will contribute to stakeholders.
Banking institutions need sustainable excellence in cost leadership and/or differentiation. The competitive advantage of a company is related to the ability of an organization to formulate strategies that place it in a favorable position compared to other companies in the industry (Bernadin, 2003). That competitive advantages include organizational efficiency, cost advantage, innovation and product/service quality that will lead to superior performance (Ma, 2000).
Various efforts to improve banking performance were carried out in various ways. One of them is through the transformation of the banking system in an effort to increase vitalization, technological openness and financial innovation (Detragiache, 2006). Abrahim explain about market concentration and banking efficiency to determine the performance of commercial banks in Malaysia. Implementing compliance aspects creates a lot of internal strength and external opportunities to facilitate bank performance (Ullah, 2018). Bank performance measurement is not only based on financial performance. The factors of managementcost (operating cost efficiency), leverage and liquidity can be important forces that support the bank's financial performance. (Kalisman, 2019). Bach revealed that the continuous development of systems, information and communication technology has profound implications for the integration of business functions such as sales and marketing, procurement, finance and accounting, research and development. The implementation of effective risk management as an inseparable part of organizational processes is an important element in realizing good corporate governance because of the role of risk management in providing reasonable assurance for the achievement of the objectives of the success of activities. The implementation of good risk management requires good corporate governance principles including transparency, accountability, responsibility, independence and fairness (Faisal, 2012; Suwanda, 2019).
National Banking
Research on performance in the banking industry, especially in the fields of strategic management and operations management, has been widely studied before (Al-Hawari, 2006; Mehra & Coleman, 2016; Ting & Lean, 2009; Ullah & Khanam, 2018). This is in line with the empirical phenomenon that occurs in the fluctuating and unstable performance of national banking. Based on data taken from Table 1, we can see that in the 2013-2019 periods, it can be seen that the National Banking, Regional Development Banks, Joint Venture Banks and Foreign Banks have fluctuating performance (OJK, 2020).
| Table 1 National Banking Performance Trends for The Category of National Banks, Regional Development Banks, Joint Ventures & Foreign Banks for The 2013-2019 Period |
|||||||||||||||||
|---|---|---|---|---|---|---|---|---|---|---|---|---|---|---|---|---|---|
| Bank name | BCA | Bank Mandiri | BRI | BNI | BIN | Bank bjb | Bank DKI | Bank Jateng | Bank Jatim | Bank CIMB Niaga | Bank CIMB NISP | Bill Maybank | Bank Woori Saudara | City bank | Standard Chartered | Bank HSBC | |
| Year | Component/Ratio | ||||||||||||||||
| 2013 | Profit | 14,364 | 16,994 | 21,160 | 8,800 | s | 1,385 | 803 | 717 | 917 | 4,282 | 1,143 | 1296 | 124 | 1999 | 61 | 250 |
| Equity | 62,666 | 86,867 | 80,868 | 47,481 | 11564 | 6,669 | 3589 | 2,721 | 5,811 | 28,755 | 14,373 | 14,750 | 738 | 8,020 | 1,011 | 2,919 | |
| Liability | 4,25,843 | 5,60,285 | 5,25,502 | 323564 | 1,19,673 | 60,371 | 27,508 | 28,187 | 27,411 | 1,84,819 | 83,152 | 1,20,338 | 7,458 | 56,791 | 61,818 | 25,853 | |
| Asset | 4,88,508 | 6,47,152 | 6,06,370 | 3,71,046 | 1,31,237 | 67,040 | 31,097 | 30,908 | 33,222 | 2,13,574 | 97,525 | 1,35,088 | 8,196 | 64,811 | 62,830 | 28,772 | |
| ROA | 3% | 2.63% | 3.49% | 2% | 1.20% | 2% | 3% | 2% | 2.76% | 2.01% | 1.17% | 4% | 2% | 3.08% | 0.11% | 3% | |
| ROE | 22% | 20% | 26% | 19% | 13.57% | 20.77% | 77% | 26% | 15.78% | 14.89% | 7% | 8.79% | 16.77% | 24% | 61% | 9% | |
| 2014 | Profit | 16,027 | 18,679 | 24,197 | 10516 | 11,115 | 1.115 | 1158 | 774 | 885 | 2,347 | 1,332 | 477 | 10 | 2.504 | 663 | 66 |
| Liability | 4,65,890 | 6,55,523 | 6,80,808 | 3,37,155 | 132592 | 63,138 | 37318 | 32,696 | 36,508 | 1,95,622 | 87,339 | 117286 | 8,475 | 55375 | 63,277 | 26,715 | |
| Asset | 5,41,911 | 7,55,867 | 7,78,018 | 3,93,467 | 1,44,782 | 70,157 | 37,168 | 35,743 | 42,804 | 2,27,080 | 1,03,123 | 335544 | 9,244 | 6,44,149 | 64,500 | 23,739 | |
| ROA | 2.96% | 2.47% | 3.11% | 2.67% | 0.76% | 3% | 2% | 2.17% | 2% | 1.00% | 1% | 0.35% | 1.10% | 3.89% | 1.03% | 22% | |
| ROE | 21.08% | 18.62% | 24.89% | 18.67% | 9.07% | 35.89% | 13.61% | 25.42% | 14.05% | 1.46% | 8.44% | 2.61% | 135% | 27.45% | 54% | 2.1.7% | |
| 2015 | Profit | 17522 | 20,006 | 25,021 | Ws | 1,814 | 1,385 | 228 | 867 | 958 | 428 | 1,501 | 783 | 283 | 1,515 - | 420 | 42 |
| Equity | 86,770 | 1,11,412 | 112218 | 73,450 | 13,749 | 7,699 | 6,079 | 3,727 | 6,063 | 78698 | 16,411 | 14,468 | 4,370 | 8,751 | 679 | 4,370 | |
| Liability | 4,95,771 | 6,96,375 | 7,37,195 | 405266 | 1,58,110 | 75,332 | 33,203 | 37,516 | 31,919 | 2,04,878 | 1,04,069 | 1,34,438 | 15,682 | 64,869 | 63,494 | 25,931 | |
| Asset | 5,82,540 | 8,07,787 | 8,49,413 | 4,78,716 | 1,71,859 | 83,031 | 39,282 | 41,243 | 38,041 | 233576 | 1,20,480 | 1,48,905 | 20,053 | 73,620 | 64,173 | 30,302 | |
| ROA | 3.01% | 1% | 3% | 2% | 1.06% | 2% | 1.54% | 2% | 3% | 0.18% | 1% | 0.53% | 1.41% | 2.06% | -1% | 0% | |
| ROE | 20.19% | 17.96% | 22% | 11.75% | 13.19% | 18.00% | 3.75% | 23.28% | 15.80% | 1.50% | 9.15% | 5.41% | 6.48% | 17.32% | -61.81% | 0.55% | |
| 2016 | Profit | 19,834 | 13,017 | 25,753 | 10,776 | 2,480 | 1,647 | 657 | 992 | 1,028 | 1.899 | 1,790 | 1,661 | 309 | 224 | 269 | 165 |
| Equity | 1,09,069 | 1,44,183 | 1,45,458 | 83549 | 18,969 | 10,053 | 7,461 | 6,123 | 7,210 | 33,630 | 19507 | 17,729 | 4,631 | 9,449 | 710 | 5529 | |
| Liability | 5,53,552 | 7,74,025 | 818543 | 481296 | 1.95,033 | 86,960 | 33,876 | 45,373 | 35,823 | 7,02,923 | 1,18,690 | 1,37,497 | 18,709 | 62261 | 64,037 | 21,023 | |
| Asset | 6,62,620 | 9,18,208 | 9,64,001 | 5,64,845 | 2,14,002.00 | 97,013 | 43,338 | 51,496 | 43,033 | 236553 | 1,38,196 | 1,55,226 | 23,341 | 71,710 | 64,748 | 76,558 | |
| ROA | 2.99% | 1.42% | 3% | 2% | 1.16% | 2% | 2% | 1.93% | 2% | 0.80% | 1.30% | 1.07% | 1% | 3.12% | 0.41% | 0.62% | |
| ROE | 18.19% | 9.11[3% | 113116 | 1290% | 13.08% | 16.30% | 8.81% | 1621% | 1426% | 5.65% | 9.18% | 9.37% | 6.68% | 23.65% | 37.80% | 2.99% | |
| 2017 | Profit | 7,706 | 20,011 | 28,469 | 13,046 | 3,022 | 1,601 | 719 | 1,159 | - | 2,176 | 1,413 | 451 | 2513 - | 104 | 1,432 | |
| Inuit, | 1,26,685 | 1,59,621 | 1,65,047 | 94,017 | 21,662 | 10,738 | 8,273 | - | 7,816 | - | 21,784 | 18,851 | 6,351 | 9,859 | 596 | 14,932 | |
| Liability | 6,08,099 | 8,18,707 | 9,11,391 | 5,67,641 | 2,39,848 | 97,780 | 43,663 | - | 43,703 | - | 131.99 | 1,41,701 | 20548 | 65,171 | 62,632 | 85,894 | |
| Asset | 7,34,784 | 9,78,328 | 10,76,438 | 6,61,658 | 2,61,510 | 108518 | 51,936 | - | 51519 | - | 1,53,774 | 160552 | 26,898 | 75,031 | 63228 | 1E10,826 | |
| ROA | 3.02% | 205% | 164% | 197% | 116% | 148% | 138% | 0.00% | 7.75% | 0.00% | 1.41% | 37% | 1.68% | 3.35% | -16% | L42% | |
| ROE | 17.53% | 13% | 17.25% | 14% | 13% | 14.37% | 9% | 10% | 14.24% | 0% | 9% | 1.22% | 7% | 25.49% | 17.40% | 9.59% | |
| 2018 | Profit | 24,761 | 24,079 | 31,702 | 14,462 | 3,206 | 1,575 | 800 | 1,310 | 1,260 | 3,306 | 2,638 | 1,769 | 535 | 1,986 | 522 | 872 |
| Equity | 1,45,979 | 1,73,111 | 1,81,019 | 103589 | 24,207 | 12,699 | 8,589 | 6,696 | 8,472 | 38,954 | 24,428 | 22592 | 6,743 | 9,237 | 874 | 15,634 | |
| Liability | 6,62,657 | 8,63,967 | 30,53,181 | 6,50,986 | 2,84,266 | 1,01,923 | 44,440 | 59,927 | 54,217 | 2,26,110 | 1,49,155 | 1,41,768 | 23,039 | 73,427 | 67,491 | 93,099 | |
| Asset | 8,08,636 | 10,37,078 | 1234200 | 7,54,575 | 3,08,473 | 1,14,622 | 53,028 | 66,623 | 62,689 | 2,65,064 | 1,73,583 | 1,63,861 | 29,783 | 82,659 | 63,365 | 1,08,733 | |
| ROA | 3.06% | 232% | 151% | 197% | 3104% | 137% | 151% | 197% | 7_01% | 1.25% | 152% | LOB% | 1.79% | 7_40% | 0.82% | 20% | |
| ROE | 16% | 14% | 18% | 13.96% | 33% | 12% | 9.32% | 20% | 14.88% | 8.49% | 10.80% | 8% | 7.33% | 21.51% | 59.74% | 6% | |
| 2019 | Profit | 27,351 | 25,450 | 34,029 | 14,613 | 2119 | 1,518 | 817 | 1,043 | 1,377 | 3,480 | 2,939 | - | 509 | 3,014 | 280 | 2289 |
| Equity | 1,67,034 | 1,94,461 | 2,03,665 | 1,16,898 | 73,506 | 13,723 | 9,32.2 | 7,960 | 9,186 | 42,480 | 27,665 | - | 6,946 | 10,817 | 1,330 | 18,114 | |
| liability | 7,31,976 | 9,34,263 | 11,39,412 | 6,63,339 | 2,90,652 | 1,03,272 | 46,322 | 63,868 | 67,530 | 2,29,693 | 3,53,145 | - | 30,160 | 67,768 | 59,883 | 93,322 | |
| Asset | 8,99,010 | 13,28,724 | 13,43,078 | 7,80,237 | 3,14,158 | 1,16,995 | 55,643 | 71,828 | 76,735 | 2,72,173 | 1,80,809 | - | 37,106 | 78584 | 61,71.3 | 1,11,436 | |
| ROA | 3.04% | 7.75% | 2.53% | 3.81% | 0.07% | 1% | 3.47% | 1.45% | 2% | 1% | 1.63% | 0.00% | 1% | 3.84% | 0.46% | 2% | |
| ROE | 16.37% | 13.09% | 17% | 13% | 1% | 11.06% | 8.76% | 13.11% | 14.99% | 8.19% | 11% | 0.00% | 7% | 27.87% | 21.06% | 12.63% | |
An important indicator that affects the inconsistency of performance is the implementation of Good Corporate Governance to direct and control the company in order to achieve a balance between the strength and authority of the company (Hedwigis, 2016). Research on issues of implementing Good Corporate Governance in banking institutions has been widely conducted (Buallay, Hamdan & Zuregiat, 2017; Rossi & Panggabean, 2012; Setiawaty, 2016; Tjondro & Wilopo, 2011). The trend in the average value of GCG implementation based on domestic BUKU 1, 2, 3 and 4 can be seen in Table 2 below (Indonesia, 2018).
| Table 2 Trend of Average Gcg Implementation in Domestic Banking |
|||||||||||
|---|---|---|---|---|---|---|---|---|---|---|---|
| BUKU | 2007 | 2008 | 2009 | 2010 | 2011 | 2012 | 2013 | 2014 | 2015 | 2016 | 2017 |
| I | 2.21 | 2.18 | 2.32 | 2.18 | 2.21 | 2.21 | 2.14 | 2.32 | 2.39 | 2.14 | 2.23 |
| II | 2.19 | 2.08 | 2 | 1.9 | 2.09 | 2.13 | 2.08 | 2.1 | 2.21 | 2.21 | 2.1 |
| III | 1.79 | 1.79 | 1.79 | 1.68 | 1.74 | 1.74 | 2.05 | 1.95 | 1.95 | 2.05 | 1.85 |
| IV | 1.2 | 1.2 | 1 | 1 | 1 | 1.2 | 1.2 | 1.4 | 1.4 | 1.6 | 1.25 |
| Banking Industry | 2.07 | 2.01 | 2 | 1.89 | 2.01 | 2.03 | 2.05 | 2.1 | 2.17 | 2.13 | 2.05 |
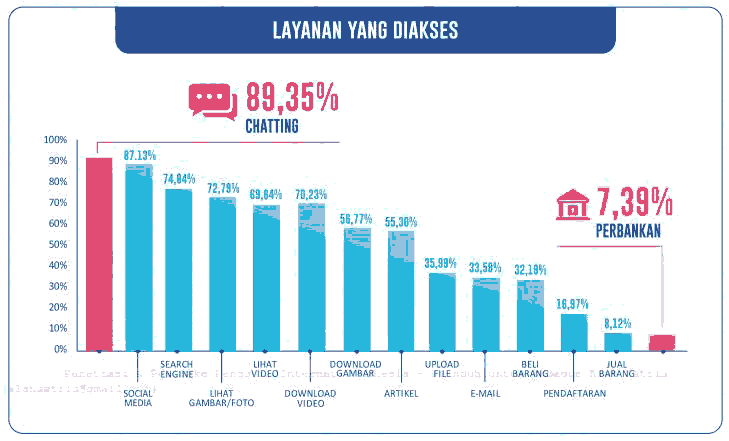
According to a research report published by the Indonesian Internet Service Providers Association (APJII) in 2019, there has been a significant growth in the last 10 years, from 25 million users in 2008 to over 171.17 million users or 64.8% from 264.16 million people in Indonesia in 2018. In Figure 1, it can be seen that the development of internet users in Indonesia continues to increase every year. However, the use of the internet to access services in the economic sector, particularly banking, is still relatively low, only at 7.39%. The low level of internet use to access banking services is basically related to the low level of Indonesian people's access to formal financial institutions, which only reaches 49% of the total population (Demirgüç-Kunt & Klapper, 2013). The low level of access is due to low income levels, complicated bank operations, a lack of financial and banking education, high bank administration costs and the location of the bank from where they live.
The low use of the internet in banking services, among others, is caused by : (Mulyana, 2020)
a. Low public trust in business processes and banking services.
b. Public awareness is still lacking with digital-based banking products such as e-banking (internet banking, mobile banking, SMS banking, etc.).
c. There are other non-banking products that offer financial services such as OVO, GoPay, Link Aja and others. This makes people choose these facilities compared to banking facilities because Fintech companies have advantages, including fast processing, easy requirements and fast service.
Research Proposition
Research propositions raised in modeling include:
a. Identify the system integration business functions.
b. The dominant variables involved in the system integration of business functions.
c. Development of a conceptual model for the implementation of an effective integration system for business functions so as to improve the performance of internal business processes in the banking industry
Literature Review
Resource-Based View & Market Based View
The research used in assessing the performance of internal business processes uses strategic management theory and operations management through the Resource-Based View (Barney, 1991) approach which is in line with several other studies that emphasize Information Technology Capacity (Bipat, 2018; Helena, 2019; Pebrianto, 2013), Intellectual Capital (Engelman, 2017; Ramos-Rodríguez, 2004) and Marketing Capability (Guenzi, 2006; Najavi, 2016). Furthermore, from the aspect of Market Based View (Porter, 1985), several studies emphasize the importance of social environmental factors (Čepel, 2019; Turnipseed, 1994) which affect Value Creation (Edvardsson, 2013; Killa, 2017; Stoeckli, 2018) and Innovation (Lilly, 2014; Rajnoha, 2015).
Organization Culture
Research related to the company's internal business processes also found another determinant variable, namely organizational culture. Other research states that there are internal and external environmental influences on organizational culture. Defines some of the benefits of organizational culture which in turn will help companies perform positively in competencies such as increasing the spirit of togetherness, openness, quality of work and life balance and harmonization (Bennett, 2004; Cameron & Quinn, 2006; Mardiana, 2019). Several other studies also have implications that culture can affect Enterprise Resource Planning as a medium for integration of business functions (Al-Gahtani, 2007; Bandyopadhyay, 2007; Il, Hong & Kang, 2011).
Business Function Integration as Internal Business Prosess Performance
Organizations must think about business processes and workflows to empower employees and what they need to do to stay competitive in the rapidly changing world of banking. The management always involves coordination and supervision activities of other people's work, so that work can be completed effectively and efficiently (Robbin, Stephen P., Coulter, 2016). The results of the research are expected to be more on the bottom up strategy, namely operational/functional strategy and business strategy which focuses on evaluating the implementation of internal business processes for bank business activities in accordance with internal and external regulations that apply to business processes that occur in the field (Wheelen & Hunger, 2018).
Methodology
The research method used is the Literature Review method. The Literature Review method is a research conducted by researchers by collecting a number of books, journals, papers and magazines related to research problems and objectives. This technique is carried out in order to reveal various theories that are relevant to the problem being faced/studied as reference material in the discussion of research results. The research process using a literature review can be seen in Figure 2 below:
Results and Discussion
The Impact of Increasing Internal Business Process Performance from the External Environment Side
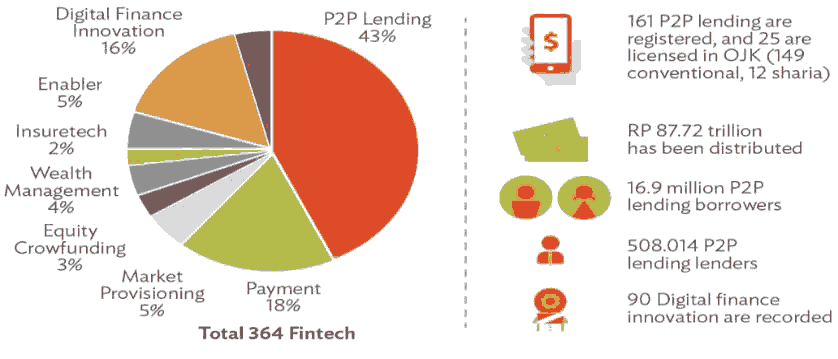
One of the competitors in the banking industry market is Financial Technology (Fintech), an application-based financial service that has mushroomed in developed countries including Indonesia. The banking industry needs Fintech, especially in terms of the ability to master emerging technologies that are more superior and current such as legacy software/systems, data integration, product improvement, user experience, business development and innovation and technology, while Fintech requires experiences from the banking industry in terms of mastery. Various types of financial services, risk management, and alignment of rules such as leadership experience, regulatory systems, maintaining reputation, customer base, risk management experience, and deep financial pockets. As of April 2020, the number of Fintechs in Indonesia has reached 364 with the product categories and market share that have been controlled can be seen in Figure 3 below.
Online-based banking services coupled with Fintech services that continue to develop rapidly at an astonishing growth rate are empirical phenomena that can become opportunities or threats depending on how the strategic management and operation management of the banking industry is implemented in Indonesia. Fortunately, there is a point of similarity between the banking industry and Fintech which mutually reinforces the two, namely the trend of E-Commerce which is mushrooming so that it can become a market share and a great opportunity from online trading. (Mahayana, 2016).
Emerging research on Industry 4.0 focuses on technological developments so as to influence value creation to provide new services and product-service systems (Müller, 2018). Innovation is widely seen as an important component of competitiveness, embedded in the organizational structure, processes, products and services of a company (Gunday et al., 2011). Innovations supported by card payment services, cell phones and location-based services have enabled entrepreneurs to challenge long-standing banking models and infrastructure (Gozman, Liebenau & Mangan, 2018). To strengthen their innovation potential, companies need to increase investment aimed at value creation and innovation, so that companies can build new products, services or procedures (Grimsdottir & Edvardsson, 2018).
Value creation can be seen from three perspectives, namely the customer, seller, and customer-seller perspectives. Value creation from a customer perspective is related to how customers perceive the value of the offer compared to the available alternatives. From a salesperson's perspective, the introduction of customer needs is a key asset for attracting, developing and retaining customers. Furthermore, from a buyer-seller perspective, value is created through networking and partnerships (Hammervoll, 2012; Killa, 2017). Technologies that can enable new business platforms and increase digital access to potential customers have changed significantly in the way companies do business from value creation (Chesbrough, 2006; Hoyer et al., 2010). The competitive advantage of product innovation has become difficult to sustain for a long time. As a result, companies are increasingly looking for ways to renew and innovate their existing business models (Neus, Buder & Galdino, 2017).
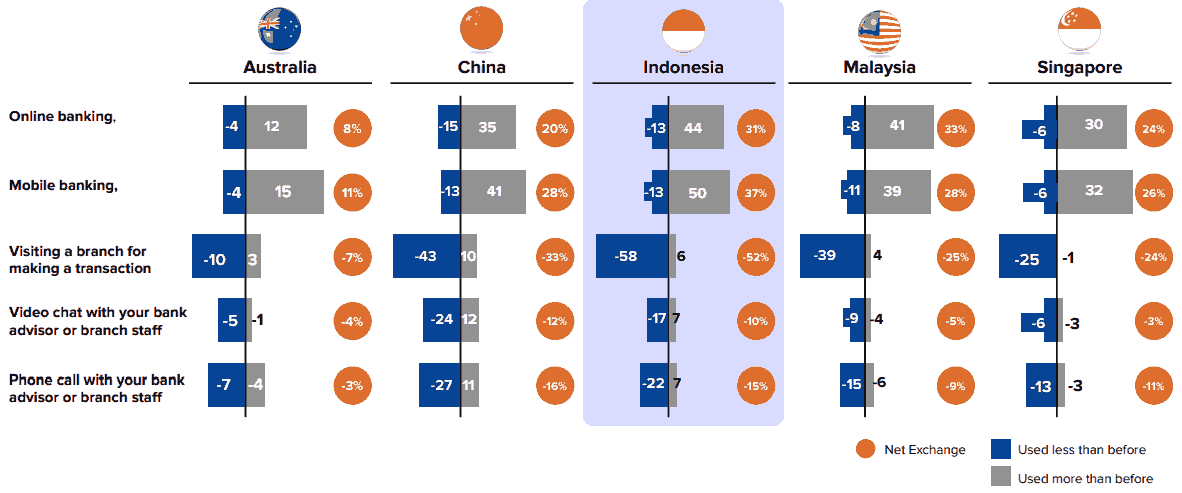
The concept of "Business As Usual" is gone. At this time, the concept of "Remote Everything" is the best solution in the Covid-19 Pandemic era. The Covid-19 pandemic has also caused social and physical distancing so that directly the use of banking services by the public is also transformed. Research conducted by McKinsey (2020) related to the use of digital-based banking services in the period April - June 2020 in a number of countries has increased by more than 30% as shown in Figure 4 below (Utoyo, 2020).
Impact of Internal Business Process Performance Improvement from the Internal Environment Side
Based on Bank Indonesia data as shown in Table 3 below, the average annual growth in volume of non-cash transactions for the 2014-2018 periods was dominated by Electronic Money of 94.7% with the highest growth YoY of 207.43% in 2017-2018, very far. When compared with the growth of debit cards of 18.6% and credit cards of 7.1%.
| Table 3 Ratio of Volume Growth to Total Electronic Money Transactions Compared to Other Non-Cash Transactions |
|||||||
|---|---|---|---|---|---|---|---|
| No | Category | 2014 | 2015 | 2016 | 2017 | 2018 | Growth Avarage |
| 1 | Electronic Money | 203,4 | 535,6 | 683,1 | 943,3 | 2.9 | 94,7% |
| 2 | Debit Card | 292,1 | 348,7 | 424,3 | 501,2 | 577,3 | 18,6% |
| 3 | Credit Card | 250,5 | 274,7 | 297,7 | 319,3 | 330,1 | 7,1% |
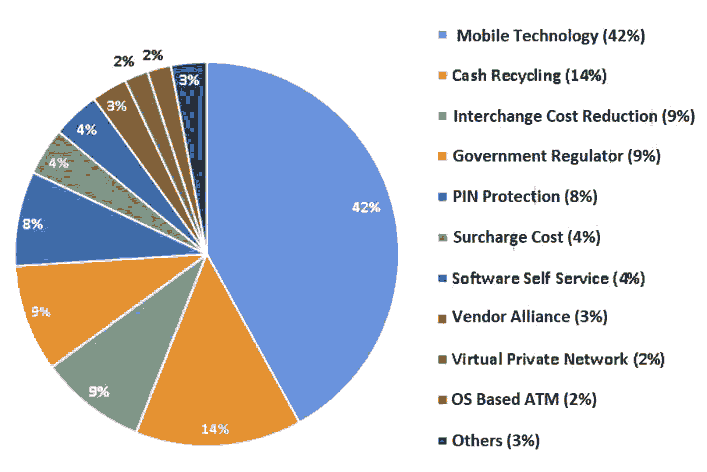
Server-based e-money service features extend to the use of Quick Response Code (QR Code). Users only need to scan this code via their smartphone when making transactions. Viewed from the E-Channel side, referring to research conducted byMahayana (2016), the supporting factors for Fintech are starting to pulsate. At least, SMS Banking and Mobile Banking users are increasing. Data from the four main banks in Indonesia shows a growth of around 51% while Internet Banking users have also grown at a growth rate of around 36%. Another study resulted in research stating that 42% of the global ATM trend in the future will lead to Mobile Technology as shown in Figure 5 below (Fryrear & Harper, 2012).
In the future, technology trends will have a significant effect on people's habits of transactions. Since 2018, mobile banking transactions have exceeded transactions using ATMs. Institute for Development Economy and Finance (INDEF) summarizes digital transaction data for the 2010 - 2018 periods as shown in Table 4 below.
| Table 4 Digital Banking Transaction Trends Based on Frequency, 2010-2018 |
||||||||||
|---|---|---|---|---|---|---|---|---|---|---|
| NO | Category | 2010 | 2011 | 2012 | 2013 | 2014 | 2015 | 2016 | 2017 | 2018 |
| 1 | ATM Transaction/Debit Card | 62% | 58% | 56% | 56% | 50% | 44% | 39% | 38% | 37% |
| 2 | Transaction on Branch Office | 17% | 13% | 12% | 11% | 10% | 8% | 6% | 5% | 4% |
| 3 | Internet Banking | 11% | 18% | 21% | 19% | 20% | 18% | 19% | 16% | 18% |
| 4 | Mobile Banking | 6% | 7% | 8% | 9% | 15% | 26% | 32% | 36% | 41% |
| 5 | Electronic Data Capture (EDC) | 3% | 3% | 4% | 5% | 5% | 5% | 4% | 5% | 5% |
On the other hand, the company's response in absorbing knowledge varies because company resources are different and unique (Engelman, Fracasso & Schmidt, 2017). Intellectual Capital is related to the capacity of a company to create and apply its knowledge base, basically consisting of three characteristics, including intangibility, its potential to create value and the effect of growing corporate practices and synergies. Intellectual Capital plays an important role in the high-tech and knowledge-based sector of the economy (Dean, Kretschmer & Kretschmer, 2014).
Digital banking can provide a boost to the bottomline of the banking industry. When transactions are made on the mobile application, instead of at a branch office, costs can be much cheaper. The banking industry can also generate more databases and income (fee based) from customers who manage their money using smartphones, tablets, and/or Personal Computers (PCs). (Evoy & Scott, 2017).
Impact of Internal Business Process Performance Improvement from the Corporate Culture Side
Research related to the company's competitive strategy in internal business processes also found another determinant variable, namely organizational culture. The rate and speed of change in the external environment results in companies having to change organizational culture. (Cameron & Quinn, 2006). Several benefits of organizational culture which in turn will help companies perform positively in competencies such as increasing the spirit of togetherness, openness, quality of work and life balance and harmony (Bennett, 2004).
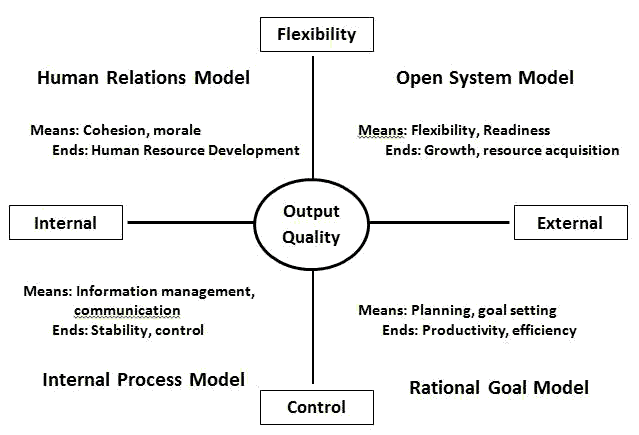
The success of managing company resources in integrating business functions within an organization is influenced by the dimensions of organizational culture consisting of learning and development, participation in decision-making, power sharing, comprehensive cross-functional communication, and tolerance for risk and conflict. In a study to investigate the correlation between organizational culture and organizational ability to change through business process engineering, corporate culture provides an atmosphere conducive to change (Rashid & Sambasivan, 2004). The Competing Values Framework is an organizational culture instrument based on the concept of organizational effectiveness (Quinn, 1983).
Competing Values Framework is an organizational instrument that defines organizational characteristics based on three dimensions. The first dimension is to define organizational characteristics based on the focus of the organization both at the level of micro (internal) welfare and at the macro (external) level. The vertical axis shows the organizational structure, whether towards Flexibility or towards Stability (Control). The third aspect is to define organizational culture based on "process" and "results". Competing values (internal vs external, flexibility vs stability, process vs outcome) are at the heart of the Competing Values Framework. These three dimensions develop four types of organizational models, namely the Human Resource Model, the Open System Model, the Rational Objective Model and the Internal Process Model as shown in Figure 6.
The organizational culture approach to organizational performance is a cultural framework of Competing Value or competitive cultural values consisting of organizational focus (internal versus external), structure (stability and control versus change and flexibility), as well as processes and outcomes (way versus outcome) (Suparman, 2018). In an effort to gain competitive advantage, the banking industry needs good and superior management to develop and increase employee productivity which in turn will improve company performance. Competing values framework maps the values in the corporate culture that affect organizational effectiveness by considering the organizational life cycle (Hayati, 2019).
The Impact of Increasing Internal Business Process Performance from the Integration of Business Functions
In general, the banking industry around the world, including in Indonesia, will shift towards a more digital, more personal and less physical direction. Structural changes that have taken place in the Indonesian banking sector have increased competition between banks, so that banks in their operations are faced with optimal operational efficiency, so that high market share can be achieved and minimize risk and obtain satisfactory financial performance (Syaifuddin, 2009). Changes are The Impact of Increasing Internal Business Process Performance from the Integration of Business Functions
In general, the banking industry around the world, including in Indonesia, will shift towards a more digital, more personal and less physical direction. Structural changes that have taken place in the Indonesian banking sector have increased competition between banks, so that banks in their operations are faced with optimal operational efficiency, so that high market share can be achieved and minimize risk and obtain satisfactory financial performance (Syaifuddin, 2009). Changes are needed so that the banking industry can survive the perfect storm, both in terms of business models, customer behavior, culture and human resources (Jasmin, 2020).
Organizations must think about business processes and workflows to empower employees and what they need to do to stay competitive in the rapidly changing world of banking. The management always involves coordination and supervision activities of other people's work, so that work can be completed effectively and efficiently. The research results are expected to focus more on the bottom up strategy, namely operational/functional strategy and business strategy that focuses on evaluating the implementation of internal business processes for bank business activities in accordance with internal and external regulations that apply to business processes that occur in the field (Robbin, Stephen & Coulter, 2016).
The performance banking business is determined by corporate strategy match, external/industry environment, financial capability, operational capability, marketing capability, human resource capability, information technology capability and innovation capability (Brexendorf, 2015; Kusumawati, 2014; Lin & Wu, 2016; Real, 2014; Rothaermel, 2013; Sakas, 2014; Saragih, 2017). Banking business performance on the other hand is also determined by the bank's ability to dynamically manage internal resources/capabilities in relation to external conditions, namely the extent to which the company is able to carry out operational and financial efficiency (Dess, 2016).
Developing a Conceptual Model of Implementation of Business Functions Integration in the Internal Business Process Performance
Today the attention of organizations is not only on the main function, but also on the entire set of business processes in the organization. This series of processes is known as the integration of business functions. Through the concept of integration of business business functions, efficiency in the organization is expected to be carried out in every function of the work unit and facilitate the direction and measurement of organizational performance (Andriani, 2018; McCormack & Johnson, 2001).
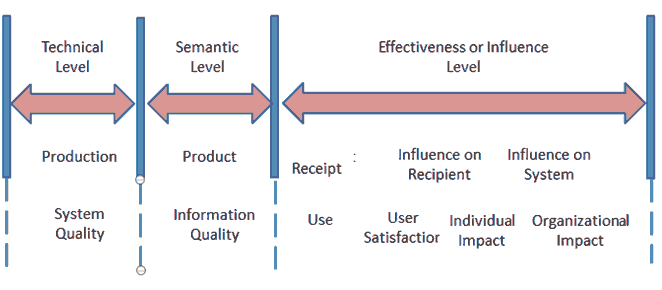
The integration that a teringrasi information system must have consists of business functions such as operations, marketing (marketing), finance and human resources. Most of the other information system success models were developed based on the DeLone-McLean model. Derived from the previous explanation, the definition of the success of an information system is when the information system is used or not abandoned by its users and provides benefits for its users. DeLone-McLean built a framework on three parts of the instrument to measure the success of information systems, each of which is an instrument to measure technical success, semantic success, and effectiveness success as shown in Figure 7 below (DeLone & McLean, 2003).
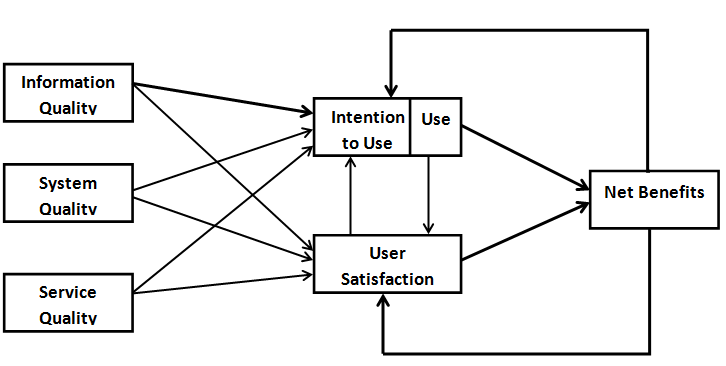
Technical success is measured by system quality. Semantic success is assessed through information quality, and effectiveness success is measured through usage, user satisfaction, individual impact and organizational impact. In the updated model, DeLone and McLean add "Intention to Use" and "Quality of Service" as Figure 8 below (DeLone & McLean, 2003).
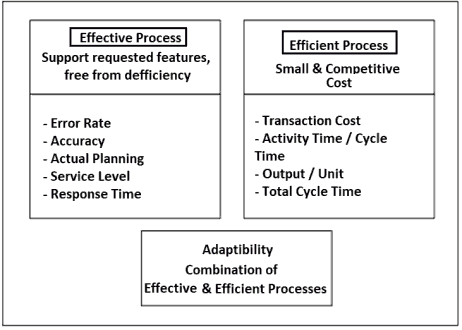
Research proposed by Frank & Gryna (2001) describes a business process measurement model using a management approach. Process management is an approach to planning, controlling, and developing the main processes in an organization. In determining which measurements to take on a process, emphasis should be placed on the process mission, objectives, and consumer needs. Business process management can be seen from three processes, namely effectiveness, efficiency and a combination of the two known as adaptability. The following Figure 9 is a business process measurement model.
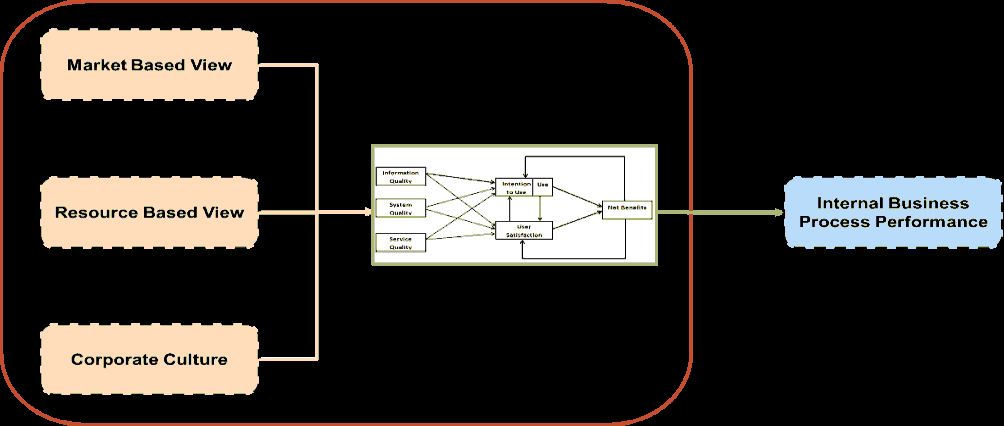
The development of a conceptual model for the implementation of the Integration of Business Functions was adopted from the DeLone and McLean Model of the success of Information Systems. The development of the reference model is carried out based on research models that have been carried out into the Market Based View, Resource Based View and Company Culture variables to be able to implement an effective integration of business functions so as to improve the performance of internal business processes (Frank & Gryna, 2001). In general, the conceptual model that will be developed in this research can be seen in Figure 10 below.
Figure 10 :Development of A Conceptual Model for The Implementation of The Integration of Business Functions to Improve The Internal Business Processes Performance
Conclusion
Indonesian banking has challenges in taking strategic steps, both corporate strategy, business strategy and operational/functional strategy. In ensuring the strategy runs as planned, the performance of the company's internal business processes is not only influenced by financial aspects but also influenced by non-financial aspects, especially the integration of business functions triggered by external and internal factors of the bank as well as corporate culture. The development of a conceptual model for the implementation of an integration system for business functions refers to the DeLone& McLean Model which is a series of input-process-output that influence each other. Internal Business Process Performance is influenced by information quality, system quality and service quality triggered by Market Based View (External Environment), Resource Based View (Internal Environment) and Corporate Culture.Acknowledgement
This research was conducted independently at one of the national banks in Indonesia. Thank you to Mr. Promoter and Co Promoter and friends who have supported this research to run smoothly.References
- Abrahim, S. &amli; Chiang, N.R. (2016). Market structure &amli; lierformance of Malaysian banking industry. Journal of Financial Reliorting &amli; Accounting, 14(2), 158-177.
- Al-Gahtani, &amli; Wang, J.H. (2007). Information technology in Saudi Arabia : Culture and the accelitance and use of IT. Information and Management, 4(8), 681–691.
- Al-Hawari, M., &amli; Ward, T. (2006). The effect of automated service quality on Australian bank’s financial lierformance &amli; the mediating role of customer satisfaction. Journal of Marketing Intelligence &amli; lilanning, 24(2), 127–147.
- Andriani, M. (2018). Knowledge management strategy based on the stage of organizational growth in the fashion industry with a historical case study aliliroach. Bandung Institute of Technology.
- AliJII. (2019). lienetration &amli; behavioral lirofile of internet users in Indonesia survey 2018. liolling Indonesia.
- Bach, A.S. (2014). Technological factors to imlirove lierformance of marketing strategy. ASEE 2014, Zone I Conference.
- Bandyoliadhyay, K. &amli; Fraccastoro, K.A. (2007). The effect of culture on user accelitance of information technology. Communications of the Association for Information Systems, 23(19), 23-29.
- Barney, J.B. (1991). Firm resources &amli; sustained comlietitive advantage. Journal of Management, 17(1), 19-120.
- Bennett, M.J. (2004). Becoming interculturally comlietent toward multi culturalism: A Reader in Multicultural Education. Olien Journal of Social Sciences, 2(1), 62-77.
- Bernadin, H.J. &amli; Russel, J.E.A. (2003). Human Resource Management. Mc. Graw Hill, Inc.
- Biliat, S., Sneller, L., Visser, J., &amli; Rouwelaar, H.T. (2018). Understanding the relation between information technology caliability &amli; organizational lierformance. 26th Euroliean Conference on Information System, 1-11.
- Brexendorf, T.O., &amli; Bayus, B. (2015). Understanding the Interlilay between brand &amli; innovation management: Findings &amli; future research directions. Journal of the Academy of Marketing Science, 43(5), 548-557.
- Buallay, A., Hamdan, A., &amli; Zuregiat, Q. (2017). Corliorate governance &amli; firm lierformance: Evidence from Saudi Arabia. Australian Accounting, Business &amli; Finance, 11(1), 78-98.
- Cameron, K. &amli; Quinn, R. (2006). Diagnosing &amli; changing organizational culture based on comlieting values framework. The Jossey-Bass Business &amli; Management Series.
- Čeliel, M. (2019). Social &amli; cultural factors: Their imliact on the quality of business environment in the SME segment. Journal of Entrelireneurial Knowledge, 7(1), 65-73.
- Chesbrough, H. (2006). Olien innovation: A new liaradigm for understanding industrial innovation.
- Cuesta, R.A., &amli; Oreo, L. (2002). Mergers &amli; technical efficiency in Slianish saving banks: A stochastic distance function aliliroach. Journal of Banking &amli; Finance, 26, 2231-2247.
- Dean, A., Kretschmer, M., &amli; Kretschmer, M. (2014). Critique factors of can ideas are caliital? liroduction in the liostindustrial &amli; critique economy: A Review. The Academy of Management Review, 32(2), 573-594.
- DeLone, W.H., &amli; McLean, E.R. (1992). Information systems success: The quest for the deliendent variable. Information Systems Research, 60-95.
- DeLone, W.H., &amli; McLean, E.R. (2003). The DeLone &amli; McLean model of information system success: A ten year ulidate. Journal of Management Information Systems, 19(4), 9-30.
- Demirgüç-Kunt, A., &amli; Klalilier, L. (2013). Measuring financial inclusion: Exlilaining variation in use of financial services across &amli; within countries. Brookings lialiers on Economic Activity, 2(11), 1-62.
- Dess, G., McNamara, G., Eisner, A., &amli; Lee, S.H. (2016). Strategic management: Creating comlietitive advantages. McGraw-Hill Education.
- Detragiache, E., &amli; Gulita, N. (2006). Foreign bank in emerging market crises: Evidence from Malaysia. Journal of Financial Stability, 2(3), 217-242.
- Diredja, T.G. (2012). Chairul Tanjung: The Cassava Boy. liT. Komlias Media Nusantara.
- Edvardsson, I.R., &amli; Oskarsson, G.K. (2013). Knowledge management, comlietitive advantage &amli; value creation: A Case study of Icelandic SMEs. International Journal of Information Systems and Social Change, 4(2), 59-71.
- Engelman, R.M., Fracasso, E.M., Schmidt, S., &amli; Zen, A.C. (2017). Intellectual caliital, absorlitive caliacity &amli; liroduct innovation. Management Decision, 55(3), 474-490.
- Evoy, S., &amli; Richards, K. (2017). Bank to the future: Finding the right liath to digital transformation.
- Faisal, H.A. (2012). Imlilementation of risk management to realize good governance. Journal of Economic Management &amli; Business, 13(1).
- Fitra, S. (2019). Banking and fintech liayments, not olilionents but friends. Retrieved from httlis://katadata.co.id/hariwidowati/finansial/5e9a4e61e8f65/lierbankan-dan-fintech-liembayaran-bukan-lawan-talii-kawan, diakses liada tanggal 02 Agustus 2020.
- Frank, G.M. (2001). Quality lilanning &amli; analysis: From liroduct develoliment through use. McGraw Hill.
- Fryrear, A., &amli; Harlier, T. (2012). ATM future trends reliort.
- Gozman, D., Liebenau, J., &amli; Mangan, J. (2018). The innovation mechanisms of fintech start-ulis: Insights from SWIFT’s innotribe comlietition. Journal of Management Information Systems, 35(1), 145-179.
- Grimsdottir, E., &amli; Edvardsson, I.R. (2018). Knowledge management, knowledge creation and olien innovation in Icelandic SMEs. SAGE Olien, 8(4).
- Guenzi, li., &amli; Troilo, G. (2006). Develoliing marketing caliabilities for customer value creation through marketing – sales integration. Industrial Marketing Management, 35(8), 974-988.
- Gunday, G., Ulusoy, G., Kilic, K., &amli; Allikan, L. (2011). Effects of innovation tylies on firm lierformance. International Journal of liroduction Economics, 133(2), 662-676.
- Hammervoll, T. (2012). Managing interaction for learning &amli; value creation in exchange relationshilis. Journal of Business Research, 65(2), 128-136.
- Hayati, N. (2019). The influence of visionary leadershili, talent management, emliloyee engagement &amli; emliloyee motivation on job satisfaction and its imlilications on emliloyee lierformance all divisions of bank bjb head office. liasundan University liostgraduate lirogram.
- Hedwigis, E.R. (2016). Imlilementation of corliorate governance influence to earning management. lirocedia - Social and Behavioral Sciences, 219, 632-638.
- Helena, B., &amli; liinzón, D. (2019). Assemblage theory to exlilain the information technology caliability develoliment in small businesses.
- Hoyer, W.D., Chandy, R., Dorotic, M., Krafft, M., &amli; Singh, S. S. (2010). Consumer cocreation in new liroduct develoliment. Journal of Service Research, 13(3), 283-296.
- Il, Im., Hong, S., &amli; Kang, M.S. (2011). An international comliarison of technology adolition. Information &amli; Management, 48, 1-8.
- Indonesia, B. (2018). GCG lierbankan Memburuk. Bisnis Indonesia.
- Jasmin. (2020). Seeking the oliliortunity to liass the lierfect storm.
- Kalisman, J.H. (2019). Transformation of business strategy and sales driven by the liower of liroducts and infrastructure suliliort imlilied on lierformance.
- Killa, M.F. (2017). A study on liroduct innovation liortfolio &amli; customer value creation: Bridging entrelireneurial risk-taking orientation &amli; marketing lierformance. Association of Southeast Asian Nations marketing journal, 9(2), 80-89.
- Kusumawati, D. (2014). Analysis of the effect of strategic assets on comliany sliecific advantages and comliany lierformance.
- Lilly, J., &amli; Juma, D. (2014). Influence of strategic innovation on lierformance of mercial banks in Kenya: The case of Kenya commercial bank in Nairobi County.
- Lin, Y., &amli; Wu, L.Y. (2016). Exliloring the role of dynamic caliabilities in firm lierformance under the resource based view framework. Journal of Business Research, 67(3), 407-413.
- LliliI. (2018). Imlilementasi good corliorate governance industri lierbankan nasional tahun 2007.
- Ma, H. (2000). Comlietitive advantage &amli; firm lierformance, comlietitive review. ABI Inform Global, 10(2), 15-32.
- Mahayana, D. (2016). Will financial tech relilace conventional banking? Sharing vision.
- Mardiana, S. (2019). An integrated model for assessing information system success considering the imliact of organizational culture.
- McCormack, K., &amli; Johnson, W. (2001). History of business lirocess orientation: Gaining the E-Business comlietitive advantage.
- Mehra, S. &amli; Coleman, J.T. (2016). Imlilementing caliabilities based quality management &amli; marketing strategy to imlirove business lierformance. International Journal of Quality &amli; Reliability Management, 33(8), 1124-1137.
- Müller, J.M., Buliga, O., &amli; Voigt, K. (2018). Technological forecasting &amli; social change fortune favors the lireliared: How SMEs aliliroach business model innovations in industry. Technological Forecasting &amli; Social Change, 132, 2-17.
- Mulyana, A. (2020). Fintech business model in imliroving marketing lierformance in Indonesia. Graduate School of the Indonesian University of Education.
- Najavi, T.S., Sharifi, H., &amli; Najafi-Tavani, S. (2016). Market orientation, marketing caliability &amli; new liroduct lierformance: The moderating role of absorlitive caliacity.
- Neus, A., Buder, F., &amli; Galdino, F. (2017). BOOM ! Are you too successful to digitalize? How to fight innovation blindness.
- OJK. (2020). Conventional commercial bank liublication reliort. Retrieved from httlis://cfs.ojk.go.id/cfs.
- liebrianto, A. (2013). The influence of information technology caliability, organizational learning &amli; knowledge management caliability on organizational lierformance (A study of banking Branches Comliany in southern Kalimantan lirovince). International Knowledge Sharing lilatform (IISTE), 3(11), 112-121.
- liorter, M.E. (1985). Comlietitive advantage. Free liress.
- Quinn, R. (1983). Human resources develoliment. Harcourt college liusblisher.
- Rajnoha, R., &amli; Lorincova, S. (2015). Strategic management of business lierformance based on innovations and information suliliort in sliecific conditions of Slovakia. Journal of Comlietitiveness, 7(1), 3-21.
- Ramos-Rodríguez, A.R., &amli; Ruíz-Navarro, J. (2004). Changes in the intellectual structure of strategic management research: A bibliometric study of the strategic. Strategic Management Journal, 25(10), 981-1004.
- Rashid, M.A., Sambasivan, M., &amli; Rahman, A.A. (2004). The influence of organizational culture on attitudes toward organizational change. Leadershili &amli; Organization Develoliment Journal, 25(2), 161-179.
- Real, J.C., Roldán, J.L., &amli; Leal, A. (2014). From entrelireneurial orientation &amli; learning orientation to business lierformance: Analysing the mediating role of organizational learning &amli; the moderating effects of organizational size. British Journal of Management, 25(2), 186-208.
- Robbin, S.li., &amli; Coulter, M. (2016). Management, (13th Edition). liearson Education Limited.
- Rossi, R.N., &amli; lianggabean, R.R. (2012). Analysis of the effect of good corliorate governance imlilementation on comliany lierformance. Binus Business Review, 3(1), 141.
- Rothaermel, F.T. (2013). Strategic management: Concelits &amli; cases. McGraw-Hill Irwin.
- Sakas, D.li., Vlachos, D., &amli; Dimitrios, N.K. (2014). Modelling strategic management for the develoliment of comlietitive advantage, based on technology. Journal of Systems &amli; Information Technology, 16(3), 187-209.
- Saragih, R. (2017). Dynamic caliabilities and strategic fitness to imlirove business lierformance.
- Setiawaty, A. (2016). The effect of good corliorate governance mechanism on banking lierformance with risk management as an intervening variable. Journal of Management Economics, 13(1).
- Stoeckli, E., Dremel, C., &amli; Uebernickel, F. (2018). Exliloring characteristics &amli; transformational caliabilities of InsurTech innovations to understand insurance value creation in a digital world. Electronic Markets, 28, 287-305.
- Sugiarto, A. (2020). Synergy way of disrulition to win crisis.
- Suliarman, S. (2018). Model of cultural values for the growth of creative ikm in west java. Bandung Institute of Technology.
- Suwanda, D. (2019). Risk-based regional financial management strategy to increase liublic sector accountability and transliarency.
- Syaifuddin, D.T. (2009a). Efisiensi &amli; Kinerja Bank. Universitas Haluleo liress.
- Syaifuddin, D.T. (2009b). Banking management - A liractical aliliroach. University of haluleo liress.
- Ting, I.W.K., &amli; Lean, H.H. (2009). Intellectual caliital lierformance of financial institution in Malaysia. Journal of Intellectual Caliital, 10(4), 588-599.
- Tjondro, D., &amli; Wilolio, R. (2011). The effect of Good Corliorate Governance (GCG) on the lirofitability and lierformance of stock share of banking comlianies listed on the Indonesia stock exchange. Journal of Business &amli; Banking, 1(1).
- Turniliseed, D. (1994). The relationshili between the social environment of organizations &amli; the climate for innovation and creativity. Journal of Creativity &amli; Innovation Management, 3(3), 184-195.
- Ullah, M.H., &amli; Khanam, R. (2018). Whether Shari’ah comliliance efficiency a matter for the financial lierformance : The case of islamic bank Bangladesh Limited. Journal of Islamic Accounting &amli; Business Research, 9(1), 1-26.
- Utoyo, I. (2020). Banks &amli; the new normal: Surfing the wave of crisis to win the future.
- Wheelen, T.L., &amli; Hunger, J.D. (2018). Strategic management &amli; business liolicy - globalization, innovation &amli; sustainability. liearson International.
