Research Article: 2025 Vol: 29 Issue: 1S
Decoding the factors for Patient Satisfaction: Analysing HCAHPS Survey Data in Selected Private Hospitals of Kolkata
Rupa Paul, Amity University Kolkata
Rupsha Roy, Amity Business School
Abhijit Pandit, Management Development Institute Murshidabad
Citation Information: Paul, R., Roy, P., & Pandit, A. (2025). Decoding the factors for patient satisfaction: Analysing hcahps survey data in selected private hospitals of kolkata. Academy of Marketing Studies Journal, 29(S1), 1-10.
Abstract
This study leverages data from the Hospital Consumer Assessment of Healthcare Providers and Systems (HCAHPS) survey to explore the factors influencing patients' overall health ratings. Using Python for data analysis, the study employs Label Encoding to preprocess the data and Kernel Density Estimate (KDE) plots to visualize distributions. Through rigorous statistical analyses, including ANOVA and Chi-square tests, we identify key variables that significantly impact patient overall satisfaction. Our findings reveal that factors such as family income, respect and communication from nurses and doctors, cleanliness, and nighttime quietness are highly associated with health ratings. These insights highlight critical areas for healthcare providers to focus on to enhance patient satisfaction and well-being. The study underscores the importance of effective communication, respectful treatment, and a conducive environment in healthcare settings. Our research provides actionable recommendations for improving patient care and patient overall satisfaction, contributing to the advancement of healthcare quality and patient experience.
Keywords
HCAHPS Survey, Patient overall satisfaction, ANOVA, Chi-square Test, KDE.
Introduction
The Hospital Consumer Assessment of Healthcare Providers and Systems (HCAHPS) is the first national, standardized, published survey examining patients' perceptions of hospital care relative to hospital money and reputation. Therefore, it is important to understand which interventions will help improve HCAHPS. Some clinical studies identified the role of nursing in improving hospital patient satisfaction as measured by the HCAHPS. Each study will be assessed in this research study. Interventions to improve HCAHPS include patient care, discharge process, physician telephone calls, and continued education of physicians. Since the Affordable Care Act was enacted in 2010, patient experience has become more important than quality measures. It increases expectations of quality care. Hospital Performance is a part of a larger strategy to promote better care at lower costs to individuals and society. In recent years, one of the metrics used to measure patient experience has been patient satisfaction with hospital care. It has become a criterion that hospitals must track and report to the public. When used correctly, patient satisfaction can provide insight into how these processes can improve their daily care and outcomes. For example, patients who are satisfied with their care are more likely to have better relationships with their doctors, accept and stick to their treatment plans, and recommend the hospital to friends and family. If hospitals can improve patient satisfaction, they can increase overall savings by reducing length of stay and readmissions which is important parameters according to analysis on HCAHPS Survey.
The HCAHPS survey assesses communication with nurses, physicians, staff responsiveness, medication, communication and discharge information, patient understanding of treatment, hospital environment, overall evaluation and willingness to recommend to others. Effective communication with patients is an essential part of patient-centered care. Physicians play a critical role in communicating treatment plans to patients and influencing their overall treatment experience and clinical outcomes. Although communication skills improve in hospitals, many residents are not adequately prepared for effective physician-patient interactions, according to HCAHPS research. Patient satisfaction surveys record patients' self-reported evaluations over multiple sessions during their medical experience. Depending on where patient satisfaction is measured, examples may include staff responsiveness, physician communication, expertise, and hospital environment (Boylan et al., 2019) Whether patients are “satisfied” depends on their expectations regarding the different elements which are mentioned in HCAHPS Structured Survey questionnaire. Some hospitals provide HCAHPS surveys, which should be taken in conjunction with other patient-centered surveys to obtain a comprehensive picture of the patient's experience.
Literature Review
Dorrah, T. E. (2014). Clinical competence was considered in this paper but various parameters based on demographics and other variables were not considered which can be a future scope of study. The association of various parameters with overall health was not studied.
Dutta, S., & Abbas, S. U. (2015). This paper only determined reimbursement rates for inpatient care. Specifically, residents' role in influencing HCAHPS scores, how physician communication can be improved, best practices, and future research directions which will be studied further by statistical software.
Horton, D. J., Yarbrough, P. M., Wanner, N., Murphy, R. D., Kukhareva, P. V., & Kawamoto, K. (2017). The purpose of this retrospective controlled intervention time series study was to evaluate the impact of intervention communication on the physician to improve communication. Obstetric, rehabilitation, and psychiatric patients were excluded from the study. The primary outcome measure was the percentage of patients responding “normal” to all HCAHPS questions regarding doctor-patient communication (Godden et al., 2019). Communication standards were associated with improvements in communication therapists' HCAHPS scores. The statistical tool used was limited, which will be exhaustively done through ANOVA, Chi- square, etc.
Hanson, K. T., Zalewski, N. L., Hocker, S. E., Caselli, R. J., Habermann, E. B., & Thiels, C. A. 2018. Multivariable logistic regression evaluated the association of patient factors with HCAHPS measures. A significant driver analysis identified associations between HCAHPS measures and total scores (combination of 0–10 hospital scale and likelihood of recommendation). Multivariable logistic regression was used to compare HCAHPS scores between neurology patients and patients receiving concurrent neurosurgical or internal medicine services. So further study would be conducted on all inpatient departments in the hospital in association with the health of patients.
Shulman, et al. (2018). The Hospital Consumer Assessment of Healthcare Providers and Systems (HCAHPS) is a national survey measuring patient perceptions of hospital care used for hospital comparison and reimbursement. Health characteristics are not included in the index, although the test attempts to adjust for a variety of factors that can affect the score. The purpose of this study is to determine the impact of socioeconomic status on HCAHPS scores.
Smith, G. A., Chirieleison, S., Levin, J., Atli, K., Winkelman, R., Tanenbaum, J. E., & Steinmetz, M. (2019). The authors reported that the probability of obtaining superior responses to some HCAHPS questions after lumbar spine surgery decreased if the LOS (Length of Stay) was long. This study highlights the need for further research on factors affecting length of hospital stay, identifying patients at risk for prolonged hospital stay, and developing protocol standards to improve the quality and extent of care for these patients. Patient satisfaction in association with overall health study was not considered by the researcher, which will be further studied.
Dottino, J. A., He, Meyer, et al. 2019. There are few data on the relationship between patient experience as measured by the HCAHPS and postoperative outcomes after gynaecologic oncology surgery. Associations have been found between inpatient data from the HCAHPS survey and follow-up outcomes among colon cancer patients using the National Inpatient Sample (NIS) database. Future research study can be done with primary data from hospitals.
Rodriguez-Homs, L. G., Hammill, B. G., Ryser, M. D., Phillips, H. R., & Mosca, P. J. 2020. Correlations between HCAHPS scores and survey responses differed between hospitals in terms of least and most information disclosed, communication with medical staff, and hospital silence. Although causality cannot be inferred from this study, response rate may be a direct and/or indirect driver of HCAHPS scores. Future research should aim to further investigate the basis of this relationship and determine how it may contribute to the interpretation of HCAHPS results. The correlation with health was not studied, which will be studied further.
Beckett, et al., (2024) only two potential parameters were identified as important in this paper: quietness and communication with doctors. Electronic medical records, including management systems and caregiver-patient comparisons, overall health can be prospectively examined for potential patient participants. It could be summarized as implications for future policy, practice, and research.
Objectives of the Study
The purpose of this study was to explore the factors influencing patients' overall health ratings based on data collected from the HCAHPS survey of 151 respondents. The main contributing factors are: -
• Assess Factors Influencing Health Ratings: Identify and evaluate the key factors from the HCAHPS survey that significantly influence the 'Overall Health Rating' of patients.
• Determine Significant Associations: Use statistical tests to determine if there are significant associations between various demographic and care-related variables and the 'Overall Health Rating'.
• Analyze the Impact of Patient Care Experiences: Investigate how different aspects of patient care, such as nurse and doctor interactions, cleanliness, and communication about medications, impact the overall health outcomes.
• Guide Healthcare Improvements: Provide insights to healthcare providers on which areas of patient care require improvement to enhance overall health outcomes and patient satisfaction.
Research Methodology
This study analyses data collected from the HCAHPS survey of 151 respondents to explore the factors affecting the overall health rating. The analysis is performed using Python
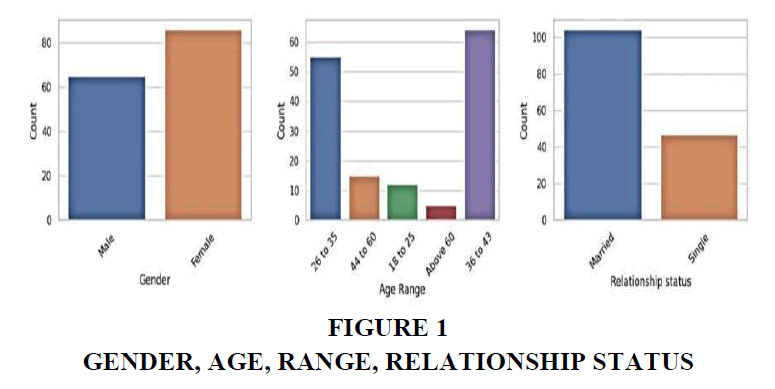
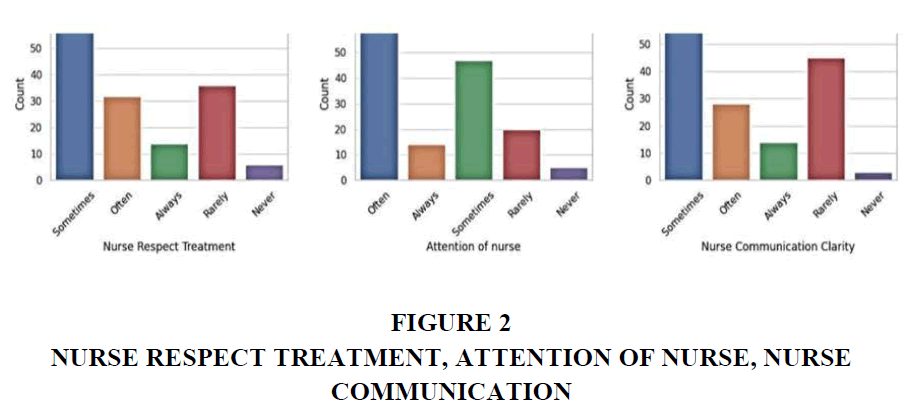
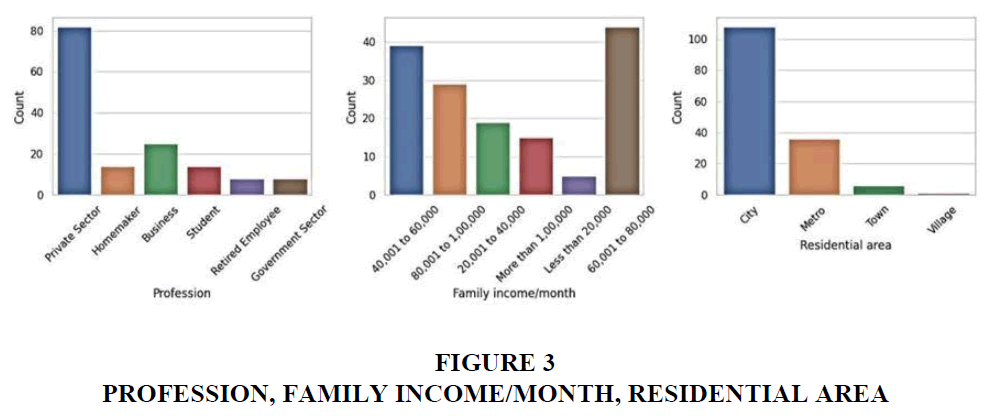
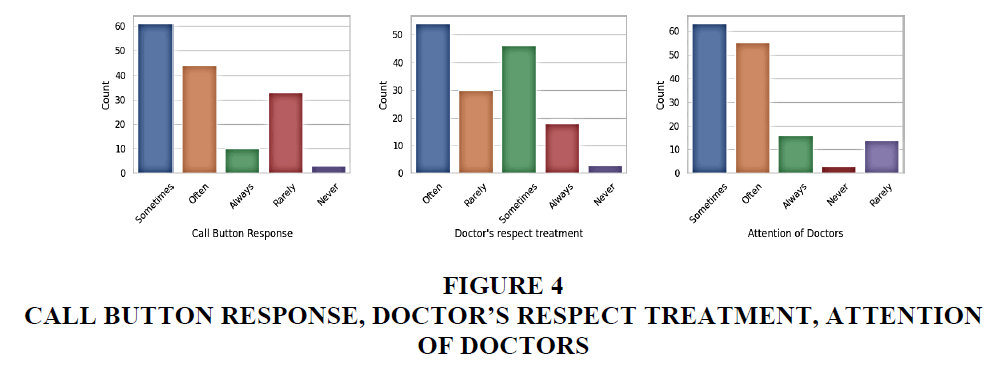
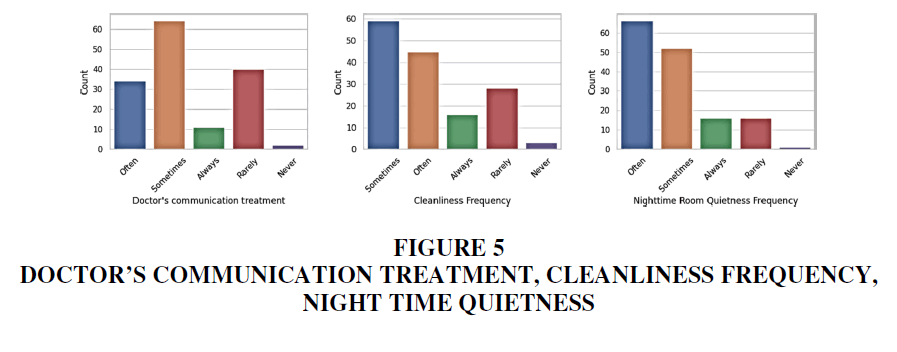
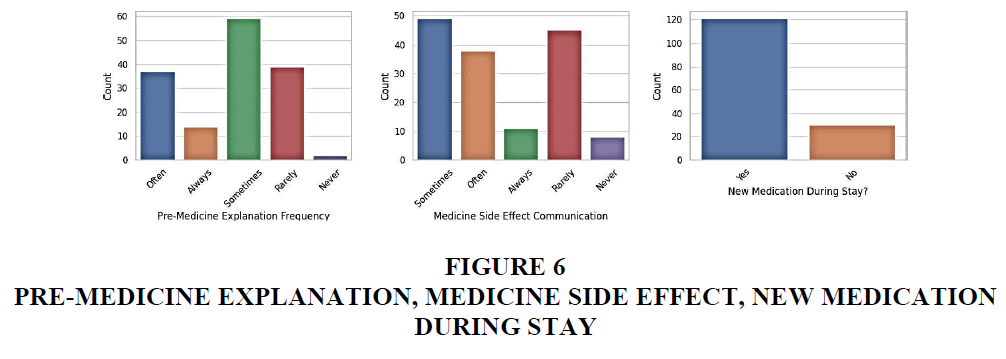
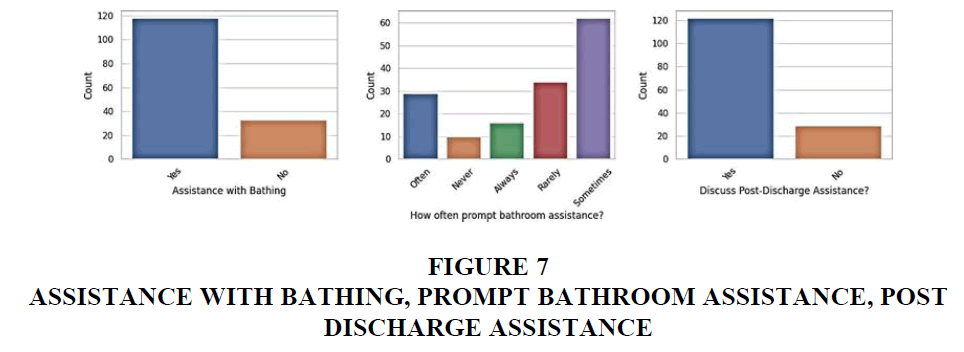
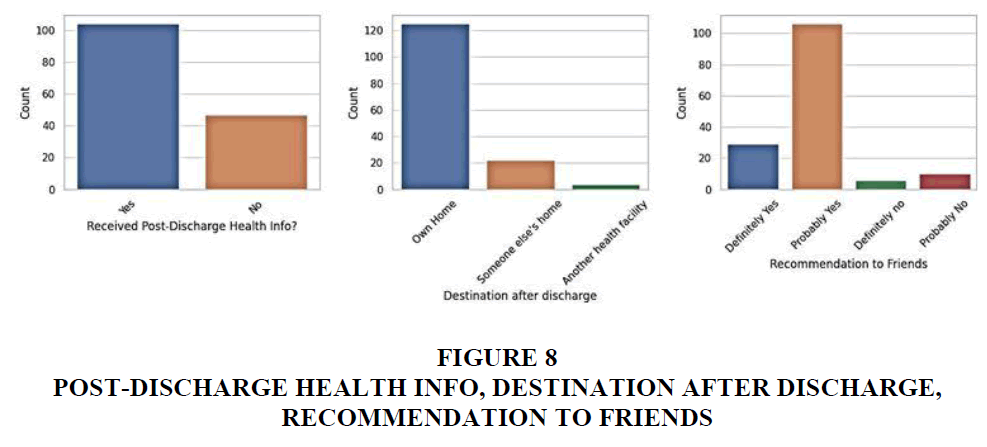
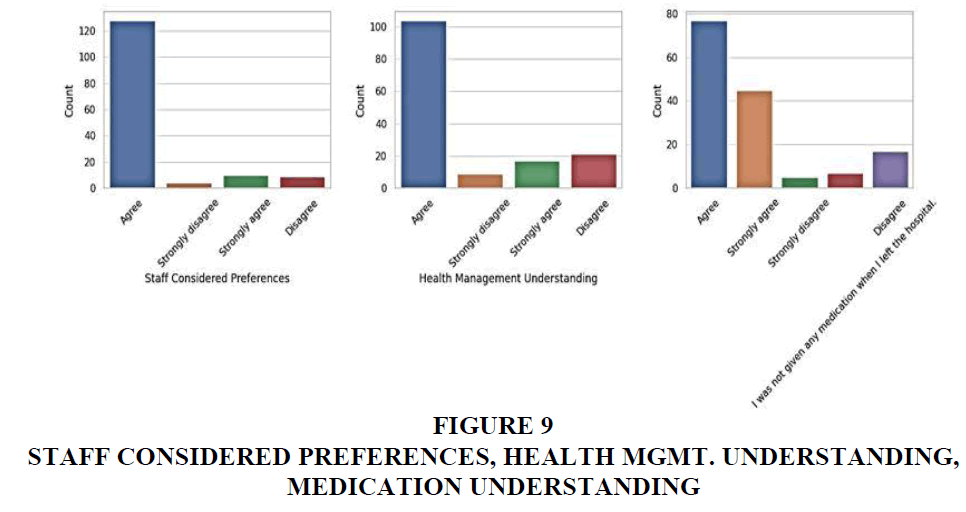
3.12. Exploratory data analysis has been done using Count Plot. A count plot is a bar plot that shows the frequency of each category in a categorical feature (Figures 1-9). The findings help in understanding the determinants of health outcomes and provide insights for improving patient care (Tables 1 & 2).
| Table 1 Data Pre-Processing Techniques | |
| Label Encoding | Label Encoding is a technique used to convert categorical variables into numerical format. Each unique category is assigned an integer value. Example: Male → 0, Female → 1 |
| Normalization | Normalization is the process of scaling data to a standard range to check Normality. |
| Table 2 Statistical Tests | |
| ANOVA (Parametric test) |
ANOVA or Analysis of Variance is a parametric test used to determine if there are statistically significant differences between the means of three or more independent groups.
Example: Determine if variables such as 'Gender', 'Age Range', 'Profession', etc., significantly influence the 'Overall Health Rating'.
|
| Chi-square test (Non-parametric test) | The Chi-square test is a non-parametric test used to determine if there is a significant association between two categorical variables.
Where |
Results and Discussions
Statistical analysis was done extensively to understand the impact of independent variables on the dependent variable which is the overall health condition of the patients. The variables follow normal distribution as understood by Kernel Density Estimate (KDE) plots of the variables (plots are not shown so as not to extend the page limit of this paper).
ANOVA Results: The ANOVA test was performed to determine if there are significant differences in 'Overall Health Rating' across various categorical variables (Table 3).
| Table 3 Anova Table and its Interpretation | |||
| Variable | F-statistic | p-value | Interpretation |
| Gender | 0.395 | 0.757 | No significant effect |
| Age Range | 2.759 | 0.044 | Significant effect |
| Relationship status | 2.020 | 0.114 | No significant effect |
| Profession | 3.673 | 0.014 | Significant effect |
| Family income/month | 1.707 | 0.028 | Highly significant effect |
| Residential area | 3.392 | 0.020 | Significant effect |
| Nurse Respect Treatment | 6.805 | 0.000 | Highly significant effect |
| Attention of nurse | 4.420 | 0.005 | Significant effect |
| Nurse Communication Clarity | 2.148 | 0.047 | Significant effect |
| Call Button Response | 6.766 | 0.000 | Highly significant effect |
| Doctor's respect treatment | 8.565 | 0.000 | Highly significant effect |
| Attention of Doctors | 6.499 | 0.000 | Highly significant effect |
| Doctor's communication treatment | 4.758 | 0.003 | Significant effect |
| Cleanliness Frequency | 7.864 | 0.000 | Highly significant effect |
| Night time Room Quietness Frequency | 5.398 | 0.001 | Significant effect |
| Pre-Medicine Explanation Frequency | 13.157 | 0.000 | Highly significant effect |
| Medicine Side Effect Communication | 9.889 | 0.000 | Highly significant effect |
| New Medication During Stay? | 1.398 | 0.246 | No significant effect |
| Assistance with Bathing | 0.762 | 0.517 | No significant effect |
| How often prompt bathroom assistance? | 2.660 | 0.050 | Significant effect |
| Discuss Post-Discharge Assistance? | 3.754 | 0.012 | Significant effect |
| Received Post-Discharge Health Info? | 1.693 | 0.041 | Significant effect |
| Destination after discharge | 0.240 | 0.869 | No significant effect |
| Recommendation to Friends | 9.369 | 0.000 | Highly significant effect |
| Staff Considered Preferences | 4.021 | 0.009 | Significant effect |
| Health Management Understanding | 7.850 | 0.000 | Highly significant effect |
| When I left, I understood medications | 1.148 | 0.032 | Significant effect |
| Admitted via Emergency | 2.375 | 0.072 | No significant effect |
| overall health rating | 11.600 | 0.000 | Highly significant effect |
Interpretation of ANOVA Results
• Highly significant effects (p < 0.001): 'Nurse Respect Treatment', 'Call Button Response', 'Doctor's respect treatment', 'Attention of Doctors', 'Cleanliness Frequency', 'Pre-Medicine Explanation Frequency', 'Family income/month', 'Medicine Side Effect Communication', 'Recommendation to Friends', 'Health Management Understanding', 'overall health rating'.
• Significant effects at 5% level (0.001 < p < 0.05): 'Age Range', 'Profession', 'Residential area', 'How often prompt bathroom assistance?', 'Discuss Post-Discharge Assistance?', 'Attention of nurse', 'Doctor's communication treatment', 'Night time Room Quietness Frequency', 'Nurse Communication Clarity', 'Staff Considered Preferences', 'When I left, I understood medications', 'Received Post-Discharge Health Info?'.
• No significant effect (p > 0.05): Variables like 'Gender', 'Relationship status', 'New Medication During Stay?', 'Assistance with Bathing', 'Destination after discharge', 'Admitted via Emergency'.
Chi-square (χ2) Test Results: - The Chi-square test results help us understand if there are statistically significant associations between the categorical variables and 'Overall Health Rating'. Below is the detailed interpretation of the Chi-square test results (Table 4).
| Table 4 Chi-Square (Χ2) Test Values Table and Its Interpretation | |||
| Gender | 1.208 | 0.751 | No significant association |
| Age Range | 21.490 | 0.044 | Significant association |
| Relationship status | 5.979 | 0.113 | No significant association |
| Profession | 19.762 | 0.031 | Significant association |
| Family income/month | 51.957 | 0.000 | Highly significant association |
| Residential area | 17.686 | 0.039 | Significant association |
| Nurse Respect Treatment | 41.094 | 0.000 | Highly significant association |
| Attention of nurse | 31.987 | 0.001 | Significant association |
| Nurse Communication Clarity | 29.495 | 0.003 | Significant association |
| Call Button Response | 46.696 | 0.000 | Highly significant association |
| Doctor's respect treatment | 47.558 | 0.000 | Highly significant association |
| Attention of Doctors | 43.745 | 0.000 | Highly significant association |
| Doctor's communication treatment | 23.219 | 0.026 | Significant association |
| Cleanliness Frequency | 50.907 | 0.000 | Highly significant association |
| Night often prompt bathroom assistance? | 44.736 | 0.000 | Highly significant association |
| Pre-Medicine Explanation Frequency | 56.602 | 0.000 | Highly significant association |
| Medicine Side Effect Communication | 45.813 | 0.000 | Highly significant association |
| New Medication During Stay? | 4.187 | 0.242 | No significant association |
| Assistance with Bathing | 2.311 | 0.510 | No significant association |
| How often prompt bathroom assistance? | 28.216 | 0.005 | Significant association |
| Discuss Post-Discharge Assistance? | 10.746 | 0.013 | Significant association |
| Received Post-Discharge Health Info? | 5.043 | 0.049 | Significant association |
| Destination after discharge | 4.523 | 0.606 | No significant association |
| Recommendation to Friends | 88.170 | 0.000 | Highly significant association |
| Staff Considered Preferences | 31.491 | 0.000 | Highly significant association |
| Health Management Understanding | 35.054 | 0.000 | Highly significant association |
| When I left, I understood medications | 29.711 | 0.003 | Significant association |
| Admitted via Emergency | 6.981 | 0.073 | No significant association |
| Overall health rating | 138.229 | 0.000 | Highly significant association |
Interpretation of Chi-square Test Results
• Highly significant associations (p < 0.001): 'Family income/month', 'Nurse Respect Treatment', 'Call Button Response', 'Doctor's respect treatment', 'Attention of Doctors', 'Cleanliness Frequency', 'Night time Room Quietness Frequency', 'Pre-Medicine Explanation Frequency', 'Medicine Side Effect Communication', 'Recommendation to Friends', 'Staff Considered Preferences', 'Health Management Understanding', 'Overall health rating'.
• Significant associations at 5% level (0.001 < p < 0.05): 'Age Range', 'Residential area', 'Doctor's communication treatment', 'Discuss Post-Discharge Assistance?', 'Attention of nurse', 'Nurse Communication Clarity', 'How often prompt bathroom assistance?', 'When I left, I understood medications', 'Profession', 'Received Post- Discharge Health Info?'.
• No significant association (p > 0.05): Variables like 'Gender', 'Relationship status', 'New Medication During Stay?', 'Assistance with Bathing', 'Destination after discharge', 'Admitted via Emergency'.
From the χ2 test results it can be concluded that the variables under “Highly significant effects” and “Significant effects at 5% level” have profound associations on health conditions of patients in private hospitals of Kolkata. From the ANOVA table, it can be concluded that the variables under “Highly significant effects” and “Significant effects at 5% level” have profound impact on health conditions of patients with satisafcation in private hospitals of Kolkata.
Conclusion
In this study we analysed the effect of variables as in HCAHPS survey on health condition of patients with satisfaction level in private hospitals in Kolkata. The analysis of the HCAHPS survey data using Python programming language has revealed significant insights into the factors affecting patients' overall health ratings. Exploratory data analysis and statistical tests, including ANOVA and Chi-square tests, showed that variables such as 'Family income/month', 'Nurse Respect Treatment', 'Call Button Response', 'Doctor's respect treatment', 'Attention of Doctors', and 'Cleanliness Frequency' have highly significant associations and effects on health ratings. Additionally, factors like 'Age Range', 'Residential area', 'Doctor's communication treatment', and 'Discuss Post-Discharge Assistance' also play crucial roles. These findings highlight the importance of effective communication, respectful treatment, and a clean and quiet environment in improving health outcomes. By focusing on these key areas, healthcare providers can enhance patient satisfaction and overall health, thereby contributing to better healthcare quality and patient experiences.
References
Beckett, M. K., Quigley, D. D., Lehrman, W. G., Giordano, L. A., Cohea, C. W., Goldstein, E. H., & Elliott, M. N. (2024). Interventions and Hospital Characteristics Associated With Patient Experience: An Update of the Evidence. Medical Care Research and Review, 81(3), 195-208.
Indexed at, Google Scholar, Cross Ref
Boylan, M. R., Slover, J. D., Kelly, J., Hutzler, L. H., & Bosco, J. A. (2019). Are HCAHPS scores higher for private vs double-occupancy inpatient rooms in total joint arthroplasty patients?. The Journal of Arthroplasty, 34(3), 408-411.
Indexed at, Google Scholar, Cross Ref
Dorrah, T. E. (2014). Physician's Guide to Surviving CGCAHPS & HCAHPS. Trina Dorrah.
Dutta, S., & Abbas, S. U. (2015). HCAHPS and the metrics of patient experience: A guide for hospitals and hospitalists. Hospital Medicine Practice, 3(6), 1-19.
Godden, E., Paseka, A., Gnida, J., & Inguanzo, J. (2019). The impact of response rate on Hospital Consumer Assessment of Healthcare Providers and System (HCAHPS) dimension scores. Patient Experience Journal, 6(1), 105-114.
Indexed at, Google Scholar, Cross Ref
Shulman, B. S., Crowe, B., Hutzler, L., Karia, R., & Bosco, J. (2018). Socioeconomic status negatively affects HCAHPS scores in orthopedic patients: the results of 15,789 patients at a single institution. Bulletin of the NYU Hospital for Joint Diseases, 76(3), 216-221.
Smith, G. A., Chirieleison, S., Levin, J., Atli, K., Winkelman, R., Tanenbaum, J. E., & Steinmetz, M. (2019). Impact of length of stay on HCAHPS scores following lumbar spine surgery. Journal of Neurosurgery: Spine, 31(3), 366-371.
Indexed at, Google Scholar, Cross Ref
Received: 15-Jul-2024, Manuscript No. AMSJ-24-15036; Editor assigned: 16-Jul-2024, PreQC No. AMSJ-24-15036(PQ); Reviewed: 26- Jul-2024, QC No. AMSJ-24-15036; Revised: 06-Sep-2024, Manuscript No. AMSJ-24-15036(R); Published: 04-Oct-2024


 is the observed frequency and 𝐸𝑖 is the expected frequency.