Research Article: 2022 Vol: 25 Issue: 1
Customer churn prediction with hybrid resampling and ensemble learning
Takuma Kimura, Hosei University
Citation Information: Kimura, T. (2022). Customer churn prediction with hybrid resampling and ensemble learning. Journal of Management Information and Decision Sciences, 25(1), 1-23.
Abstract
Since acquiring new customers is often more costly than retaining existing ones, customer retention management is critical for many business organizations. Identifying potential churners can lead to effective retention management. However, predicting customer churn is difficult because there are diverse predictors of customer churn, and their effect sizes are not evident. The technical advancement of data storage and data analytics has enabled us to implement customer churn prediction using machine learning techniques. Therefore, as one of the keys to retaining customers, customer churn prediction has drawn the growing interest of both academic researchers and marketing practitioners. Researchers have applied supervised machine learning algorithms to customer churn prediction, regarding it as a binary classification problem. Among those algorithms used in previous studies, the most popular ones are logistic regression, K-Nearest Neighbor, and Decision Tree. Recent studies have shown that advanced ensemble learning models such as XGBoost, LightGBM, and CatBoost achieve high prediction performance in classification problems. However, only a few studies applied them to customer churn prediction. In many cases, the datasets used in customer churn prediction are imbalanced: with only a few churn cases and many non-churn cases. Therefore, previous studies have mainly applied Synthetic Minority Over-sampling Technique (SMOTE) to balance the data. Recently, researchers have proposed hybrid resampling such as SMOTE-ENN and SMOTE Tomek-Links as novel and effective resampling methods. However, few studies applied these hybrid methods to customer churn prediction. Therefore, by developing a prediction model combining ensemble learning algorithms and hybrid resampling methods and comparing the model’s prediction performance with traditional methods and previous studies, this study aims to make a unique contribution to research in customer churn prediction.
Keywords
Customer churn prediction; Machine learning, Imbalanced classification problem, Ensemble method.
Introduction
In today’s fiercely competitive market, customer relationship management (CRM) has become imperative for firms. One of its key objectives is customer retention since retaining valuable customers makes the firm’s performance stable, and acquiring new customers is costly (Pamina et al., 2019). Fetching a new customer is shown to be five to six times more costly than keeping an existing one (Backiel et al., 2016; Chung et al., 2016; Zhu et al., 2017). Besides, customer retention is vital for corporate reputation management. The bulk of customer churn in a short period can injure the company’s reputation. Moreover, churners can spread bad word-of-mouth, which is detrimental to the firm’s reputation (Vijaya & Sivasankar, 2018). Due to the proliferation of Web 2.0 technology, such bad word-of-mouth will spread rapidly through blogs, online review sites, and social networking service, and so on (Ahmad & Laroche, 2017). Therefore, firms’ marketing focus has shifted from new customer acquisition to customer retention.
There are two approaches in marketing analytics for customer retention management. One is the identification of the predictor of customer churn. Another is the prediction of who will churn and who will not. The first approach investigates the predictors of customer loyalty and customer churn (Hadi et al., 2019; Srivastava & Rai, 2018; Sudari et al., 2019). However, enhancing customer loyalty is not always feasible since it requires costly activities such as drastic quality improvement, delivery transformation, and broad-range campaigns. The second approach, customer churn prediction aims to identify potential churners accurately. Accurate churn prediction enables firms to apply focused retention campaigns to potential churners, and thus, improve the efficiency and effectiveness of their customer retention management (Gaurav Gupta, 2019; Vijaya & Sivasankar, 2018).
Customer churn is conceptualized in several ways. One stream of research defines it as customers’ switching from one service provider to another (Kumar & Kumar, 2019; Mishra & Reddy, 2017; Mozer et al., 2000; Rai et al., 2020). Others simply refer to it as the customers’ likeliness to stop using service (Sharma et al., 2020). Since customer churn includes both of these aspects, this study defines customer churn as “customer behavior of stopping the use of the service irrespective of whether the customer switches the service providers or just ends the usage.”
Due to the technical advancement in data storage and data analytics, customer churn prediction using data analytics has become one of the most popular topics in the marketing analytics field. Researchers and practitioners now try to build effective churn prediction models (Sharma et al., 2020). However, since various factors can affect customers’ churn, accurate churn prediction is not easy. Besides, class imbalances often seen in customer churn datasets make it hard for machine learning models to achieve high prediction performance. If a churn prediction model fails to identify potential churners, the firm will lose valuable customers and future profits. Moreover, if the firm misidentifies the loyal customers as potential churners, it will make a wasted investment in customer retention.
In previous studies on customer churn prediction, the most often used classification algorithms are Logistic Regression, KNN, and Decision Tree (Pamina et al., 2019). Recent studies showed that ensemble learning methods such as AdaBoost and XGBoost achieve high performance in classification problems. However, only a few studies have applied these algorithms in customer churn prediction. Another issue is class imbalance in customer churn prediction. Imbalanced data is a dataset with a skewed class proportion. When the class is imbalanced, a classification model is likely to generate poor performance since it spends most of its training time on the majority class and does not sufficiently learn from the minority class. Resampling methods can balance the class proportions to improve the classification performance for an imbalanced dataset. The most popular resampling method is Synthetic Minority Over-sampling Technique (SMOTE). Recently, hybrid resampling methods has been proposed as a more effective way to handle imbalanced data. However, few studies have applied those methods in customer churn prediction.
This study addresses this research gap by developing classification models using novel ensemble algorithms and hybrid resampling. The model performance will be evaluated by major metrics and be compared with those of traditional algorithms. Therefore, the research objectives are:
• Develop classification models that combine ensemble classification algorithms and hybrid resampling methods.
• Apply the developed models to customer churn data and evaluate their prediction performance with various performance metrics.
• Compare the prediction performance of the developed models and that of current popular models that combine traditional and ensemble models with a popular resampling method.
Literature Review
Customer Churn Prediction as a Classification Problem
Customer churn can be classified into “contractual churn” and non-contractual churn.” While contractual churn occurs in subscription type businesses, non-contractual churn happens in pay-as-you-go business models. In contract churn, churners are easy to be identified by subscription cancellation. Meanwhile, in non-contractual churn, churners are hard to identify because customers can stop purchasing without explicit cancellation or termination. Hence, customer churn prediction attracts attention more in subscription type businesses like telecommunication, social networks, and online games (Vijaya & Sivasankar, 2018; Wang et al., 2019). This study focuses on predicting contractual customer churn in the telecommunication industry in response to the growing attention in this theme.
The technological advancement and the market growth of information and communication technology (ICT) have caused high competition in the telecommunication industry. Besides, the existence of various telecommunication service providers tempts customers to move from one provider to another (Vijaya & Sivasankar, 2018). Furthermore, the technological advancement in storing and analysing a large volume of data makes data mining an essential tool for marketing analytics (Leventhal & Langdell, 2013), including customer churn prediction (Mishra & Reddy, 2017). Customer churn prediction can be addressed as a binary classification problem where customers will be classified into churners and non-churners. Since classification is a kind of supervised learning problems (Coussement et al., 2017), analysts mainly apply supervised machine learning techniques to customer churn prediction (Singh et al., 2018).
Previous studies have accumulated much evidence on the effectiveness of machine learning in predicting customer churn (Ahmad et al., 2019). Since datasets used for churn prediction are often imbalanced, researchers applied class rebalancing techniques to improve the classification performance (Burez & Van den Poel, 2009; Verbeke et al., 2011). Although researchers have applied various classification algorithms to churn prediction (Spiteri & Azzopardi, 2018), there is no consensus on a single dominating method yet (Wang et al., 2019).
Customer Churn Prediction by Traditional Classification Methods
Prior studies have applied various classification algorithms to customer churn prediction. Hashmi et al. (2013) reviewed 61 articles on customer churn prediction in the telecommunication industry published from 2002 to 2013. Their reviewed articles were limited to those published in journals with Journal Citation Report Impact Factor. According to their review, the most popularly used algorithms in this period were traditional ones such as Logistic Regression, Decision Tree, and Artificial Neural Network. Eria and Marikannan (2018) reviewed more recent articles published from 2014 to 2017. Their review showed that traditional machine learning algorithms were still dominant in this period. Specifically, the most frequently used classification algorithms in this period were SVM (Support Vector Machine) and Neural Network, followed by Decision Tree, Naïve Bayes, and Logistic Regression.
According to prior studies, these traditional algorithms are not equivalently effective. Some studies indicated the relative superiority of SVM. Brânduşoiu et al. (2016) showed that SVM achieved the highest accuracy, followed by Bayesian Network and Multilayer-Perceptron Neural Network. Singh et al. (2018) also showed the superiority of SVM compared to Logistic Regression and KNN (K-Nearest Neighbors). Some studies showed the high performance of Neural Network. In the analysis of Lee et al. (2017), Neural Network achieved the highest accuracy, followed by Decision Tree and Logistic Regression. Bharadwaj et al. (2018) showed that Neural Network achieved higher accuracy than Logistic Regression.
Customer Churn Prediction by Ensemble Methods
Recently, ensemble learning methods become popular in customer churn prediction (Liang et al., 2019). Ensemble methods are meta-algorithms that combine multiple machine learning models to improve predictive performance. There are two types of ensemble methods: Bagging and Boosting. Random Forest is the most popular Bagging method, and XGBoost, LightGBM, and CatBoost are Boosting methods that have drawn much attention in recent studies on binary classification. Past studies of customer churn prediction showed superior performance of Random Forest compared to the traditional classification methods. For example, Mishra and Reddy (2017) showed that Random Forest achieved higher performance than Naïve Bayes, SVM, Decision Tree, Bagging, and Boosting. Singh et al.’s (2018) showed the superior performance of Random Forest compared to SVM, KNN, and Logistic Regression. In Raeisi and Sajedi (2020), GBDT achieved the highest accuracy, followed by Decision Tree and Random Forest. KNN (0.575) and Naïve Bayes (0.646) underperformed these methods.
As ensemble methods, Boosting-based algorithms showed excellent classification performance in various research fields but has not yet widely prevailed in research on customer churn prediction. XGBoost (Extreme Gradient Boosting) is a recently proposed ensemble method. It is an advanced method of gradient boosting (Chen & Guestrin, 2016). In 2015, many of the winners in the Kaggle competitions used XGBoost. Since then, XGBoost has become one of the de facto methods of the first choice in supervised machine learning problems. It is now widely applied in various fields such as cancer diagnosis, medical record analysis, credit risk assessment, and metagenomics (Wang et al., 2019). Past studies showed that XGBoost outperformed Random Forest and traditional classification method in various classification problems such as network intrusion detection (Dhaliwal et al., 2018), mobile payment fraud detection (Zhou et a., 2018), credit card fraud detection (Baesens et al., in press), and bond default prediction (Zhang et al., 2018).
Recently, XGBoost has been applied in customer churn prediction also. For instance, using the IBM dataset, Pamina et al. (2019) showed that XGBoost achieved higher accuracy and F-score than KNN and Random Forest. Lalwani et al. (2021) also used the IBM dataset and showed that XGBoost achieved a higher ROC-AUC score than traditional models (SVM, KNN, Naïve Bayes, and Decision Tree) and other ensemble methods (Random Forest, AdaBoost, and CatBoost). However, XGBoost has not yet taken the dominant position in customer churn prediction. In Lalwani et al.’s (2021) study, recall score is lower in XGBoost than in other ensemble methods such as AdaBoost, Random Forest, and CatBoost. Patil et al. (2017) showed that while XGBoost showed superior accuracy than SVM (0.702) and Random Forest, as to recall, XGBoost outperformed Random Forest but underperformed SVM. LightGBM is another advanced Boosting algorithm that is more recently published and has drawn much attention in recent studies. It is a gradient boosting method based on Decision Tree (Ke et al., 2017). One of its strengths is that it can constrain the computation cost by splitting the features into classes and making them histograms, thus preventing complicated branching. LightGBM showed excellent performance in network intrusion prediction. For example, Tang et al. (2020) showed that LightGBM outperformed Decision Tree, Random Forest, KNN, GBDT, XGBoost, and deep learning methods such as variational autoencoder and denoising autoencoder. Jin et al. (2020) reported that LightGBM outperformed Random Forest and XGBoost in ROC-AUC score and True Positive rate. Liu et al. (2021) applied LightGBM to network intrusion detection by resampling the dataset using SMOTE and ADASYN (Adaptive Synthetic Oversampling). Their results showed that LightGBM achieved a higher accuracy score than Decision Tree, Logistic Regression, Naïve Bayes, KNN, SVM, Random Forest, Artificial Neural Network, GBDT, and Adaboost. Their findings also showed that resampling by SMOTE and ADASYN improved the performance of LightGBM.
CatBoost is a newer boosting algorithm than XGBoost and LightGBM. It is also a GBDT-based algorithm and can be used for both classification and regression (Dorogush et al., 2018). One of its strengths is its superiority in handling categorical features (Hancock & Khoshgoftaar, 2020). Recent studies showed the superior performance of CatBoost in binary classification problems. For instance, Hussain et al. (2021) applied CatBoost to detect non-technical losses in power systems caused by power theft. They applied classification algorithms to the imbalanced dataset resampled by SMOTE Tomek Links. Their results showed that CatBoost outperformed XGBoost, Extra Trees, Random Forest, LightGBM, and AdaBoost in all the performance metrics they used: Accuracy, Recall, Precision, F1-score, Kappa, and Matthews Correlation Coefficient. Jabeur et al. (2021) used CatBoost to predict corporate failure and found that CatBoost achieved higher accuracy and ROC-AUC scores than Discriminant Analysis, Logistic Regression, SVM, Artificial Neural Network, Random Forest, Gradient Boosting, Deep Neural Network (DNN), and XGBoost.
As reviewed, previous studies showed the superior classification performance of LightGBM and CatBoost compared to traditional machine learning algorithms and deep learning models. Moreover, although the clear winner is not clear (Anghel et al., 2018), the performance of LightGBM and CatBoost often exceeded that of XGBoost. However, with some exceptions (Gregory, 2018; Lalwani et al., 2021), only a few research applied LightGBM and CatBoost to customer churn prediction. Furthermore, only a few research applied LightGBM or CatBoost combined with hybrid resampling methods like SMOTE Tomek Links and SMOTE-ENN.
Imbalanced Classification
An imbalanced data is a dataset with one or more classes with very low proportions in the training data compared to the other classes (Kuhn & Johnson, 2013). A majority class refers to the prevalent class, and the minority class refers to the rare class (Yijing et al., 2016). Imbalanced classification is classification modelling using an imbalanced dataset. In an imbalanced classification, the classification model tends to put less importance on the minority classes. Thus, it is likely to misclassify the minority class samples more often than those of majority classes (Sun et al., 2009).
López et al. (2013) argued that most traditional classification algorithms classify the majority cases correctly but misclassify many minority ones. This problem occurs for the following reasons. First, the accuracy score tends to be high when the model classifies the majority class correctly, even when it misclassifies a large proportion of the minority class cases. Second, the model is likely to discard the minority class samples since its coverage of the minority class is very low. Third, the model can misidentify the minority cases as noise and mistakenly discard them (López et al., 2013). Therefore, a high imbalance can be a serious problem when the prediction aims to detect rare but important cases.
Imbalanced classification problems prevail widely in real-world domains such as credit card fraud detection, medical diagnosis, network intrusion detection, and protein sub-cellular prediction in Bioinformatics (Kaur et al., 2019). In often cases, telecom customer churn prediction is also an imbalanced classification problem. In a typical case, churners are quite or relatively rare compared to non-churners (Ahmad et al., 2019; Eria & Marikannan, 2018).
As a measure to deal with class imbalance problems, four approaches have been proposed: i) Data level approaches, ii) Algorithm level approaches, iii) Cost-sensitive learning approaches, iv) Classifier ensemble techniques (Galar et al., 2011; Salunkhe & Mali, 2018). Data level approaches apply re-sampling techniques to rebalance the class distribution in the training data. Specifically, data level approaches add the minority cases or remove the majority cases to balance class distribution. Algorithm level approaches create or modify the existing classification algorithms to consider the significance of the minority class cases. A common method of this approach assigns different misclassification costs to misclassified cases (Singh & Purohit, 2015).
Cost-sensitive learning approaches assign different costs to each misclassification in the training process, assuming that misclassification cost can vary depending on the cases (Fernández et al., 2018). For instance, when new customer acquisition is more costly than customer retention, a greater cost will be assigned to a false negative case than a false positive case. Researchers have applied cost-sensitive approaches using various classification algorithms such as Logistic Regression (Shen et al., 2020), KNN (Zhang, 2020), and Decision Tree (Jabeur et al., 2020).
Classifier ensemble techniques construct ensemble classifiers to make the final decision (Cao et al., 2014b; Park & Ghosh, 2012). For example, Salunkhe and Mali (2016) construct ensembles classifiers using different training datasets and classifier models. Researchers also combined the data-level approach and classifier ensemble techniques. For instance, Schaefer et al. (2014) combined the oversampling by SMOTE algorithm and the classifier ensembles like Bagging.
Data level approaches are the most common in customer churn predictions (Aditsania & Saonard, 2017; Safitri & Muslim, 2020; Singh et al., 2018) because of their easy implementation and less computational time (Salunkhe & Mali, 2018). Cost-sensitive approaches are also computationally efficient, but they require prior knowledge about the misclassification cost for each case, which is often unavailable. Therefore, this study uses data level approaches to address the class imbalance.
Data Level Approach in Resampling
The popular methods of data level approaches are undersampling and oversampling. Undersampling lowers the class imbalance ratio by eliminating majority class cases (Liu et al., 2008). The most popular undersampling method is random undersampling, which rebalances the dataset by randomly removing majority class cases (Haixiang et al., 2017). However, since undersampling could lose vital information of the majority class (Gui, 2017), it can result in low prediction performance (Chawla, 2009; Yang et al., 2018). Thus, oversampling is a better way to deal with imbalanced classification problems when using a small or medium-sized dataset.
Oversampling lowers the class imbalance by duplicating the samples of the minority class. Although oversampling sacrifices the learning efficiency by enlarging the training dataset, it can retain all the existing training samples (Cao et al., 2014a). Random oversampling and SMOTE are popular oversampling methods. Random oversampling selects the minority class cases randomly and duplicates them to balance the class distribution. It is simple but cannot provide additional information and tends to cause overfitting since the classification model will use the same cases repeatedly in training (Douzas et al., 2018).
SMOTE can overcome the weaknesses of random oversampling. In SMOTE, class imbalance is rectified by adding synthetic samples to the minority class instead of simply duplicating the data points (Chawla et al., 2002). Several studies showed the improvement in classification performance in imbalanced data owing to the resampling by SMOTE. Zhang and Chen (2021) developed default prediction models using 6,731 corporate bond issuers data with only 50 default cases. They applied Logistic Regression, SVM, KNN, Decision Tree, Random Forest, and XGBoost, to the imbalanced dataset and the dataset rebalanced by SMOTE. According to their results, all classification algorithms achieved higher ROU-AUC scores when applied to the rebalanced dataset than the imbalanced dataset (Zhang & Chen, 2021).
Recent studies on customer churn prediction applied SMOTE to imbalanced datasets. For instance, Gui (2017) constructed churn prediction models using Random Forest with various resampling methods. The result showed that while SMOTE and random oversampling improved the Random Forest’s accuracy score, random undersampling worsened the accuracy. Sharma et al. (2020) applied SMOTE with various classification algorithms: Logistic Regression, SVM, Decision Tree, Random Forest, and XGBoost. Their results showed that all algorithms other than Decision Tree achieved higher ROC-AUC scores for the dataset balanced by SMOTE than the imbalanced dataset. In their analysis, the most successful model was XGBoost combined with SMOTE.
Although SMOTE can alleviate the random sampling’s problem of overfitting, it can generate overfitted models when majority class instances invade the minority class space, or the oversampled minority class invade the majority class space. Therefore, hybrid approaches were proposed as novel resampling methods to avoid overfitting (Salunkhe & Mali, 2018). Hybrid approaches are the combination of oversampling and undersampling. Popular methods of hybrid approaches are SMOTE-Tomek Links and SMOTE-ENN. They achieved the best predictive performance for highly imbalanced datasets (Batista et al., 2004).
Both SMOTE Tomek-Links and SMOTE-ENN have been applied various classification problems such as bankruptcy prediction (Le et al., 2018), self-care problems identification of children with disabilities (Le & Baik, 2019), and also customer churn prediction (Zhu et al., 2017). Zhu et al. (2017) resampled the customer datasets by SMOTE, SMOTE Tomek-Links and SMOTE-ENN. Their result showed that the ROC-AUC score of Decision Tree is higher when combined with SMOTE-ENN than SMOTE but lower when combined with SMOTE Tomek-Links. Their study also showed that both SMOTE Tomek-Links and SMOTE-ENN enhance the ROC-AUC score of SVM compared to the model trained by the imbalanced dataset.
As reviewed above, it is possible that in customer churn predictions, novel Boosting algorithms like XGBoost, LightGBM, and Catboost outperforms traditional classifiers and other ensemble methods. Also, hybrid resampling methods may improve prediction performance. However, only a few studies applied hybrid approaches to customer churn prediction (Anil Kumar & Ravi, 2008; Mishra, 2017). Besides, XGBoost, LightGBM, and Catboost have not yet been used for customer churn prediction in combination with hybrid approaches. Therefore, this study applies those Boosting classifiers to customer churn with major hybrid approaches, SMOTE Tomek Link and SMOTE-ENN.
Research Methodology
This study will develop classification models for customer churn prediction as a binary classification problem. In addition to traditional classification algorithms, novel ensemble methods will be used. Since the dataset is imbalanced, this study uses resampling methods to rebalance the dataset. The novelty of this study is the combined use of ensemble classification methods and hybrid resampling. The baseline models will use the imbalanced dataset as well as the dataset rebalanced by a popular oversampling method, SMOTE. A machine learning project usually go through five phases: data collection, data preprocessing, model development, model evaluation, and model deployment. This study covers the first four phases that will be implemented by Python.
Dataset
The dataset used in this study is commonly called the IBM dataset, that is an open-source customer churn dataset in the telecommunication industry. It was initially published in the IBM Community and now available on Kaggle website (https://www.kaggle.com/blastchar/telco-customer-churn). Recent studies that used the IBM dataset include Lalwani et al. (2021) and Pamina et al. (2019). The raw data contains 7,043 cases (customers) and 21 variables. The dataset includes data of each customer’s demography, the environments of internet connection and related support, contract terms, environment, billing and payment methods, the amount charged. The variables included in this raw data are listed in Table 1.
| Table 1 Variables in the Dataset | |
| Variable Name | Definition |
| customerID | Customer ID |
| Gender | Whether the customer is a male or a female |
| SeniorCitizen | Whether the customer is a senior citizen or not (1, 0) |
| Partner | Whether the customer has a partner or not (Yes, No) |
| Dependents | Whether the customer has dependents or not (Yes, No) |
| Tenure | Number of months the customer has stayed with the company |
| PhoneService | Whether the customer has a phone service or not (Yes, No) |
| MultipleLines | Whether the customer has multiple lines or not (Yes, No, No phone service) |
| InternetService | Customer’s internet service provider (DSL, Fiber optic, No) |
| OnlineSecurity | Whether the customer has online security or not (Yes, No, No internet service) |
| OnlineBackup | Whether the customer has online backup or not (Yes, No, No internet service) |
| DeviceProtection | Whether the customer has device protection or not (Yes, No, No internet service) |
| TechSupport | Whether the customer has tech support or not (Yes, No, No internet service) |
| StreamingTV | Whether the customer has streaming TV or not (Yes, No, No internet service) |
| StreamingMovies | Whether the customer has streaming movies or not (Yes, No, No internet service) |
| Contract | The contract term of the customer (Month-to-month, One year, Two year) |
| PaperlessBilling | Whether the customer has paperless billing or not (Yes, No) |
| PaymentMethod | The customer’s payment method (Electronic check, Mailed check, Bank transfer (automatic), Credit card (automatic)) |
| MonthlyCharges | The amount charged to the customer monthly |
| TotalCharges | The total amount charged to the customer |
| Churn | Whether the customer churned or not (Yes or No) |
The variable named “Churn” is binary (Yes or No), and it will be used as the label in the following analysis. It contains 1,869 churners and 5,174 non-churners. The percentage of churners is 26.53%, and thus, the dataset can be regarded as an imbalanced dataset. There are no variables in the dataset contain nulls. Thus, we do not need to take any measures to handle missing values. Out of the 21 variables, “SeniorCitizen” and “tenure” are integer type data, and “MonthlyCharges” is float type. The remaining 18 variables are object type data.
Data Preprocessing
Since the objective of this study is to develop models with high prediction performance, rather than reveal the causal relationship between predictors and outcome, the analysis will include all these variables. However, variables with no useful information for prediction will be dropped to improve the model parsimony. By definition, the variable “customer ID” represents each customer’s identification number. Thus, it will not relate to whether each customer churned or not churned. Therefore, it was removed from the dataset.
Next, object type variables need to be converted to integer or float variables so that machine learning algorithms can handle them. The variable named “gender” represents each customer’s gender by the labels of “Male” and “Female.” It should be converted to a binary numerical variable by assigning 1 to “Male” and 0 to “Female.” The binary categorical variables named “Partner”, “Dependents”, “PhoneService”, “PaperlessBilling”, and “Churn” are stored as object type variables since the values are input as “Yes” or “No.” Thus, they were converted to binary numerical variables by assigning 1 to “Yes” and 0 to “No.”
The variable named “MultipleLines” is stored as being object type and has three unique values: “Yes”, “No”, and “No phone service.” Since, here “No phone service” has the same meaning as “No”, it should be lumped with “No.” Thus, the variable was converted into a binary variable encoded by assigning 1 to “Yes”, and 0 to “No.” Similarly, some variables have three unique values of “Yes”, “No”, and “No internet service.” They are “OnlineSecurity”, “OnlineBackup”, “DeviceProtection”, “TechSupport”, “StreamingTV”, “StreamingMovies.” Since “No internet service” can be equated with “No,”, it should be lumped with “No.” Thus, the variable was converted into a binary variable encoded by assigning 1 to “Yes,” and 0 to “No.”
The dataset contains categorical variables that contain more than three labels. They are “InternetService”, “Contract”, and “PaymentMethod.” Using pandas get_dummies method, they will be converted to dummy variables that take values of 0 or 1 to indicate the absence or presence of a category. “InternetService” contains three unique values: “DSL”, “Fiber optic”, and “No.” Thus, using “DSL” as the reference category, two dummy variables were created. “Contract” contains three unique values: “Month-to-month”, “One year”, and “Two year.” Hence, using “Month-to-month” as the reference category, two dummy variables were created. “PaymentMethod” has four unique values: “Bank transfer (automatic)”, “Credit card (automatic)”, “Electronic check”, “Mailed check.” Using “Bank transfer (automatic)” as the reference category, three dummy variables were created.
Although the variable named “TotalCharges” is an object type data, it should be numerical because, by definition, it represents the total amount charged to the customer. Hence, it needs to be converted into float type. However, the Python data conversion method astype(‘float’) returned an error, failing to convert the variable. By scrutinizing the values included in the variable, it was revealed that the variable contains 11 cases that were input as a space enclosed in quotation marks. Since there are no effective ways to interpret its meaning, and 11 is not a large number compared to the total number of cases, these 11 cases were deleted. After implementing these preprocessing procedures, the dataset consists of 7,032 cases and 24 variables, including the label variable.
Data Partitioning
In this study, customer churn prediction is formulated as a classification problem that should be addressed by supervised learning. Since the dataset contains both predictors and labels, it was split into predictor dataset (called X) and label dataset (called y). The splitting enables machine learning algorithms to predict the label using the predictors. The trained models need to be tested by unseen data to evaluate its generalizability and compare the performance between the classification algorithms. Thus, certain amounts of cases need to be set aside as unseen data for testing.
This study adopts k-fold cross-validation as a robust method to compare the model performance and evaluate the generalizability of the models. Here, the number of k was set to 5. Thus, the dataset was split into five groups, and 80% of the cases were used for training in each group. Each model was trained and tested five times. Then, each performance metric will be calculated as the average of the five folds. In imbalanced classification problems, ordinary k-fold cross validation contains a problem of unequal distribution of positive cases. Specifically, the proportions of positive cases can be unequal among each fold. Since this study uses an imbalanced dataset, it adopts stratified k-fold cross-validation instead of ordinary k-fold cross-validation. In stratified K-fold cross-validation, the data splitting is implemented so that the proportions of positive cases are equal among the k folds. This study uses scikit-learn’s StratifiedKfold method to implement stratified k-fold cross-validation. For the reproducibility of the data splitting, the random_state argument was set to 101 in the setting of stratified k-fold splitting.
Many of the classification algorithms used in this study are not susceptible to feature scaling. However, linear SVM is sensitive to feature scaling. Hence, standardization was applied to the training set for feature scaling to develop and evaluate each model under the same condition. Besides, oversampling in SMOTE is implemented using KNN, which is sensitive to feature scaling.
Thus, some of the features should be standardized. In the dataset, features other than “tenure”, “MonthlyCharges”, and “TotalCharges” are binary variables consisting of 0 and 1. These binary variables do not need to be standardized. The other three variables were standardized using Python’s StandardScaler method. This operation was implemented before resampling because resampling methods used KNN for oversampling, and therefore, scale differences can bias the distribution of synthesized data.
Resampling Method
As resampling methods, this study will use SMOTE, SMOTE Tomek-Links, and SMOTE-ENN. SMOTE is the most popular oversampling methods and has been shown as effective in imbalanced classifications. SMOTE Tomek-Links and SMOTE-ENN are the major resampling methods that combine oversampling and undersampling.
SMOTE is the simplest way to rebalance an imbalanced dataset is random oversampling that duplicates the existing minority class samples. However, it does not provide additional information to the classification model and can result in overfitting. SMOTE was proposed to overcome the weakness of random oversampling (Chawla et al., 2002). It oversamples the minority class in the following steps. First, choose a case of the minority class randomly. Second, identify k nearest neighbors of the case. Next, randomly select one of the neighbors. Then, create a synthetic sample at a randomly selected point between the two cases. The following equation expresses the synthesized sample C.
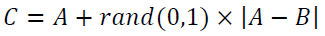
A represents a minority class sample, and B is one of its K nearest neighbors. The rand (0, 1) represents a random number between 0 and 1, and |A-B| is the Euclidean distance between A and B.
A weakness of SMOTE is that the interpolated minority class cases can invade the majority class space too much, resulting in the problem of overfitting. Hybrid resampling methods can alleviate this problem. SMOTE Tomek Links is a hybrid resampling method developed by Batista et al. (2003). It combines SMOTE with Tomek Links. Tomek Links is the distance between two examples from different classes, Ei and Ej, when there is not an example El, such that:

Tomek Links can be used as an undersampling method. It identifies pairs of nearest neighbors from different classes and removes the cases from the majority class. Thus, it removes the majority class cases located around the class boundary. SMOTE Tomek Links applies SMOTE and Tomek Links in combination by oversampling the minority class using SMOTE first and then undersampling the majority class using Tomek Links. Instead of removing only majority class samples, in SMOTE Tomek Links, samples from both classes are removed to create better-defined class clusters (Batista et al., 2004). Since samples located around the borderline are removed, the boundary between the classes becomes less noisy.
SMOTE-ENN is another hybrid resampling method, which combines SMOTE and ENN (Batista et al., 2004). ENN is the abbreviation of Wilson’s Edited Nearest Neighbor Rule. ENN is not exactly an undersampling method because it removes samples from both majority and minority classes. ENN removes any samples whose class differs from that of at least two of its three nearest neighbors. In SMOTE-ENN, first, SMOTE is applied to the imbalanced dataset, and then ENN applied to the rebalanced dataset. Since ENN tends to remove more samples than the Tomek Links does, SMOTE-ENN tends to be more aggressive in reducing the majority class samples than SMOTE Tomek Links.
Resampling Implementation
The training dataset was resampled in three ways: SMOTE, SMOTE Tomek Links, and SMOTE-ENN. Since this study uses 5-fold cross-validation, the resampling should be applied for each fold. Specifically, only the training set was resampled in each fold, and the validation set was kept as is. To implement this procedure, imbalanced-learn, one of the PyPi’s repositories, was used to create pipelines. From imblearn.pipeline module, Pipeline method was imported and was applied for each resampling method. In the application of resampling methods, random_state was set to 11 to ensure the reproducibility of the result. In addition to the resampled dataset, imbalanced dataset was used for analysis so that analysis using imbalanced dataset can be a baseline to evaluate the performance improvement by resampling.
In this study, 80% of the observations were used for training, and the remaining 20% were used for validation. The result of resampling is shown in Table 2. The number of observations in the training data is 5,625, and 1,495 of them are positive cases. The proportion of positive cases is 26.6%. The application of SMOTE increases the positive cases. The resulting dataset contains 4,130 positive cases and 4,130 negative cases. Thus, the dataset was perfectly balanced. The dataset resampled by SMOTE Tomek-Links consists of 3,968 positive cases and 3,968 negative cases. The class imbalance was perfectly rectified, but the total observation is smaller than the dataset rebalanced by SMOTE because SMOTE Tomek-Links generates synthetic positive case and remove some negative cases. The dataset resampled by SMOTE-ENN consists of 2,976 positive cases and 2,258 negative cases. Thus, the proportion of the positive cases is 56.9%. The class imbalance was not perfectly rectified but was improved compared to the original imbalanced dataset.
| Table 2 The Number of Churn and Not-Churn Cases in Each Dataset | |||
| Not Churn (=0) | Churn (=1) | N | |
| Imbalanced Data | 4310 (73.4%) |
1495 (26.6%) |
5625 |
| SMOTE | 4130 (50.0%) |
4130 (50.0%) |
8260 |
| SMOTE Tomek Links | 3968 (50.0%) |
3968 (50.0%) |
7936 |
| SMOTE-ENN | 2976 (56.9%) |
2258 (43.1%) |
5234 |
Classification Algorithms
As classification algorithms, this study uses Logistic Regression, SVM, Random Forest, XGBoost, LightGBM, and CatBoost. Logistic Regression is the most popular classification algorithm (Eria & Marikannan, 2018; Hashmi et al., 2013), and thus, can be the baseline model. SVM and Random Forest achieved superior performance in previous studies than other traditional methods. XGBoost, LightGBM, and CatBoost combined with hybrid resampling methods are suggested as the novel model. In the following, brief explanations of the three boosting will be provided.
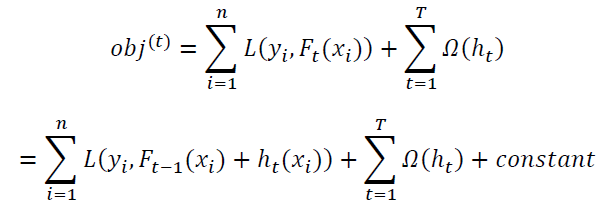
XGBoost, developed by Chen and Guestrin (2016), is a Boosting method that builds weak learners sequentially. When building a weak learner, XGBoost uses the result of the weak learner built in the previous step. XGBoost is a similar but more efficient implementation of GBDT algorithm. GBDT is a combination of Gradient, Boosting, and Decision Tree. As the first step, GBDT uses the mean of the target variable as the initial predicted value and calculate the error. Next, it creates Decision Trees and makes a prediction using ensemble learning. Then, it calculates the error again, and recreates Decision Trees, and implement ensemble learning. By iterating these steps, GBDT makes the final prediction. XGBoost follows a similar process as GBDT. It sequentially grows the Decision Trees and learns from previous iterations. XGBoost is regarded as the improved version of GBDT since it formulates a more regularized model to control overfitting. For regularization, in XGBoost, the objective function contains a regularization term Ω, which reduces the complexity of the Decision Trees.
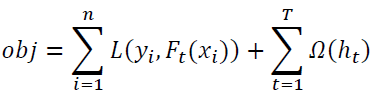
ht: predictions coming from the tth tree.
Besides, XGBoost prevents overfitting by randomly selecting a subset of features and applying shrinkage (i.e., a learning rate). The optimization problem can be fairly complex in XGBoost since it needs to learn ht: a function consisting of Decision Trees’ structure and leaf scores. Moreover, training all Decision Trees at once needs complex computing. Therefore, XGBoost uses the “Additive Training” method that fixes what learned and adds one tree in each iteration.
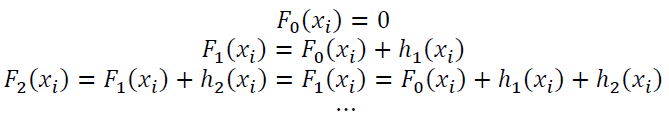
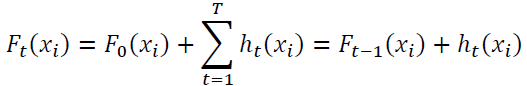
Here, Ft(xi) is the prediction of the ith instance at the tth iteration. The last term, ht, is greedily added and learned to minimize the following objective function.
LightGBM stands for Light Gradient Boosting Machine, developed by Ke et al. (2017). It is proposed as an improvement of XGBoost. Similar to XGBoost, LightGBM is a gradient boosting method based on Decision Tree. One of the distinctive characteristics of LightGBM is that while XGBoost grows the decision tree using all of the previous leaves (i.e., level-wise), LightGBM grows decision trees in a leaf-wise way. By using leaf-wise splits, LightGBM grows the tree on one leaf-side. Compared to level-wise methods, leaf-wise methods tend to make the trees more complicated and thus, can improve the classification performance. Besides, while XGBoost uses pre-sorted GBDT, LightGBM is a histogram-based GBDT. That is, it discretizes the continuous variables by grouping their values as bins. This implementation significantly reduces the computation cost, memory usage, and communication cost for parallel learning, resulting in much shorter training and testing time and enables the model to handle large-scale data (Jin et al., 2020; Liu et al., 2021).
CatBoost stands for Categorical Boosting, a GBDT-based algorithm newer than XGBoost and LightGBM. It was proposed by Dorogush et al. (2018) as an effective algorithm to deal with categorical data. Instead of one-hot encoding, CatBoost uses the expected value of the label data called Target Statistics (Prokhorenkova et al., 2017). If a categorical variable with many classes is labelled as a binary substitution using one-hot encoding, an enormous number of features will be created, and they can be a cause of overfitting. CatBoost deals with this problem by replacing the original category of the label data with Target Statistics. Thus, it converts the label variable into variables that can be used for prediction to keep as much information as possible. In finding the Target Statistics of each category, CatBoost takes a greedy approach to minimize the influence of noise and class imbalance. Moreover, CatBoost uses a method called Ordered Target Statistics for subsampling data to prevent target leakage that causes overfitting. Ordered Target Statistics randomly places arbitrary order to each sample, and the CatBoost model makes the prediction using only the previous data. Mathematically, the process can be expressed by this formula:
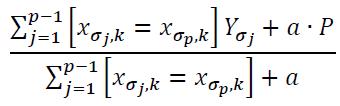
Here, Xi = (xi,1, . . . , xi,m) denotes a vector with m features, and Yi is a categorical label value. The fraction represents a random permutation with σ = (σ1, . . . , σn), where xσp,k is substituted. P is a prior value, and a represents the weight of the prior. They are added to reduce the noise caused by categories with low frequency.
Model Evaluation
This study evaluates the model performance by accuracy, F1-score, and ROC-AUC score. In a binary classification problem, each case will be predicted as “positive” or “negative.” Based on the observed class and predicted class, each case can be classified into four categories.
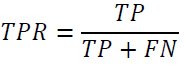
• True Positive (TP): A case that is actually “positive” and predicted as “positive.”
• True Negative (TN): A case that is actually “negative” and predicted as “negative.”
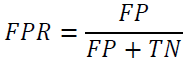
• False Positive (FP): A case that is actually “negative” but predicted as “positive.”
• False Negative (FN): A case that is actually “positive” but predicted as “negative.”
The ratio of TPs to all the positive cases is referred to as True Positive Rate (TPR).
The ratio of FPs to all the negative cases is referred to as True Positive Rate (FR).
Using TP, TN, FP, and FN, the following metrics can be computed to evaluate the classification model performance.
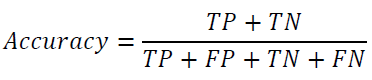
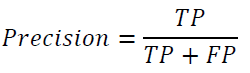
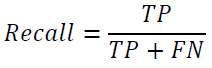
Accuracy is the ratio of the number of correct predictions to that of all predictions made. Precision is the ratio of TP to the predicted positives. Recall is the ratio of correctly predicted positives to all the observed positives.
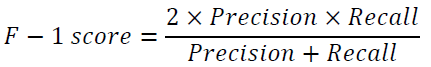
There will be a trade-off between the precision and the recall. F-1 score is a measure that deals with this trade-off, considering both recall and precision and will be high when both the precision and the recall are high.
AUC stands for Area Under the Curve, and the ROC-AUC score represents the area under the ROC curve. ROC curve stands for Receiver Operating Characteristic curve, which plots the TPR for the horizontal axis and FPR for the vertical axis under the various cut-off settings. The classification model performance is regarded as high when TPR is high, and FPR is low. In such a case, the ROC curve approaches the upper left corner, and the AUC gets large. Thus, the greater the AUC value, the classification performance is higher.
Each classification model will be trained and tested by 5-fold cross-validation, and each performance metric will be calculated for the validation set in each fold. Then, cross-validation scores of each metric were calculated by averaging the metric computed for each iteration.
Results
In the following, the classification performance will be displayed using metrics of accuracy, recall, precision, F1-scores, and ROC-AUC scores. These metrics were calculated for each algorithm and each resampling method. Each classification algorithm was applied to the imbalanced dataset also.
Accuracy
Table 3 shows the average accuracy scores of the validations sets calculated for each model. First, let’s compare the scores between classification algorithms. Compared to other classification algorithms, SVM showed the lower accuracy scores for each dataset. Logistic Regression outperformed Random Forest for the imbalanced dataset but showed lower scores for the resampled datasets compared to the four ensemble methods. Among the ensemble methods, Random Forest achieved the highest accuracy for the three resampled datasets. However, for the imbalanced dataset, Random Forest shows the lowest score among the ensemble methods. For the imbalanced dataset, XGBoost shows the highest accuracy (0.807). For resampled datasets, CatBoots showed the highest score (0.771) in SMOTE, and LightGBM achieved the highest score in SMOTE Tomek-Links (0.771) and SMOTE-ENN (0.728).
| Table 3 Accuracy Score | ||||
| Imbalanced | SMOTE | SMOTE Tomek Links | SMOTE-ENN | |
| Logistic Regression | 0.795 | 0.746 | 0.742 | 0.697 |
| SVM | 0.784 | 0.734 | 0.734 | 0.693 |
| Random Forest | 0.791 | 0.775 | 0.768 | 0.731 |
| XGBoost | 0.807 | 0.757 | 0.759 | 0.705 |
| LightGBM | 0.795 | 0.768 | 0.771 | 0.728 |
| CatBoost | 0.798 | 0.771 | 0.766 | 0.723 |
Next, let’s compare the accuracy scores between the imbalanced dataset and the resampled dataset. As shown in Table 4, all the classification algorithms achieved their highest accuracy when applied to the imbalanced dataset. As stated above, XGBoost shows the highest accuracy for the imbalanced data. It means that XGBoost with the imbalanced dataset is the best model in terms of accuracy.
| Table 4 F-1 Score | ||||
| Imbalanced | SMOTE | SMOTE Tomek Links | SMOTE-ENN | |
| Logistic Regression | 0.577 | 0.618 | 0.616 | 0.596 |
| SVM | 0.507 | 0.610 | 0.609 | 0.596 |
| Random Forest | 0.560 | 0.603 | 0.601 | 0.622 |
| XGBoost | 0.595 | 0.629 | 0.634 | 0.608 |
| LightGBM | 0.575 | 0.610 | 0.619 | 0.617 |
| CatBoost | 0.575 | 0.613 | 0.610 | 0.614 |
All the classification algorithms showed their lowest accuracy when applied to the dataset rebalanced by SMOTE-ENN. Logistic Regression, Random Forest, and CatBoost showed higher score when combined with SMOTE than SMOTE Tomek Links. On the other hand, XGBoost and LightGBM achieved higher accuracy when combined with SMOTE Tomek Links than with SMOTE. SVM show no difference between SMOTE and SMOTE Tomek Links.
In sum, ensemble methods generally outperformed the traditional classification algorithms in accuracy scores. However, no classification algorithms were overwhelmingly and consistently superior in accuracy scores. As to the effect of resampling, all the classification algorithms showed higher accuracy scores for the imbalanced dataset than for the resampled datasets, suggesting that resampling methods did not improve the model performance in terms of accuracy. Hence, as to accuracy scores, XGBoost with the imbalanced dataset is the best model here.
In the cross-validation, the resampling methods were applied to the training sets only, and thus, the validation sets are still imbalanced for each fold. Therefore, accuracy scores were computed for the imbalanced validation datasets. Accuracy can be a biased metric in an imbalanced classification problem since a classification model achieves high accuracy by simply assigning the datapoints to the majority class. Accordingly, more balanced metrics should be used to evaluate the model performance in an imbalanced classification problem.
F1-score
Table 4 shows each model’s average F1-scores for validation sets. First, let’s compare the F1-scores of classification algorithms. For the imbalanced dataset, XGBoost achieved the highest score (0.595), and SVM showed the lowest score (0.507). For the imbalanced dataset, Random Forest outperformed SVM but showed lower score than Logistic Regression. For the dataset resampled by SMOTE, XGBoost is the only ensemble method than outperformed the traditional classification algorithms. XGBoost achieved the highest score also for the dataset resampled by SMOTE Tomek Links. As for SMOTE-ENN, Random Forest showed the highest F1-score. For SMOTE-ENN, Boosting methods underperformed Random Forest but outperformed the traditional algorithms. Overall, XGBoost with SMOTE Tomek Links achieved the highest F1-score (0.634).
Next, let’s compare the scores between the imbalanced dataset and the resampled dataset. As shown in Table 5, all classification algorithms achieved higher F1-scores when applied to the resampled dataset than to the imbalanced dataset. Logistic Regression and SVM showed the highest F1-score when combined with SMOTE. XGBoost and LightGBM performed best when combined with SMOTE Tomek Links. Random Forest achieved the highest score with SMOTE-ENN.
| Table 5 ROC-AUC Score | ||||
| Imbalanced | SMOTE | SMOTE Tomek Links | SMOTE-ENN | |
| Logistic Regression | 0.837 | 0.831 | 0.830 | 0.827 |
| SVM | 0.813 | 0.820 | 0.820 | 0.821 |
| Random Forest | 0.827 | 0.826 | 0.826 | 0.834 |
| XGBoost | 0.847 | 0.845 | 0.844 | 0.840 |
| LightGBM | 0.837 | 0.832 | 0.836 | 0.837 |
| CatBoost | 0.842 | 0.834 | 0.833 | 0.839 |
In sum, ensemble methods generally outperformed the traditional classification algorithms in F1-scores. Except for the dataset resampled by SMOTE-ENN, Boosting algorithms achieved a higher F1-score than Random Forest. As to F1-scores, resampling techniques improved the model performance. The highest score was achieved by XGBoost combined with SMOTE Tomek Links. However, the results suggest that hybrid resampling methods are not necessarily superior to oversampling by SMOTE.
ROC-AUC Score
Table 5 shows each model’s average ROU-AUC scores for validation sets. First, let’s compare the performance of classification algorithms. Compared to the other classification algorithms, SVM shows the lowest scores for each dataset. Logistic Regression outperformed Random Forest for the imbalanced dataset, SMOTE and SMOTE Tomek Links. However, when combined with SMOTE-ENN, the ROU-AUC score was lower in Logistic Regression than Random Forest. For all the datasets, Boosting algorithms outperformed the traditional classifiers and Random Forest, and XGBoost showed the highest scores.
Next, let’s compare the scores between the imbalanced dataset and the resampled dataset. As shown in Table 5, Logistic Regression, XGBoost, and CatBoost achieved higher scores for the imbalanced dataset than the resampled dataset. SVM and Random Forest showed their highest scores when combined with SMOTE-ENN. Among all models, XGBoost with the imbalanced data achieved the highest ROU-AUC score (0.847). Next, let’s compare each model’s scores between SMOTE and hybrid resampling methods. Logistic Regression and XGBoost achieved higher scores when combined with SMOTE than with hybrid resampling methods. As for SVM, Random Forest, LightGBM, and CatBoost, the model showed higher scores when combined with SMOTE-ENN than with SMOTE and SMOTE Tomek Links.
In sum, regarding the ROU-AUC score, Boosting algorithms outperformed the traditional classification algorithms and Random Forest. Resampling methods improved ROU-AUC scores only for SVM and Random Forest. SVM and Random Forest achieved their highest score when combined with SMOTE-ENN. For other algorithms, resampling lowered the ROU-AUC scores. Besides, for XGBoost, hybrid resampling methods worked poorer than SMOTE in the improvement of the ROC-AUC score. The highest ROC-AUC score was achieved by XGBoost with imbalanced dataset.
Discussion
This study aims to develop and test novel models to predict customer churn using a telecommunication customer churn dataset. Since acquiring new customers is often more costly than retaining existing ones, customer churn prediction is critical for business organizations, especially for subscription-type businesses like the telecommunication industry. Customer churn prediction has been regarded as a binary classification problem and has drawn much attention in machine learning research. Many previous studies have applied popular classification algorithms such as Logistic Regression, KNN, and Decision Tree (Eria & Marikannan, 2018; Pamina et al., 2019). Although ensemble learning models such as XGBoost, LightGBM, and CatBoost achieved high performance in various classification problems, only a few studies applied them to customer churn prediction.
Recently, several hybrid resampling methods such as SMOTE Tomek Links and SMOTE-ENN were introduced as innovative ways to rectify the class imbalance and thus improve the prediction performance in imbalanced classification problems. Although class imbalance is commonly observed in customer churn datasets, few studies applied hybrid resampling to customer churn prediction. Therefore, this study aims to make unique contributions by combining hybrid resampling methods and ensemble learning algorithms for customer churn prediction and comparing their prediction performance with traditional methods.
This study used a publicly available telecom churn dataset and developed and tested the churn prediction model. As classification algorithms, Logistic Regression, SVM, Random Forest, XGBoost, LightGBM, and CatBoost were used. Each algorithm was applied to four datasets: the imbalanced dataset, one resampled by SMOTE, SMOTE Tomek Links, and SMOTE-ENN. The model performance was evaluated by accuracy, recall, precision, F1-score, and ROC-AUC scores. Not always, but in general, the Boosting algorithms outperformed the traditional classification algorithms and Random Forest. Each of the resampling methods improves the F1-score for all the classification algorithms. For F1-score, XGBoost combined with SMOTE Tomek Links achieved the highest F1-score.
Regarding the ROC-AUC score, Boosting algorithms outperformed the traditional classification algorithms and Random Forest. Resampling methods improved ROU-AUC scores only for SVM and Random Forest. SVM and Random Forest achieved their highest score when combined with SMOTE-ENN. For other algorithms, resampling lowered the ROU-AUC scores. Besides, hybrid resampling methods worked not better than SMOTE in ROC-AUC score. These results suggest that Boosting algorithms performed better than traditional classification algorithms for the ROC-AUC score, but resampling methods did not necessarily improve the model performance.
Contribution
Previous empirical studies on customer churn prediction have two research gaps. First, many of the studies used traditional classification algorithms, but only a few have applied ensemble learning methods that have shown high performance in various classification problems (Pamina eta l., 2019). Second, although recent studies showed the effectiveness of hybrid resampling methods like SMOTE Tomek Links and SMOTE-ENN in improving prediction performance in imbalanced classification like churn prediction, these methods have not yet been applied to customer churn prediction research. This study addressed these research gaps by proposing and developing churn prediction models that combine ensemble classification algorithms and hybrid resampling methods.
The major contribution of this study is to compare the performance of the proposed models with that of the traditional models and showed the superior performance of the proposed model. Specifically, this study revealed the superior performance of the combined use of Boosting algorithms with hybrid resampling methods. This finding can contribute to the research and practice of customer churn prediction in that it provides evidence of the effectiveness of novel methods.
Limitations and Future Research Directions
Despite its novel and unique contribution, this study left issues to be addressed in future research. First, the generalizability of the findings should be tested. Although this study showed the effectiveness of the combined use of Boosting classification algorithms and hybrid resampling methods in customer churn prediction, its analysis was implemented by using only a single dataset. By applying the methods proposed in this study to other datasets, future studies can test the generalizability of the finding of this study.
Second, this study handled the class imbalance only by resampling methods. Future research in customer churn prediction has addressed the class imbalance by using other methods like cost-sensitive classification. Future research can apply cost-sensitive classification using Boosting classification algorithms. Finally, the dataset used in this study does not contain time-series data. Future research can implement time-series analysis by applying Boosting algorithms and resampling methods. Application of reinforcement learning to time-series customer data is also promising.
References
Batista, G. E., Bazzan, A. L. & Monard, M. C. (2003). Balancing Training Data for Automated Annotation of Keywords: a Case Study. WOB, 10-18.
Batista, G. E., Prati , R. C. & Monard, M. C. (2004). A study of the behavior of several methods for balancing machine learning training data. ACM SIGKDD explorations newsletter, 6(1), 20-29.
Bharadwaj, S., Anil, B. S., Pahargarh, A., Pahargarh, A., Gowra, P. S., & Kumar, S. (2018, August). Customer Churn Prediction in Mobile Networks using Logistic Regression and Multilayer Perceptron (MLP). In 2018 Second International Conference on Green Computing and Internet of Things (ICGCIoT) (pp. 436-438). IEEE.
BlastChar (2018). Telco Customer Churn. [Online] Retrieved October 22, 2021 from: https://www.kaggle.com/blastchar/telco-customer-churn
Brânduşoiu, I., Toderean, G. & Beleiu, H. (2016). Methods for churn prediction in the pre-paid mobile telecommunications industry. In 2016 International conference on communications (COMM), 97-100. IEEE.
Chawla, N. V. (2009). Data mining for imbalanced datasets: An overview. In: Data mining and knowledge discovery handbook. Boston, MA: Springer, (pp.875-886).
Chen, T. & Guestrin, C. (2016). Xgboost: A scalable tree boosting system. Proceedings of the 22nd acm sigkdd international conference on knowledge discovery and data mining, 785-794.
Eria, K. & Marikannan, B. P. (2018). Systematic review of customer churn prediction in the telecom sector. Journal of Applied Technology and Innovation, 2(1), 7-14.
Fernández, A., García, S., Galar, M. & Prati, R. C. (2018). Cost-sensitive learning. In: Learning from Imbalanced Data Sets. Cham: Springer, (pp.63-78).
Gaurav Gupta, S. (2019). A Critical Examination of Different Models for Customer Churn Prediction using Data Mining. International Journal of Engineering and Advanced Technology, 6(6S3), 850-854.
Hadi, N. U., Aslam, N. & Gulzar, A. (2019). Sustainable service quality and customer loyalty: the role of customer satisfaction and switching costs in the Pakistan cellphone industry. Sustainability, 11(8), p. 2408.
Haixiang, G., Yijing, L., Shang, J. & Mingyun, G. (2017). Learning from class-imbalanced data: Review of methods and applications. Expert Systems with Applications, 73, 220-239.
Hancock, J. T. & Khoshgoftaar, T. M. (2020). CatBoost for big data: an interdisciplinary review. Journal of Big Data, 7(1), 1-45.
Hashmi, N., Butt, N. A. & Iqbal, M. (2013. Customer churn prediction in telecommunication a decade review and classification. International Journal of Computer Science Issues (IJCSI), 10(5), p. 271.
Huang, G., Wu, L., Ma, X., Zhang, W., Fan, J., Yu, X., ... & Zhou, H. (2019). Evaluation of CatBoost method for prediction of reference evapotranspiration in humid regions. Journal of Hydrology, 574, 1029-1041.
Hussain, S., Mustafa, M. W., Jumani, T. A., Baloch, S. K., Alotaibi, H., Khan, I., & Khan, A. (2021). A novel feature engineered-CatBoost-based supervised machine learning framework for electricity theft detection. Energy Reports, 7, 4425-4436.
Ke, G., Meng, Q., Finley, T., Wang, T., Chen, W., Ma, W., ... & Liu, T. Y. (2017). Lightgbm: A highly efficient gradient boosting decision tree. Advances in neural information processing systems, 30, 3146-3154.
Kopitar, L., Kocbek, P., Cilar, L., Sheikh, A., & Stiglic, G. (2020). Early detection of type 2 diabetes mellitus using machine learning-based prediction models. Scientific reports, 10(1), 1-12.
Kuhn, M. & Johnson, K. (2013. Applied predictive modeling. 26 ed. New York: Springer.
Kumar, S. & Kumar, M. (2019). Predicting Customer Churn Using Artificial Neural Network.. International Conference on Engineering Applications of Neural Networks, May, 299-306.
Lalwani, P., Mishra, M. K., Chadha, J. S., & Sethi, P. (2021). Customer churn prediction system: a machine learning approach. Computing, 1-24.
Lee, E. B., Kim, J. & Lee, S. G. (2017). Predicting customer churn in the mobile industry using data mining technology. Industrial Management and Data Systems, 117(1), 90-109.
Le, T. & Baik, S. W. (2019). A robust framework for self-care problem identification for children with disability. Symmetry, 11(1), p. 89.
Leventhal, B. & Langdell, S. (2013) Adding value to business applications with embedded advanced analytics. Journal of Marketing Analytics, 1(2), 64-70.
Mishra, S. (2017). Handling imbalanced data: SMOTE vs. random undersampling. International Research Journal of Engineering and Technology (IRJET), 4(8), 317-320.
Mozer, M. C., Wolniewicz, R., Grimes, D. B., Johnson, E., & Kaushansky, H. (2000). Predicting subscriber dissatisfaction and improving retention in the wireless telecommunications industry. IEEE Transactions on neural networks, 11(3), 690-696.
Pamina, J., Raja, B., SathyaBama, S., Sruthi, M. S., & VJ, A. (2019). An effective classifier for predicting churn in telecommunication. Journal of Advanced Research in Dynamical & Control Systems, 11, 221-229.
Park, Y. & Ghosh, J. (2012. Ensembles of (α)- Trees for Imbalanced Classification Problems. IEEE Transactions on Knowledge and Data Engineering, 26(1), 131-143.
Patil, A. P. et al. (2017). Customer churn prediction for retail business. 2017 International Conference on Energy, Communication, Data Analytics and Soft Computing (ICECDS). IEEE, August, 845-851.
Salunkhe, U. R. & Mali, S. N. (2016) Classifier ensemble design for imbalanced data classification: a hybrid approach. Procedia Computer Science, 85, 725-732.
Salunkhe, U. R. & Mali, S. N. (2018). A hybrid approach for class imbalance problem in customer churn prediction: A novel extension to under-sampling. International Journal of Intelligent Systems and Applications, 11(5), 71-81.
Schaefer, G., Krawczyk, B., Celebi, M. E. & Iyatomi, H. (2014).An ensemble classification approach for melanoma diagnosis. Memetic Computing, 6(4), 233-240.
Sharma, T., Gupta, P., Nigam, V. & Goel, M. (2020). Customer Churn Prediction in Telecommunications Using Gradient Boosted Trees. International Conference on Innovative Computing and Communications, 235-246.
Sudari, S., Tarofder, A., Khatibi, A. & Tham, J. (2019) Measuring the critical effect of marketing mix on customer loyalty through customer satisfaction in food and beverage products. Management Science Letters, 9(9), 1385-1396.
Tang, C., Luktarhan, N. & Zhao, Y. (2020). An Efficient Intrusion Detection Method Based on LightGBM and Autoencoder. Symmetry, 12(9), 1458.
Verbeke, W., Martens, D., Mues, C. & Baesens, B. (2011). Building comprehensible customer churn prediction models with advanced rule induction techniques. Expert Systems with Applications, 38(3), 2354-2364.
Vijaya, J. & Sivasankar, E. (2018). Computing efficient features using rough set theory combined with ensemble classification techniques to improve the customer churn prediction in telecommunication sector. Computing, 100(8), 839-860.
Yang, Y., Xiao, P., Cheng, Y., Liu, W., & Huang, Z. (2018, January). Ensemble strategy for hard classifying samples in class-imbalanced data set. In 2018 IEEE International Conference on Big Data and Smart Computing (BigComp) (pp. 170-175). IEEE.
Zhang, H., Xu, L., Cheng, X., Chao, K., & Zhao, X. (2018). Analysis and prediction of employee turnover characteristics based on machine learning. In 2018 18th International Symposium on Communications and Information Technologies (ISCIT) (pp. 371-376). IEEE.
Zhang, S. (2020). Cost-sensitive KNN classification. Neurocomputing, 391, 234-242.