Research Article: 2022 Vol: 25 Issue: 3S
Corruption Prevention Factors Based on the Concept of Fraud Hexagon (Case Study of State-Owned Enterprises (SOEs) in Indonesia)
Syarif Usman, Sriwijaya University
Sulastri, Sriwijaya University
Marlina Widiyanti, Sriwijaya University
Yuliani, Sriwijaya University
Citation Information: Usman, S., Sulastri., Widiyanti, M., & Yuliani. (2022). Corruption prevention factors based on the concept of fraud hexagon (case study of state-owned enterprises (SOES) in Indonesia). Journal of Legal, Ethical and Regulatory Issues, 25(S3), 1-18.
Abstract
The research aims to look at the influence of the driving factors of fraud in accordance with the concept of fraud hexagon against the onset of fraud, and corruption as part of fraud, as well as want to see the relationship of fraud with corruption. The research was conducted through a survey in the form of questions related to the 6 (six) driving factors of fraud, namely stimulus, capability, collusion, opportunity, rationalization and ego and the measure of corruption, namely the value of losses, the number of cases and the duration of detection to employees of State-Owned Enterprises and SOE subsidiaries. Analysis of survey data of research model conducted by Structural Equation Model (SEM) using Analysis of Moment Structure (AMOS) program. From the research obtained that only 4 (four) factors that encourage the onset of fraud carried out by a person, namely stimulus, capability, opportunity and rationalization, while 2 (two) factors that are collusion and ego does not affect and encourage the onset of fraud carried out by a person. The most dominant factor and very large influence in encouraging the onset of fraud is the opportunity factor. By knowing the dominant factors affecting fraud will facilitate and focus the prevention of fraud, so as to prevent corruption.
Keywords
Fraud, Corruption, Driving Factors for Fraud, Opportunity.
Introduction
In the last week of November and the first week of December 2020 or in less than 2 (two) weeks, the Corruption Eradication Commission (KPK) has conducted a Hand Capture Operation (OTT) and appointed 2 (two) Ministers in the Jokowi Government Cabinet, namely the Minister of Marine Affairs and Fisheries (EP) as suspects of corruption in lobster seed exports, and the Minister of Social Affairs (JPB) as suspects of corruption of the COVID19 food aid package. The Hand-Caught Opera (OTT) and the determination of suspects were also made against several officials and associates in both Ministries, which were also equipped with the confiscation of documents and evidence, including money in suitcases amounting to tens of billions of rupiah.
When looking at the two suspects who served as Ministers, where the selection and appointment of a minister by the President based on strong reasons and considerations, supported by the background, education and experience of the Minister before, with a good track record and do not commit irregularities or violations of the law, especially related to integrity and behavior. In addition, when looking at the existing Ministers, who are currently in office, in general economically are not lacking and are people who have quite a lot of wealth even sometimes the background of a businessman, and the facilities provided as Ministers are sufficient. Therefore, it becomes a big question mark, if the Minister is still committing corruption, whose main purpose is to enrich himself and not be satisfied with the amount of wealth he already has, in addition to enriching others and his group.
Corruption is an extra ordinary crime or criminal crime whose impact and consequences and losses are very large for a nation, state and society, so to prevent and deal with it must also be done in a special or extra way, so the Government of Indonesia is required to form an Ad Hoc Committee as a follow-up to the mandate of the 1945 Constitution, known as the Corruption Eradication Committee (KPK). The establishment of KPK is carried out, because existing institutions and institutions, in charge and responsible for handling corruption, namely the Police and Prosecutors, have not been effective enough in efforts to eradicate corruption, including prevention.
Corruption in Indonesia is massive, systemic, congregational, and even cultural. This has been exemplified as told in the first alinia above, including in State-Owned Enterprises. It is said to be cultivating, can be seen from the habit of giving gifts especially at certain events and or activities, such as on Eid al-Fitr and Christmas. The gift or gratuity is the forerunner to corruption, because the giver performs the gift without being asked by the recipient and the recipient of the gift receives without asking or forcing the giver. Corruption is also part or one of the forms of fraud that impacts and consequently is very detrimental.
Literature Review
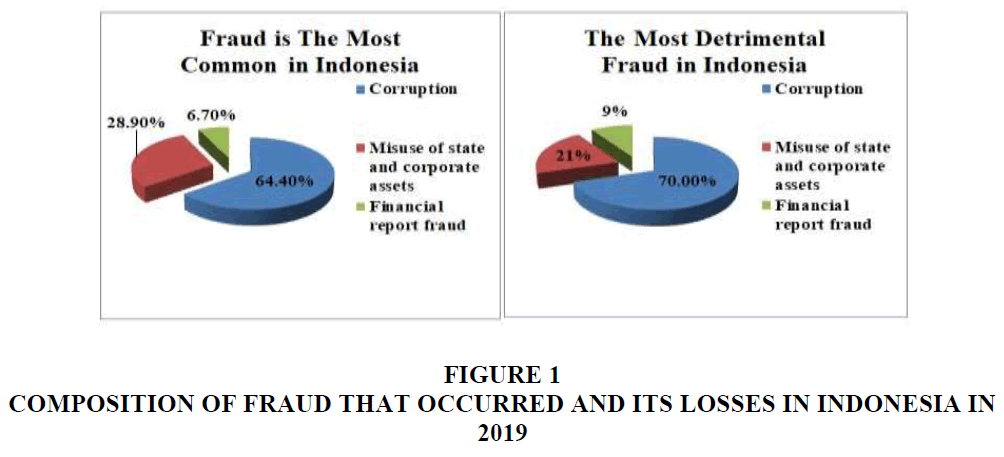
Fraud is defined as fraudulent acts that result in benefits, obtained from a person by providing false evidence or objects. Fraud is defined as abuse of office for personal gain through misuse of organizational resources or assets. Corruption is one of the best known forms of fraud, apart from misuse or theft of assets and false or false statements, such as manipulation in financial statements or better known as window dressing. The most frequent fraud and the biggest loss in Indonesia is corruption, and has a loss of between 100 to 500 million rupiah (described in the pie chart below), but corruption crimes can be detected in less than 12 (twelve) months.
Corruption is the most difficult form of fraud to detect because it concerns cooperation with other parties such as bribes and gratuities, where this is the most common type in developing countries whose law enforcement is weak and still lacks awareness of good governance so that the integrity factor is still questioned (Dye, 2007). This type of fraud often cannot be detected because the parties who work together enjoy the benefits. These include abuse of authority and conflicts of interest, bribery, unauthorized receipts, and economic extortion Figure 1.
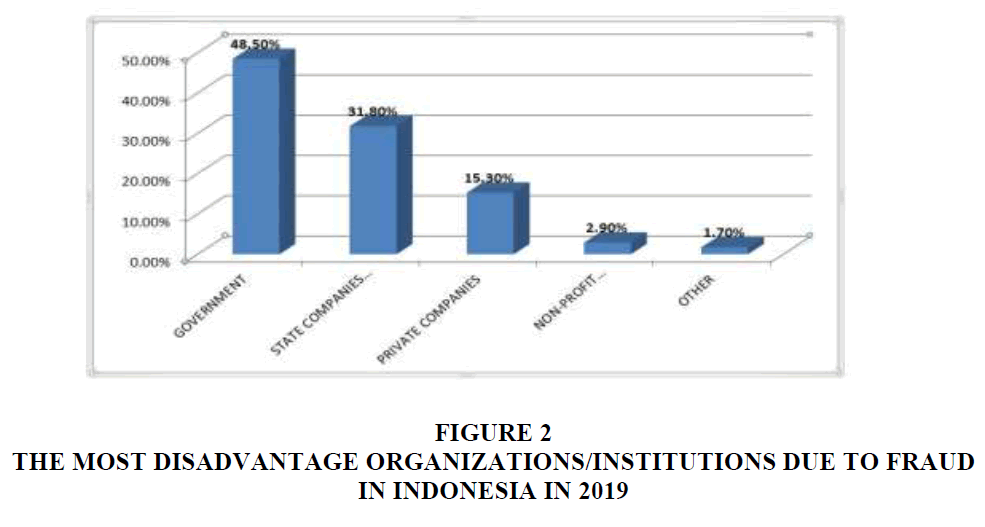
Fraud is a deliberate act by one or more individuals in management or a party responsible for governance, employees, and third parties involving the use of a ruse to obtain one advantage unfairly or unlawfully (Pamungkas, 2018; Albrecht, 2004; Zhu et al., 2017). Fraud is essentially a series of irregularities and unlawful acts committed by outsiders or corporate people in order to profit and harm others (Albrecht, 2008; Rahman & Anwar, 2014; Zhu et al., 2017). Based on the results of a survey by the Association of Certified Fraud Examiners (ACFE) Chapter Indonesia in 2019, state-owned companies are the number 2 (two) organizations that are most harmed by fraud, as shown in Figure 2 below.
Corruption is as old as the historical findings recorded in the ancient Indian treaty arthashastra (280 BC) and is also mentioned as one of the reasons for the fall of the Roman Empire (476 AD). Corruption is a state of spiritual and moral decadentism inherent in the human psyche that often manifests itself externally, by all means an act of moral, unethical, evil, mischievous, evil, and against the law (Asamoah, 2018). Corruption is a conduct that deviates from the official duties of his position in the State, in order to gain the benefit of personal status or money, or violates the rules of conduct concerning personal conduct (Klitgaard, 1998).
Corruption is a subordination of the public interest under personal interests that includes violations of norms, duties and the general welfare, committed with secrecy, treason, fraud, and the consequences suffered by the people (Alatas, 1968). Corruption is an abuse of power and trust for personal interests or non-compliance with the principle of maintaining distance. Corruption is intentionally making mistakes or neglecting tasks known as obligations, or without profits that are of little personal nature (Brooks, 1909).
Corruption is behavior that deviates from formal ethical rules concerning the actions of a person in a position of public authority caused by motives of personal considerations, such as wealth, power and status (Nye, 1967). Corruption is any person who deliberately unlawfully commits an act with the aim of enriching himself or others or something that results in financial loss of the state or the state economy (No.31, 1999).
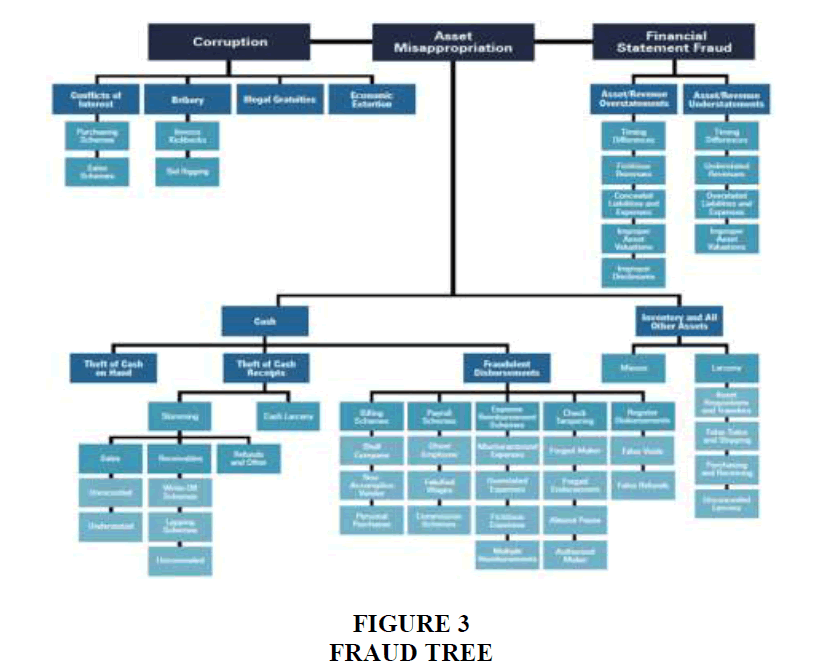
Association of Certified Fraud Examiner (ACFE) developed a fraud category model called the fraud tree, consists of 51 fraud schemes grouped into 3 main categories: (1) fraudulent statements, (2) asset misappropriation, and (3) corruption. This research is focusing more on the third fraud concept that covers a variety of schemes generally involving more than one party, including unwilling parties, as shown in Figure 3. Because corruption is part of fraud, the prevention of corruption can be done by preventing fraud (Djajadikerta & Damajanti, 2019; Peltier-Rivest, 2018).
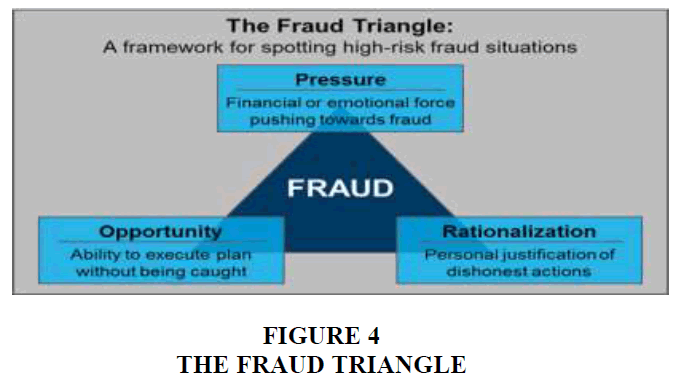
Many ways to prevent fraud, including can also be done by reducing and eliminating or even eliminating the elements or things that are the cause and driver of fraud (Omar et al., 2016). Speaking of the elements that are the cause and driver of fraud, it is known that the triangle theory of fraud has 3 (three) driving elements (Cressey, 1953) as shown in Figure 4, namely:
1. Pressure, namely the incentive / pressure / need to commit fraud. Stress can cover almost anything including lifestyle, economic demands, and others include financial and non-financial matters. There are four types of conditions that commonly occur in pressure that can lead to fraud, namely financial stability, external pressure, personal financial need, and financial targets.
2. Opportunity, which is a situation that opens an opportunity to allow a fraud to occur. It usually occurs due to weak internal control of the company, lack of oversight and abuse of authority. Opportunity is the most likely element to be minimized through the application of processes, procedures, and early detection efforts against fraud.
3. Rationalization (justification of actions), namely the existence of attitudes, characters, or a set of ethical values that allow certain parties to commit acts of fraud, or people who are in a sufficiently pressing environment that makes them rationalize the act of fraud. The most widely used rationalization or attitude is to borrow only the stolen assets and the reason that his actions to make his loved ones happy.
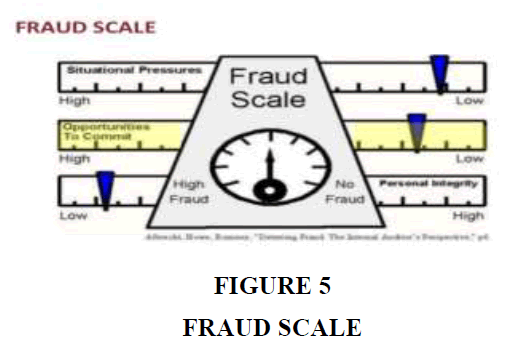
The existence of fraud triangle theory followed by fraud scale theory, which is a followup theory of Fraud Triangle theory which is a measurement of the theory (Albrecht et al., 2008). In the scale explained that the possibility of fraudulent acts can be assessed by evaluating the strength of pressure, opportunity and personal integrity. High pressure, great opportunity and low personal integrity allow for a high risk of fraud. Conversely low pressure, small opportunities, and high personal integrity lead to a low risk of fraud. The purpose of this theory is to measure possible violations of ethics, beliefs and responsibilities. The scale of fraud is shown as shown in Figure 5 below.
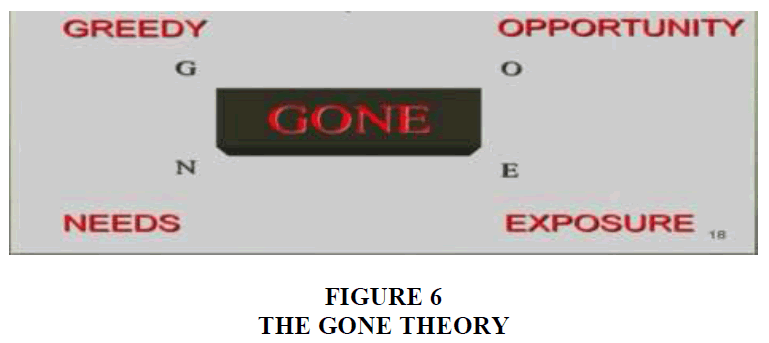
The next development is the GONE Theory (Bologna, 2006), where the driving factor or cause of fraud there are 4 (four), namely: greed (desire to always obtain as much as possible), opportunity, need and disclosure (related to the punishment of fraud perpetrators). The GONE Theory is shown in Figure 6 below.
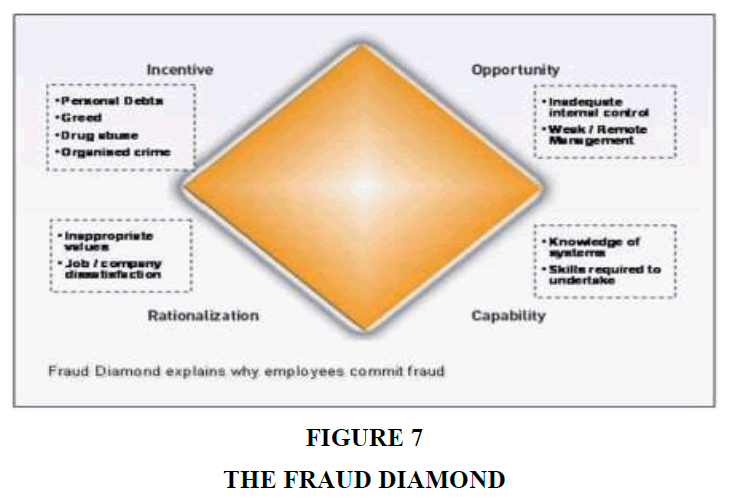
Furthermore, emerged the fraud diamond theory (Hermanson, 2004), where the driving factor of fraud there are 4 (four) namely: opportunity, rationalization, incentives (is an encouragement arising from the demands or pressures faced by a person) and capability (is the nature and personal ability of a person who has a large role that allows to commit an act of fraud). The Fraud Diamond Theory, shown as shown in Figure 7 below.
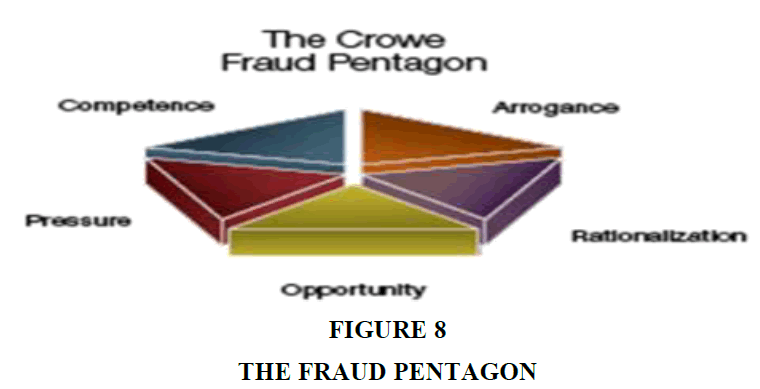
Further development of existing fraud-related theories, making the emergence of the fraud pentagon theory (Crowe, 2011) by changing the risk factor fraud in the form of capability into competence that has the meaning of the same term. In addition, there is an increase in risk factor in the form of arrogance (is the superiority of the rights owned and feel that internal control and company policies do not apply to him). The Fraud Pentagon Theory is shown in Figure 8 below.
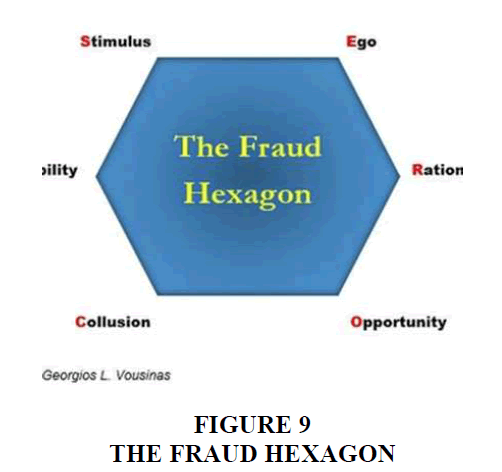
Subsequent improvements to the fraud pentagon theory resulted in the fraud hexagon theory or often referred to as SCCORE (Stimulus, Capability, Collusion, Opportunity, Rationalization and Ego) Model (Vousinas, 2019) which is a development of score (Stimulus, Capability, Opportunity, Rationalization and Ego) model or more familiar with the fraud pentagon theory.
In the concept of hexagon fraud, changes or adjustments are made to the driving factor of arrogance into ego (high accuracy), so that as a driving factor that is more representative with a wider scope when compared to arrogance, while the arrogance in umunya only owned by those who are powerful and have power. In the factors that encourage the occurrence of fraud also increased by the collusion factor, because closeness, friendship, and kinship and the existence of conflicts of interest can also affect and trigger the desire to commit fraudulent acts. The Fraud Hexagon Theory is shown in Figure 9 below.
According to The Great Dictionary of Indonesian Language (KBBI), stimulus is the stimulant of body parts organisms or other receptors to become active. According to Wikipedia, in psychology, stimulus is part of the stimuli response related to behavior, whereas in physiology, stimulus is a known change in the internal or external environment, when stimulis is inserted into sensory receptors, the stimulus will affect reflexes through stimulus transduction. Stimulus or stimulation is a turmoil from inside or outside one's soul that can cause a change in behavior. According to the source of the cause, the stimulus can be grouped into 2 (two), i.e. external stimulus, such as coming from what is seen, read and heard, and deep stimulus in the form of stimuli derived from muscle movements, passions, emotions, and others. Related to corruption, stimulus is a stimulus to get rich, have money and wealth, where with the wealth and money a person will be appreciated and respected in society, can live happily, have a position and rule.
According to The Great Dictionary of Indonesian Language (KBBI), capability has 91 (ninety-one) meanings, but it is concluded, that the meaning of the word capability is skill, the other meaning is science. According KamusBisnis.com, capability is a certain capability or capacity that a business has to achieve certain goals or results. Capability is a measure of an entity's ability (department, organization, and person system) to achieve its goals, especially in relation to the mission as a whole. Related to corruption, capability is the ability, skills, expertise, ingenuity and skill of a person to commit corruption, so that many perpetrators of corruption are people who are highly educated and competent.
According to the Great Dictionary of the Indonesian Language (KBBI), collusion is a secret cooperation for the purpose of not commendable or conspiracy. According to Wikipedia, collusion is a dishonest attitude and act by making a deal in secret in doing an agreement that is coloured by the giving of money or certain facilities (gratuities) as a lubricant so that all its affairs become smooth. In Indonesia, collusion is most common in procurement projects of certain goods and services carried out by the government. Characteristics of this type of collusion are:
1. Giving bribes from certain companies to officials or government employees so that the company can win tenders for the procurement of certain goods and services. Typically, the reward is that the company is reappointed for the next project.
2. Use of brokers (intermediaries) in the procurement of certain goods and services. In fact, it should be implemented through the mechanism of G2G (government to government) or G2P (government to producer), or in other words directly. Brokers here are usually people who have positions or relatives.
So broadly speaking, collusion is a joint agreement to fight the law between state organizers or between organizers and other parties that harm others, society and the state. The way to prevent companies (or countries) from making healthy cooperation agreements with other companies (or countries) that are considered not to harm the public to prevent collusion. The conclusion is that if there is collusion will be followed and ends with corruption.
According to The Great Dictionary of Indonesian Language (KBBI), opportunity is the time (vastness, opportunity, etc.) for, there is time for, there are opportunities for, and aji while. Taking a chance means using opportunities. Related to corruption, then the opportunity is the opportunity or time to commit corruption, where the opportunity sometimes does not appear again or appear a second time, so that the opportunity to get lost profit, wealth, wealth and position.
According to The Great Dictionary of The Indonesian Language (KBBI), rationalization has the meaning of (1) process, rational action (according to ratio) or make the ratio appropriate (good), (2) process, act of making rational, (3) process, rationalization (something that may originally be irrational), (4) improvement in the company by saving labor and costs and increasing production, and (5) improvement of ratio between various components in the company so that the company becomes healthy. In a positive sense, rationalization is to make rational (reasonable) or to make things with reason or to be reasonable, whereas in a negative sense, rationalization is justification based on ulterior motives that are usually selfish, in this negative sense, the reasons given in rationalization in general are incorrect discoveries that are more acceptable to one's ego than the truth itself. Related to corruption, the definition of rationalization is in negative connotations, namely the reasons or actions that are justification for corruption.
According to the Great Dictionary of The Indonesian Language (KBBI), the ego is (1) me; personal self; (2) self-awareness; and (3) the individual's conception of himself. According to Wikipedia, the ego is a psychic structure that relates to the concept of the self, governed by the principles of reality and characterized by the ability to tolerate frustration. The ego is governed by the principle of reality relating to what is practical and possible, as the impetus of id. The ego is bound in a secondary thought process remembering, planning, and weighing situations that allow a compromise between the fantasy of id and the reality of the outside world. The ego lays the ground for the conscious development of self-feeling as a different individual. Understanding the ego is the individual's perception and conception of personality and self-esteem, which can further influence his or her confidence in dealing with the world of reality. "Having an ego" is usually associated with arrogance and is a term used to describe someone who thinks they are better than others. Yet this is only one part of the ego. One example of ego-related is in the game of football. Players who have high egos create gaps in relationships between players, want to win on their own, do not want to lose and themselves are right, others are wrong. When it comes to corruption, egos give rise to self-interest, including enrichment.
The driving factors mentioned above will lead to fraud that is mostly in the form of corruption, beyond financial statements fraud and asset abuse. The amount of corruption according to ACFE is measured in 3 (three) parameters, namely the number or frequency of cases, the value of losses and the period of detection of corruption.
Hypothesis Development
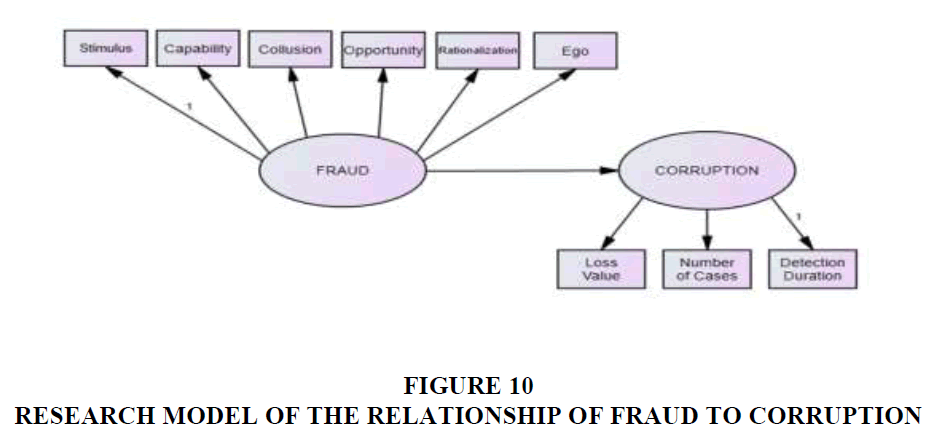
In this study, the theory of fraud taken and became the basis of research in an effort to prevent corruption, is a theory of fraud that has the most driving factors or causes or the last theory of fraud developed by Venusians. Corruption as one of the most detrimental and most common forms of fraud can be prevented by controlling the factors that cause or drive the occurrence of fraud. By using fraud hexagon theory, the causative factors as the driver, are: Stimulus, Capability, Collusion, Opportunity, Rationalization and Ego (SCCORE), is expected to prevent corruption, and in this study used as variable indicators observed and researched.
The research model with the driving factors of fraud that influence the occurrence of corruption is described in Figure 10 below.
In order to prove the role of each of the causative factors that encourage fraud in the form of corruption, the hypothesis is developed as follows:
H1 Fraud is influenced by factors that encourage fraud.
H2 Fraud affects the occurrence of corruption.
H3 Corruption is measured by the value of losses, the number of cases and the duration of detection of corruption.
Research Methodology
In order to test and prove the driving factors of fraud in accordance with the theory of hexagon fraud that can prevent corruption in state-owned enterprises, the analysis is carried out through the Structural Equation Model (SEM) method. Data as sem analysis material obtained from the results of questionnaires of the driving factors of fraud in companies within state-owned enterprises (SOEs) and BUMN subsidiaries submitted through google forms application.
SEM is a statistical method that is currently very popular in management research because of its various advantages. By using SEM, some processes that were exploratory that did not allow the test of zero hypothesis, then with the confirmation technique of SEM it can easily be overcome. The next advantage is the ability of SEM techniques to assess and correct measurement errors that cannot be performed by other procedures (Bagozzi, 1981). Another advantage is the possibility of analyzing models with observed variables and latent variables and their ease in helping researchers perform tiered multivariate analyses simultaneously (Fornell & Larcker, 1981).
A model describes the relationships between variables used in hypotheses, therefore the model can also be seen as a combination of hypotheses used to answer a research problem. SEM is known as a causal model, so the variables covered in the model can be distinguished as causal variables and consequent variables, or as independent variables and dependent variables.
SEM modeling can be done with a two-step modeling approach that is the first to develop a measurement model and the second is the structural causality model. This process is carried out because the measurement model will produce an assessment of convergent validity and discriminant validity while the structural model presents an assessment of predictive validity.
In SEM modeling, the analysis was conducted using AMOS (Analysis of Moment Structure) program, which is one of the new generation and most advanced programs to process multidimensional and tiered research models (Arbuckle, 2016). The data used as inputs in SEM modeling are covariant matrices and correlation matrices of sample data (empirical data). The default of the AMOS program is the covariance matrix, and the covariance matrix of the sample data is used to generate an estimated population covariance matrix.
Sample size plays an important role in the estimation and interpretation of SEM results. The sample size as in other statistical methods produces a basis for estimating sampling errors. In the analysis of SEM model with AMOS program, the appropriate sample size is between 100 - 200 (Hair et al., 2020). When the sample size is too large, for example more than 400, then the method becomes very sensitive, making it difficult to get goodness of fit measures. The minimum sample size is as many as 5 observations for each estimated parameter (Hair et al., 2011). Thus, if the estimated parameter is 20, then the minimum sample number is 100.
Results and Discussion
The data used amounted to 135 samples, while the estimated parameters can be calculated alone or obtained from the calculation of degrees of freedom in the text output as below, then the number of samples needed is 19 x 5=95 samples (Hair et al., 2010). Thus when using a sample of 135, then the assumption of adequacy of the sample is met.
Computation of Degrees of Freedom (Default Model)
1. Number of distinct sample moments: 5
2. Number of distinct parameters to be estimated: 9
3. Degrees of freedom (45-19): 6
Another index that can be used to see sample adequacy is the Hoelter Index on Model Fit in the text output below. A good sample size is when able to produce Hoelter > 200. If not met, as long as Hoelter's Figure is still greater than the number of samples used, then a sample of 135 is enough in drawing conclusions.
Hoelter
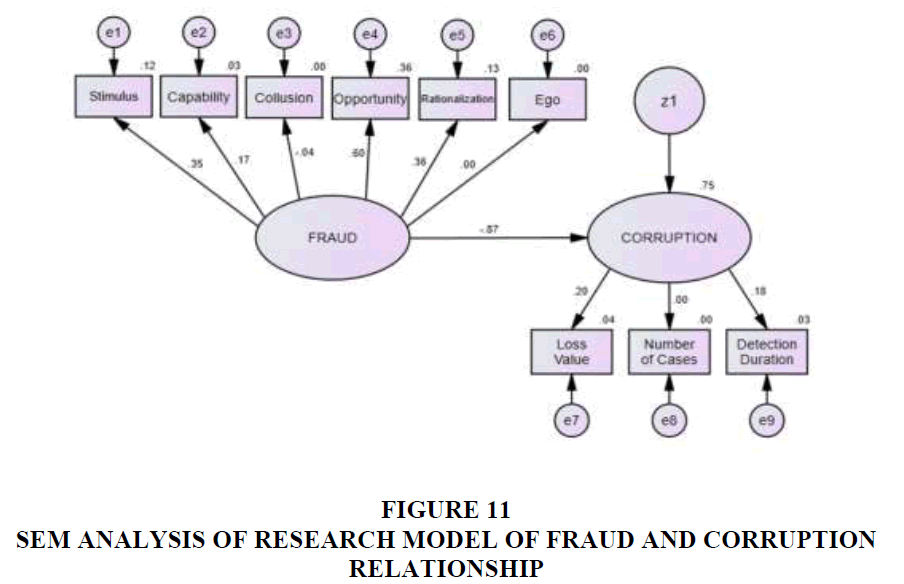
After a total of 135 samples (Table 1) were included as data analyzed in SEM modeling related to the relationship between fraud as an independent latent variable with indicators in the form of fraud driving factors (stimulus, capability, collusion, opportunity, rationalization and ego) as observation variables, and the relationship between fraud as an independent latent variable with corruption as a dependent latent variable, which also has indicators in the form of observation variables namely the value of loss, number of cases and duration of corruption detection, the standard estimation Figures are obtained as shown in Figure 11 below.
| Table 1 Hoelter's Figure Sample | ||
| Model | 0.05 | 0.01 |
| Default model | 285 | 334 |
| Independence model | 184 | 211 |
SEM analysis, especially when estimated using Maximum Likelihood Estimation Technique, requires the assumption of normality. The normality test facility is contained in the AMOS program, so that easily this assumption can be observed, as in Table 2 above.
| Table 2 Assessment of Normality | ||||||
| Variable | Min | Max | Skew | c.r. | Kurtosis | c.r. |
| LV | 4 | 5 | -0.224 | -1.061 | -1.95 | -4.625 |
| NC | 4 | 5 | -0.408 | -1.936 | -1.833 | -4.348 |
| DD | 2 | 3 | -0.015 | -0.07 | -2 | -4.743 |
| EGO | 1 | 5 | -0.122 | -0.579 | 0.051 | 0.122 |
| Rationalization | 1 | 5 | 0.797 | 3.782 | -0.402 | -0.954 |
| Opportunity | 1 | 5 | 0.901 | 4.274 | 0.136 | 0.323 |
| Collusion | 1 | 5 | 0.498 | 2.363 | -1.097 | -2.602 |
| Capability | 1 | 5 | -0.019 | -0.09 | -0.984 | -2.333 |
| Stimulus | 1 | 5 | 0.955 | 4.53 | 1.088 | 2.58 |
| Multivariate | -3.435 | -1.418 | ||||
To test the normality of the data distribution used in the analysis, the easiest is to observe the skewness value of the data used, which is usually presented in descriptive statistics of almost all statistical programs. Statistical values to test this normality are called z-values with the formula:
c.r.=Value–z=Skewness/SQR(6/N)
Where: N=Number or size of sample.
If the z-value is greater than the kris value, it can be expected that the data distribution is abnormal. Suppose the skewness =0.901, then obtained z-value or c.r. =4.274. From the Table 2 above, it can be seen that there is no value number in c.r. column that is greater than ± 4.274 (except NK, DD and STIMULUS which is slightly more/above), so it can be said that there is no evidence that this data distribution is abnormal for 6 other variables.
In SEM analysis there is no single statistical testing tool to measure or test hypotheses about models (Hair et al., 2010; Tabachnick & Fidell, 2012). Generally against various types of fit index used to measure the degree of conformity between the model that is hypothesized with the data presented.
From the analysis of SEM modeling with AMOS program, goodness of fit is obtained as stated in Table 3 below, to ensure and ensure that the research model is suitable and suitable with the desired expectations. From some of the goodness of fit that exist and appear in the text output as desired in the analysis of sem model with AMOS program, then taken some parameters only from all parameters of goodness of fit that are considered important and most relevant.
| Tabel 3 Goodness of Fit | |||
| Goodness of Fit Model Testing | Cut off Value | Results | Conclusion |
| Chi-Square | Low that is, < 66.34 | 18.342 | Significant |
| Significance | ≥0.05 | 0.863 | Significant |
| GFI | ≥0.90 | 0.971 | Significant |
| AGFI | ≥0.90 | 0.951 | Significant |
| CFI | ≥0.90 | 1.000 | Significant |
| TLI | ≥0.90 | 9.181 | Marginal |
| RMSEA | 0.03–0.08 | 0.000 | Marginal |
| Hoelter 5% | ≥200 | 285 | Refers to the estimated number of parameters multiplied by 5 |
Chi-Square is a statistical test of differences. The difference between the population covariance matrix and the sample covariance matrix. In sem hypothesis zero (Ho) to be tested is that the proposed model is the same as the population and different from the usual statistical procedures, to unsuccessfully reject Ho. Chi-square testing is fundamental in measuring the overall fit of the research model and is highly sensitive to the size of the sample used. Therefore, if the number of samples is large enough, greater than 200 samples, then chi square statistics must be accompanied by other test equipment (Hair et al., 2010; Tabachnick & Fidell, 2012). The model tested will be considered good or satisfactory when the chi-square value is low. The smaller the chi square value, the better the model (Ho is accepted) and received based on probabality or significance with a cut-off value of p > 0.05 or p > 0.10. In this research model, chi-square is worth 18,342 which is quite small and probability or significance of 0.863 which is below 0.10, so this study model indicates no significant difference between the matrix of data covariance and the estimated covariance matrix (Hair et al., 2010).
The Goodness of Fit Index (GFI) is a relative measure of the number of variances and covariance in the covariance matrix of sample data described by the population covariance matrix. This fit index calculates the weighted proportion of variances in the sample covariance matrix described by the estimated covariance matrix of the population. GFI is a non-statistical measure that has a range of values between 0 (poor fit) to 1.0 (perfect fit). The high score in this index indicates a "better fit", as in this research model GFI=0.971 which indicates that the research model is good.
Adjusted Goodness of Fit Index (AGFI) is an analogue of R2 in multiple regressions. This fit index can be adjusted to the degree of freedom (DF) available to test whether or not the model is accepted (Arbuckle, 2016). The recommended acceptance rate is when the AGFI has a value equal to or greater than 0.90. Please note that both GFI and AGFI are criteria that take into account the weighted proportions of variances in a sample covariance matrix. A value of 0.971 can be interpreted as a good level or good overall fit model, so this research model is received significantly.
Comparative Fit Index (CFI) is in the range of values of 0 - 1, which is closer to 1, indicating the highest level of conformity or very good fit (Arbuckle, 2016). The recommended value is CFI>0.95. The advantage of the CFI index is that its magnitude is not influenced by sample size, so it is very good to measure the acceptance rate of a model. The CFI index in this research model is 1,000 which indicate that this research model is very well suited and acceptable.
The Tucker Lewis Index (TLI) is an incremental fit index that compares a model tested against a baseline model (Baumgartner & Weijters, 2012). The recommended value for the acceptance of a model is the acceptance >0.95 (Hair et al., 2010), and a value very close to 1 indicates a very good fit (Arbuckle, 2016), so the TLI index value of this research model is 9,181, although it meets the provisions of >0.95 but the value figure is well above 1, thus making this model insignificant according to the TLI index.
The Root Mean Square Error of Approximation (RMSEA) is an index that can be used to compensate chi-square in large samples (Baumgartner & Weijters, 2012). The RMSEA value indicates the expected goodness of fit when the model is estimated in the population. RMSEA value that is less than or equal to 0.08 is an index for acceptable model that shows a close fit of the model based on degree of freedom. RMSEA values are at intervals of 0.08 to 0.10 indicating ordinary conformity and values greater than 0.10 indicate weak suitability (Fabrigar et al., 1999). The AMOS program also tested "the closeness of fit" which is that RMSEA is "good" in the population when the value is <0.05 with the probability of closeness of fit is >0.50.
Looking at Table 4 above, it is concluded that this model produces RMSEA of 0.000 (less than 0.05) with a confidence interval of 90% RMSEA value ranging between 0.000 and 0.037 with a probability of "closeness of fit" of 0.979, so it can be concluded that this model is quite good.
| Table 4 The Closeness of Fit | ||||
| Model | RMSEA | LO 90 | HI 90 | PCLOSE |
| Default model | 0 | 0 | 0.037 | 0.979 |
| Independence model | 0.016 | 0 | 0.064 | 0.838 |
The last statistical test of goodness of fit in AMOS was critical N regarding the size of the required sample called the Hoelter index. This index describes the adequacy level of samples used in the analysis, with the intention to estimate the size of the sample sufficient to produce a fit model sufficient for chi-square test. Critical N is the largest sample size to be able to accept the hypothesis that a model is correct. Although the Hoelter index at a rate of 5% is acceptable with a sample of 285 or at a rate of 1% a sample of 334 is required, the use of more than 200 samples results in the operation of the AMOS program not being able to run, so it is enough to refer to a minimum sample size of 95, in accordance with the estimated number of parameters of 19 times 5.
From the analysis of SEM modeling with AMOS program, hypothetical test results are obtained as listed in Table 5 below.
| Table 5 Model Hypothesis Test (Regression Weights, Estimation, Standard Error and Critical) | ||||||
| Hypothesis | Std. Est. | Est. | S.E. | C.R. | P | Conclusion |
| Fraud ?Korupsi | -0.869 | -0.27 | 0.239 | -1.129 | 0.259 | Not Supporting |
| Fraud ?Stimulus | 0.352 | 1 | Supporting | |||
| Fraud ?Capability | 0.169 | 0.735 | 0.603 | 1.22 | 0.223 | Supporting |
| Fraud ?Collusion | -0.039 | -0.179 | 0.566 | -0.316 | 0.752 | Not Supporting |
| Fraud ?Opportunity | 0.603 | 2.28 | 1.281 | 1.779 | 0.075 | Supporting |
| Fraud ?Rationalization | 0.357 | 1.346 | 0.688 | 1.957 | 0.05 | Supporting |
| Fraud ?Ego | 0.001 | 0.002 | 0.371 | 0.007 | 0.995 | Not Supporting |
| Corruption ?LV | 0.179 | 1 | Supporting | |||
| Corruption ?NC | -0.001 | -0.005 | 0.763 | -0.007 | 0.994 | Not Supporting |
| Corruption ?DD | 0.203 | 1.127 | 1.196 | 0.942 | 0.346 | Supporting |
The relationship or influence of fraud on corruption does not support caused by corruption is one part of fraud, which is indicated from the value of regression weights or standard estimation and unstandardized negative estimation (-0.270 and -0.859), so the H2 hypothesis that fraud affects the occurrence of corruption becomes invalid. Subsequently the relationship of collusion factors as a driving indicator of fraud was declared fall due to unin favour, indicated by the value of regression weights or standard estimation and unstandardized negative estimation (-0.179 and -0.039). Furthermore, ego factor relationship as a driving indicator of fraud also cannot be used because it does not support and has no influence, which is indicated by the value of regression weights or standard estimation and unstandardized estimation close to zero. Indicators of the number of cases in corruption are also not supportive and are not related as causal or causal relationships, indicated by the value of regression weights or standard estimation and unstandardized estimation close to zero and negative.
The H1 hypothesis which states that fraud is encouraged and influenced by 6 (six) factors namely stimulus, capability, collusion, opportunity, rationalization and ego in accordance with the concept of fraud hexagone theory (Vousinas, 2019), according to the results of this study proved only 4 (four) factors that encourage and influence fraud, namely stimulus (stimulus), capability (ability), opportunity (opportunity) and rationalization (justification), while 2 (two) factors again namely collusion (collusion) and ego does not encourage and influence a person to commit fraud. The most encouraging and influencing factor for a person to commit fraud, from the 4 (four) is opportunity.
With the fact that only 4 (four) factors that encourage and influence a person to commit fraud, namely stimulation, ability, opportunity and justification, the prevention of fraud is directed and focused on the 4 (four) factors. More specifically by narrowing down and reducing the opportunities and opportunities of a person to commit fraud. Furthermore, as part of the fraud, the corruption that takes the largest portion or even very large in fraud, is automatically affected which has the impact of experiencing a reduction if the prevention of fraud is carried out.
The H3 hypothesis states that the magnitude of corruption is measured by the value of losses, the number of cases or frequencies, and the duration of detection, it turns out that the number of corruption cases does not affect the magnitude of corruption. This is because the losses resulting from corruption do not depend on the number of cases but are more influenced by the value of losses per case. Although the number of corruption cases is small or not much, but the value of the losses may be greater. Similarly, with the duration of the desection of a corruption, the longer a corruption case is detected and revealed, it seems as if there are fewer and fewer cases of corruption, including the value of the losses.
Conclusion
1. Research in the effort to prevent corruption is directed at efforts to prevent fraud, because corruption is one form of frequent fraud that causes the greatest harm to a company. Fraud is driven by several factors, including the most up to date driven by 6 (six) factors according to the concept of fraud hexagon, namely stimulus, capability, collusion, opportunity, rationalization and ego.
2. From the results of the study there was no relationship or influence of fraud on corruption, because corruption is part and as a form of fraud that is common.
3. From the 6 (six) driving factors of fraud according to the concept of fraud hexagon, only 4 (four) factors are proven to encourage the onset of fraud a person, namely stimulus, capability, opportunity and rationalization, while 2 (two) factors again namely collusion and ego do not encourage the occurrence of fraud. The factor that has the most influence or encouragement for the occurrence of fraud, namely the opportunity factor.
4. The big measure of corruption is the value of losses and the length of time it is revealed an incident of corruption, while the frequency or number of corruption cases is not a measure, because it can be the number of corruption cases but the value of losses is small.
Prevention of corruption is directed and focused on the prevention of fraud by reducing and narrowing the opportunities for fraud or corruption, and also reducing the stimulus, capability and rationalization factors by providing an understanding of the impact or consequences of corruption that is very detrimental to the company.
References
Alatas, S. H. (1968). The sociology of corruption. The nature, function, causes and prevention of corruption. Journal of Southeast Asian Studies.
Indexed at, Google Scholar, Cross Ref
Albrecht, M.J.K.S.A. (2008). Asset misappropriation research white paper for the institute for fraud prevention.
Albrecht, S.E.A. (2004). Fraud and corporate executives: Agency, stewardship and broken trust. Journal of Forensic Accounting, 1524(5586), 109-130.
Albrecht, W.S., Albrecht, C., & Albrecht, C.C. (2008). Current trends in fraud and its detection. Information Security Journal: A Global Perspective, 17(1), 2-12.
Indexed at, Google Scholar, Cross Ref
Arbuckle, J. L. (2016). IBM® SPSS® Amos™ User’s Guide. Chicago, IL: SmallWaters.
Asamoah, G. (2018). Understanding corruption as a human nature problem. Interdisplinary Research Journal of Theology, Apologetics, Natural and Social Sciences, 1(1), 1-2.
Bagozzi, R.P. (1981). Evaluating structural equation models with unobservable variables and measurement error: A comment. Journal of Marketing Research, 18(3), 375-385.
Indexed at, Google Scholar, Cross Ref
Baumgartner, H., & Weijters, B. (2012). Commentary on common method bias in marketing: Causes, mechanisms, and procedural remedies. Journal of Retailing, 88(4), 563-566.
Indexed at, Google Scholar, Cross Ref
Bologna, T.S.A.J. (2006). Fraud auditing and forensic accounting. Hoboken, N.J. Wiley.
Brooks, R.C. (1909). The nature of political corruption. Political Science Quarterly, 24(2), 1-9.
Cressey, D.R. (1953). Other people's money: A study of the social psychology of embezzlement. APA PsycNet.
Indexed at, Google Scholar, Cross Ref
Crowe, H. (2011). Why the fraud triangle is no longer enough. Horwath, Crowe LLP.
Djajadikerta, H., & Damajanti, T. (2019). Fraud and corruption trigger model based on perception of high school students: A preliminary study. Review of Integrative Business and Economics Research, 8(3), 1-9.
Dye, K.M. (2007). Corruption and fraud detection by public sector auditors. Edpacs, 36(5-6), 6-15.
Indexed at, Google Scholar, Cross Ref
Fabrigar, L.R., Wegener, D.T., MacCallum, R.C., & Straha, E.J. (1999). Evaluating the use of exploratory factor analysis in psychological research. Psychological Methods, 4(3), 28-39.
Indexed at, Google Scholar, Cross Ref
Fornell, C., & Larcker, D.F. (1981). Structural equation models with unobservable variables and measurement error: Algebra and statistics. Journal of Marketing Research, 18(3), 382-396.
Indexed at, Google Scholar, Cross Ref
Hair, J.F., Black, W.C., Babin, B.J., & Anderson, R.E. (2010). Multivariate data analysis: A global perspective. Pearson Prentice Hall.
Hair, J.F., Howard, M.C., & Nitzl, C. (2020). Assessing measurement model quality in PLS-SEM using confirmatory composite analysis. Journal of Business Research, 109(1), 101-110.
Indexed at, Google Scholar, Cross Ref
Hair, J.F., Ringle, C.M., & Sarstedt, M. (2011). PLS-SEM: Indeed a silver bullet. The Journal of Marketing Theory and Practice, 19(2), 139-152.
Indexed at, Google Scholar, Cross Ref
Hermanson, D.T.W.A.D.R. (2004). The fraud diamond: Considering the four elements of fraud.
Klitgaard, R. (1998). Strategies against corruption. Spanish Agency for International Cooperation.
Nye, J.S. (1967). Corruption and political development: A cost-benefit analysis. The American Political Science Review, 61(2), 1-9.
Indexed at, Google Scholar, Cross Ref
Omar, M., Nawawi, A., & Puteh Salin, A.S.A. (2016). The causes, impact and prevention of employee fraud. Journal of Financial Crime, 23(4), 1012-1027.
Indexed at, Google Scholar, Cross Ref
Pamungkas, I.D. (2018). Corporate governance mechanisms in preventing accounting fraud: A study of fraud pentagon model. Journal of Applied Economic Sciences, 13(2), 549-560.
Peltier-Rivest, D. (2018). A model for preventing corruption. Journal of Financial Crime, 25(2), 545-561.
Indexed at, Google Scholar, Cross Ref
Rahman, R.A., & Anwar, I.S.K. (2014). Effectiveness of fraud prevention and detection techniques in Malaysian Islamic Banks. Procedia -Social and Behavioural Sciences, 145(1), 97-102.
Indexed at, Google Scholar, Cross Ref
Tabachnick, B.G., & Fidell, L.S. (2012). Using multivariate statistics. New York: Person Publishers.
Vousinas, G.L. (2019). Advancing theory of fraud: The S.C.O.R.E. model. Journal of Financial Crime, 26(1), 372-381.
Indexed at, Google Scholar, Cross Ref
Zhu, X., Tao, H., Wu, Z., Cao, J., Kalish, K., & Kayne, J. (2017). Fraud prevention in online digital advertising. Springer Briefs in Computer Science.
Indexed at, Google Scholar, Cross Ref
Received: 18-Sep-2021, Manuscript No. JLERI-21-8225; Editor assigned: 20-Sep-2021, PreQC No. JLERI-21-8225(PQ); Reviewed: 11-Oct-2021, QC No. JLERI-21-8225; Revised: 14-Jan-2022, Manuscript No. JLERI-21-8225(R); Published: 21-Jan-2022
