Research Article: 2024 Vol: 28 Issue: 5
"Construction SCM Assessment of Brick Vendor by Exploiting Crisp Multi-Objective Optimization Approach: An Empirical Case Study"
Neelkanth Dhone, Indian Institute of Management, Nagpur
Citation Information: Dhone, N. (2024). “Construction scm assessment of brick vendor by exploiting crisp multi-objective optimization approach an empirical case study". Academy of Marketing Studies Journal, 28(5), 1-11.
Abstract
In the Supply Chain (SC) forum, Construction Management (CM) is a sizzling research sphere due to the high turbulent demand of infrastructure entities such as buildings, malls, homes, etc., by clients. The rush of Colonizers is escalated at the marketplace to perform the said infrastructure entities. The colonizers identified brick, sand, and cement as necessities to build malls, modern houses, etc. The bricks are executed in bulk to create any infrastructure entity. It is extracted by the accurate empirical survey of 500 colonizers of Asian continents, especially in India, that colonizers' high earnings and revenues only depend upon materials procurement at feasible cost with other variables (to build practical construction SCM). During a survey of 500 colonizers, it is sound that 60% of colonizers prioritized the qualitative service variables and residue, and 40% were advised to focus on only cost variables for purchasing any construction stuff from alternative vendors. The brick procurement problem identified by the author experienced the lack of a decision support system that can address the qualitative and quantitative variables at a time to aid in buying bricks from alternative vendors. This research gap is accepted as a research objective. It is also observed by a peer-literature survey that there is still no invention of a soft computing technique to tackle the data in the form of % and crisp score vs. qualitative and quantitative variables, respectively, to lead Brick Vendor (BV) evaluation and benchmarking decision in the field of CSCM. This research gap is also respected as a research objective. The authors proposed a DSS consisting of module’ service-based qualitative as well as production cost-related quantitative variables in conjunctive with MOO-RA (Multi-Objective Optimization via Ratio-Analysis) simulation decision technique’ to lead the Brick Vendor (BV) evaluation and benchmarking decision. The objective of the research is to help the colonizers of Asian continents evaluate the optimum BV among feasible BVs. The results are illustrated in the conclusion section.
Keywords
Construction Management (CM), Brick supplier, Qualitative and Quantitative variables, Brick Vendors (BVs), Brick Production Cost Variables.
Introduction
Supply chain management (SCM) is determined to be one of the sizzling segments that can achieve the degree of sustainability of any sector, and it has gained rich signals from worldwide researchers. SCM helps each industry to develop its healthy plans and ensure that the sector achieves sustainability at its current competitive edge. SCM is described as a distribution entity where suppliers, factories, warehouses, distribution centers, retailers, and end users interact for mutual profit and to compensate for the requirements and turbulent demands of the market. Construction Management (CM) works could be better edited in SCM today. Therefore, Construction Supply Chain Management (SCM) has gained high momentum among infrastructure researchers and colonizers.
Colonizers are professional engineers who deal with the designing and construction of the physical built environment or infrastructure entities such as roads, bridges, canals, dams, buildings, bridges, dams, roads, railway siding, inland, bridge tunnels, bridge pillars, viaducts, navigation systems, water tanks, extensive pipe-line reservoir, sewerage, etc. It was found that the rush of colonizers was hiked at the marketplace, which created an environment of competition among them. The colonizer can only retain its business entities in the construction service domain today by executing the sustainable SCM. It is mainly observed that today's homes need customers, and government project agencies provide their priorities to only those colonizers who maintain the best price cum rapid construction service (means CSM sustainability). It can only be done by adapting and applying the philosophies, tools, and decision support systems towards any or three pipes of sustainability: economic, social, and environmental. CM is an approach for aggregate planning, integration, coordination monitoring, and control of a project from inception to completion. CM aims to meet a client's demand to produce feasible, economical, and viable projects. Construction Management (CM) is an art and technique for purchasing stuff at the least cost. CM is defined as organizing, coordinating, and fulfilling the client's orders withinthe scheduled time.
It is perceived that Asian colonizers are highly expert in designing and creating the physical builtenvironment, i.e.,roads, bridges, big dams, and infrastructure of malls and buildings (Roberts & Latorre, 2009; Stapenhurst, 2009) due to the wealthy population in this continent. In today's era, the Asian colonizers primarily focused on the Indian Nation due to its high population and rich business infrastructure entities. In India, colonizers are developing colonies and malls. Bricks are the primary material required to initiate the construction task. The bricks are used in bulk in construction areas by colonizers. The brick procurement is challenging as it concerns the selection and benchmarking of brick Vendors (BV), among others. Recently, in a survey of 500 colonizers in India, it was found that 60% of colonizers prioritized the service variables such as delivery under schedule time vs. orders, green manufacturing, lean production, green transformation, agile service, delivery under disaster/crisis, etc., and residue 40% advised to focus on only costs related variables for purchasing brick from alternative BVs. The authors devised a module of variable-focused brick material supplier qualitative service-based variables with qualitative production cost-related variables in benchmarking brick vendors (BVs). To simulate the module, there is a need to invent a soft computing technique to tackle the vague qualitative (subjective) and crisp (objective)-quantitative data simultaneously to lead Brick Vendor (BV) evaluation and benchmarking decisions in the field of CM. To fulfill both research gaps, the authors decided to proposea DSS consisting of a module’ ‘service-based qualitative as well as quantitative variables’ withMulti-Objective Optimization that can address both ‘vague-qualitative (subjective) and crisp (objective)-quantitative data simultaneously.’ The author conducted post-title literature to shape the research work to fulfill objectives. A few relevantliteraturereviews are articulated briefly, focusing onthe evaluation problems of green and brick suppliers.
The authors expressed that the performance measurement tools and multiple variables make the construction firms' reputation on global platforms excellent (Abdel-Razek, 1997). Applies the green and traditional indices forbenchmarkingthe SCM of construction industries in Singapore (Alarcón et al., 2001). The authors shortlisted the eight significant variables that help construction firms to meet customer satisfaction (Pillai et al., 2002). The authors shortlisted a few variables that caused delaysin the construction work in Nigeria (Aibinu, 2006). It articulates that critical construction operations management is the best tool behind the success of large-scale Thailand construction industries (Ogunlana et al., 2008). The authors determined the pertinent performance evaluation indices with ERP systems for assessing the performances of engineering construction firms (Skibniewski, 2009). The authors applied effectual SCM indices to map construction industry performance in the Kingdom of Saudi Arabia (Hany, 2013). The authors facilitated the UK construction industries with a cultural change idea for reducing the waste to landfill (Ahmad, 2016). Illustrates the applications of multi-level structured models for mapping the performance of construction industries (Ajayi et al., 2016). The authors explained that South African construction professionals need the support of a demand-control-support survey policy (Cattell et al., 2012). Most of the building certification schemes use energy during the refurbishment processes (Kamaruzzaman et al. 2016). Performance is evaluated by assessing the typical industrial SCM systems during different project phases (Vereen et al. 2016). The authors applied the productive metrics to conduct a comparative analysis of the labor of construction industries (Yun, 2016). The authors proposed a DSS for mapping the performance evaluation scores of the clay brick vendor’s companies under green and traditional SCM corresponding to fuzzy and objective data. The authors proposed a concept and understanding of the cultural and social value of stakeholders associated with the construction industry in Ghana. The survey adopted a qualitative technique, which relies on the semi-structured interview of 30 candidates from the Western, South-North, and Federal regions of Ghana City. The study has suggested the imperative awakening as a social value criterion for determining and benchmarking the construction task procurement in Ghana (Gidigah, 2022). The author examined the mediating and moderating effect of PMSE (Project Management Self Efficacy) over the JFC (Job Family Conflict) performance nexus among infrastructure experts for a developing economy. The data for this study was drawn via a cross-sectional empirical questionnaire, which was served to 302 infrastructure consultants in Ghana by executing the convenience sample method. Later, partial-least square structural computational modeling (PLS-CM) was performed to conclude. The evaluated results stated that the mediating–moderating model of WFC intervenes in the negative influence over PMSE (Novieto et al., 2022). The authors analyzed the interaction between the key barriers that influence the success of green highway projects. The interviews of experienced professionals were taken in the study vs. evaluated 33 influencing barriers. The results depicted the incremental cost, development of innovative and radical technologies, poor standards and legislation and stuff, public familiarity, and green environment protection behavior as key interactive barriers that influence the accomplishment of green roadway projects (Ingenbleek et al., 2023).
The authors examined the initiatives to allocate supplier resources to sustainability win customers. A framework is built incorporating a few initiatives. The framework is audited using the moderate regression model on availing information of 102 supplier firms. The findings revealed that a few SCM factors strongly impact the allocation of suppliers’ resources (Ingenbleek & Krampe, 2023). The authors investigated the procurement digitalization tools for reducing the uncertainty associated with the SCM and found how procurement digitalization mitigates the SCM risks and improves SCM resilience (SCMR). The survey data was collected from the 147 Spanish firms and simulated using partial-least squares mathematical modeling. It has been identified that data analytics, procurement process digitalization, and data sharing work as drivers of procurement digitalization and reduce the SCM risk (SCMR) (Harju et al., 2023). The authors proposed the sustainability approach with managerial defies to achieve SCM sustainability via TSC (Transport et al.). An empirical case study of shipping TCS is brought into practice to conclude the results. A few managerial challenges are found and highlighted, which aided the managers in achieving SCM sustainability via TCSs (Forslund et al., 2022). The authors audited the leading role of IoTs-based Supply Chain (IoTs-SC) drivers over Automobile SC Resilience (ASCR) indices for improving the SC performance (SC-Perf.) objectives. The author’s analyzed data collected by authors from the automotive sectors and suggested that automobile companies adopt the DSC drivers and motivate the firms for more SCR indices (Balakrishnan et al., 2012). The authors investigated the barriers and drivers that suppliers must adopt to manage their sub-suppliers. This research adopted a mixed approach, which used the qualitative ideal model, which realized qualitative data come from semi-structured interviews of 24 senior manufacturing professionals. The results showed that sub-vendor compliance is influenced by effective buyer-vendor relationships and by a robust strategic partnership with the vendor and sub-vendors (Venkatesh et al., 2020).The authors developed a multi-level mixed model focused on the alliance between the challenges, confirming the transplant supply chain systems. The eleven most significant variables were recognized by peer literature review, and variables were analyzed by using Delphi-interpretive structural modeling. The findings showed that a lack of information systems and a need for necessary skills are found to be barriers to disrupting the transplant supply chain systems. Entire references helped the authors to finalize the brick service-based qualitative and qualitative production cost variables and built the MOORA approach.
Research FrameworkAfter conducting the research work, the predefined research gaps are fulfilled. The references (Roberts, 2009; Stapenhurst, 2009; Ahmad et al., 2010; Ajayi et al., 2010; Yun, 2016; Novieto, et al., 2022; Huang et al., 2023; Venkatesh et al., 2020; Akenroye et al., 2023) are executed to frame the Decision Support Module (DSM), which consistsof a tied up of quantitative and qualitative service and cost-based variables, respectively, experienced the corresponding (subjective) and (objective) information. Next, to simulate the DSM, a traditional MOO-RA (Multi-Objective Optimization via Ratio Analysis) technique can accept the quantitative and qualitative data in % and crisp value against service and cost-based variables, respectively. Using the MOORA method, various evaluation variables have been summarized to evaluate an overall fuzzy index to aid the brick suppliers’ evaluation and benchmarking problems of the brick suppliers’ alternatives. The DSS is illustrated with a hypothetical BV benchmarking problem to relate DSS to real-life colonizer problems Figures 1,2.

Figure 1 Esearch Framework

Figure 2 Quantitative and Qualitative Variables for BV Decision-Making

Figure 3 The Ranking of BVS by Line Chart
The Ratio System
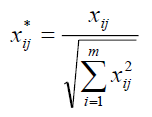
Ratio System analysis described the data evaluation and normalization via comparing the BVs alternatives and all values must come in a range of 0-1 of the considered max and min variables:
 (1)
(1)
Herein,  represents
  BVs choices of
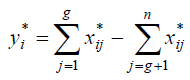
  qualitative and quantitative variables. Generally, these variable numbers come in the interval [0, 1] on normalization. These normalized qualitative and quantitative variables are added (if the value of qualitative and quantitative variables is maximum) or subtracted (if the value of qualitative and quantitative variables is minimum). Thus, the sum up of the overall performance index of each alternative is simulated by below equation (2):
 (2)
(2)
It describes the number of qualitative and quantitative variables subjected to max. Then, the ratio provides the ranks. The higher overall performance index of BVs represents the higher preference.
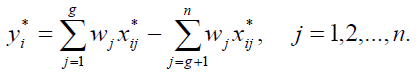
In a few cases, it is perceived that a few qualitative and quantitative variables are more significant rather than others, then in that case. The more meaningful to and provided to worthy variables, Then it can be multiplied by its native weight (significance or weight); Eq. 3 is used as follows in that case:
 (3)
(3)
Herein is the significance or weight of qualitative and quantitative variables.
Scenario Analysis: Empirical Case Study
The Construction SCM performance evaluation and measurement index/model is presented as part of the research work in Table 1. It is assumed that there is a set of four alternative BVs corresponding to Construction SCM variables (model). The objective is to find, select, and benchmark the best BVs among others under the model. An Indian colonizer is, in this assumed case study, seeking a feasible bricks supplier with CSCM qualitative and quantitative module variables that could compensate for the orders of bricks. The authors propose a module, as shown in Table 1.
| Table 1 Brick Vendor Evaluation and Benchmarking Qualitative and Qualitative Variable Module | ||||
| Categories | Variables | Information sought | Problem under category | Goal |
| Quantitative category | Backing cost | Objective values (Numerical data) |
Multi-variable optimization | Benchmarking of feasible brick vendors |
| Material cost | ||||
| Logistic cost | ||||
| Incoming and outgoing logistic costs | ||||
| Labor cost | ||||
| Miscellaneous cost | ||||
| Production setup depreciation/hr cost | ||||
| Qualitative category | Environmental performance | Verbal value (Voice data) |
Multi-variable optimization | |
| Service level | ||||
| Lean production | ||||
| Delivery under crises | ||||
The proposed module with MOORA computational technique helps to optimize the manufacturing cost cum other CSCM variables for Indian colonizers. The attitudes of both categories of variables are shown in Table 2.
| Table 2 Attitudes of All Variables | ||
| Categories | Variables | Attitudes |
| Quantitative category | Backing cost | (-) |
| Material cost | (-) | |
| Logistic cost | (-) | |
| Incoming and outgoing logistic costs | (-) | |
| Labor cost | (-) | |
| Miscellaneous cost | (-) | |
| Production setup depreciation/hr cost | (-) | |
| Qualitative category | Environmental performance | (+) |
| Service level | (+) | |
| Lean production | (+) | |
| Delivery under crises | (+) | |
The further steps are followed to compute the decision.
Stage 1: The production data vs. quantitative variables are assumed vs. BVs by an Indian colonizer, depicted in Table 3.
| Table 3 Data vs Quantitative Variables | ||||
| Category | Variables | Cost (Cents/unit) | ||
| BV1 BV2 BV3 | ||||
| Quantitative category | Baking cost | 0.20C | 0.2C | 0.3C |
| Material cost | 0.65C | 0.7C | 0.7C | |
| Internal Logistic cost | 0.20C | 0.25C | 0.2C | |
| Incoming and outgoing logistic costs | 0.20C | 0.2C | 0.2C | |
| Labor cost | 0.30C | 0.3C | 0.3C | |
| Miscellaneous cost | 0.30C | 0.3C | 0.25C | |
| Production setup depreciation/unit | 0.05C | 0.05C | 0.05C | |
Stage 2: A team of five professionals (P1), (P2), (P3), (P4), and (P5) assigned the ratings vs only qualitative variables after monitoring the ongoing green performance of suppliers 1, 2, 3, depicted in Tables 4-6
| Table 4 Data vs Qualitative Variables For BV1 | ||||||
| Category | Variables | P1 | P2 | P3 | P4 | P5 |
| Qualitative category | Environmental performance | 60 | 50 | 60 | 80 | 100 |
| Service level | 70 | 65 | 70 | 55 | 85 | |
| Lean production | 80 | 100 | 100 | 87 | 86 | |
| Delivery under crises | 78 | 52 | 78 | 75 | 79 | |
| Table 5 Data vs Qualitative Variables for BV2 | ||||||
| Category | Variables | P1 | P2 | P3 | P4 | P5 |
| Qualitative category | Environmental performance | 50 | 50 | 70 | 90 | 100 |
| Service level | 75 | 65 | 70 | 55 | 85 | |
| Lean production | 85 | 90 | 100 | 88 | 86 | |
| Delivery under crises | 70 | 52 | 78 | 75 | 79 | |
| Table 6 Data vs Qualitative Variables for BV3 | ||||||
| Category | Variables | P1 | P2 | P3 | P4 | P5 |
| Qualitative category | Environmental performance | 65 | 55 | 65 | 85 | 100 |
| Service level | 70 | 64 | 70 | 55 | 85 | |
| Lean production | 85 | 100 | 100 | 87 | 86 | |
| Delivery under crises | 78 | 52 | 78 | 75 | 79 | |
Stage 3: The ratings vs qualitative variables corresponding to suppliers 1-2-3 are aggregated by average rule. Subsequently, aggregated data of qualitative variables are mixed with quantitative variables to form a matrix. Equa.1 is executed to normalize both variables and bring the values in between 0 and 1, as shown in Table 7.
| Table 7 Normalized Matrix vs All Variables for BV1-2-3 | |||||||||||
| Variables | Backing cost | Material cost | Logistic cost | Incoming and outgoing logistic costs | Labor cost | Miscellaneous cost | Production setup depreciation/hr cost | Environmental performance | Service level | Lean production | Delivery under crises |
| BV1 | 0.561 | 0.575 | 0.577 | 0.582 | 0.485 | 0.549 | 0.530 | 0.577 | 0.577 | 0.609 | 0.577 |
| BV2 | 0.577 | 0.583 | 0.572 | 0.569 | 0.485 | 0.591 | 0.662 | 0.577 | 0.577 | 0.609 | 0.577 |
| BV3 | 0.593 | 0.573 | 0.583 | 0.582 | 0.728 | 0.591 | 0.530 | 0.577 | 0.577 | 0.508 | 0.577 |
Stage 4: Equa. 2 is employed to compute the decision after the normalized matrix, illustrated in Table 8.
| Table 8 Scoring and Ranking of BV1-2-3 | ||
| BVs | Performance scores | Rankings |
| BV1 | -1.610214 | 1 |
| BV2 | -1.778466 | 3 |
| BV3 | -1.756668 | 2 |
Stage 5: The results illustrate that supplier-1 is more optimum than supplier-2 and 3.
Conclusion
In the presented research work, the Indian colonizers are facilitated by the tie-up of qualitative and quantitative variables, which obtain the data related to the brick production costs and construction supply chain management from professional and accurate manufacturing firms. The tied-up of qualitative and quantitative variables is simulated using the MOO-RA (Multi-Objective Optimization via Ratio-Analysis) technique. The research aims to evaluate the feasible cum environmental BV. The SA colonizers are advised to dwell with BV1 because BV1 is optimum for BV2 and BV3. The research aids the SA colonizers in ranking the other BVs in the future by executing the same research work the results are shown in line chart Figure 3.
References
Abdel-Razek, R. H. (1997). How construction managers would like their performance to be evaluated. Journal of construction engineering and management, 123(3), 208-213.
Indexed at, Google Scholar, Cross Ref
Ahmad, S. B., Svalestuen, F., Andersen, B., & Torp, O. (2016). A review of performance measurement for successful concurrent construction. Procedia-Social and Behavioral Sciences, 226, 447-454.
Aibinu, A. A., & Odeyinka, H. A. (2006). Construction delays and their causative factors in Nigeria. Journal of construction engineering and management, 132(7), 667-677.
Ajayi, S.O., Oyedele, L.O., Akinade, O O., Bilal, M., Owolabi, H. A., Alaka, H. A., & Kadiri, K. O. (2016). Reducing waste to landfill: A need for cultural change in the UK construction industry. Journal of Building Engineering, 5, 185-193.
Indexed at, Google Scholar, Cross Ref
Akenroye, T.O., Oyedijo, A., Rajan, V.C., Zsidisin, G.A., Mkansi, M., & El Baz, J. (2023). Connecting the dots: uncovering the relationships between challenges confronting Africa's organ transplant supply chain systems. Supply Chain Management: An International Journal, 28(7), 43-61.
Alarcón, L. F., Grillo, A., Freire, J., & Diethelm, S. (2001, August). Learning from collaborative benchmarking in the construction industry. In Ninth Annual Conference of the International Group for Lean Construction (IGLC-9).
Balakrishnan, A. S., & Ramanathan, U. (2021). The role of digital technologies in supply chain resilience for emerging markets’ automotive sector. Supply Chain Management: An International Journal, 26(6), 654-671.
Cattell, K., Bowen, P., & Edwards, P. (2016). Stress among South African construction professionals: a job demand-control-support survey. Construction management and economics, 34(10), 700-723.
Indexed at, Google Scholar, Cross Ref
Forslund, H., Björklund, M., & Svensson Ülgen, V. (2022). Challenges in extending sustainability across a transport supply chain. Supply Chain Management: An International Journal, 27(7), 1-16.
Gidigah, B. K., Agyekum, K., & Baiden, B. K. (2022). Defining social value in the public procurement process for works. Engineering, Construction and Architectural Management, 29(6), 2245-2267.
Hany Abd Elshakour, M. A., Al-Sulaihi, I. A., & Al-Gahtani, K. S. (2013). Indicators for measuring performance of building construction companies in Kingdom of Saudi Arabia. Journal of King Saud University-Engineering Sciences, 25(2), 125-134.
Indexed at, Google Scholar, Cross Ref
Harju, A., Hallikas, J., Immonen, M., & Lintukangas, K. (2023). The impact of procurement digitalization on supply chain resilience: empirical evidence from Finland. Supply Chain Management: An International Journal, 28(7), 62-76.
Huang, N., Du, Q., Zou, P. X., & Huang, Y. (2023). Analysis of key factors influencing green highway project development focusing on network interaction and project success: evidence from China. Engineering, Construction and Architectural Management, 30(8), 3203-3223.
Ingenbleek, P. T., & Krampe, C. (2023). Sustainability in the supply chain–understanding suppliers’ resource allocation for sustainability issues. Supply Chain Management: An International Journal, 28(7), 28-42.
Kamaruzzaman, S. N., Lou, E. C. W., Zainon, N., Zaid, N. S. M., & Wong, P. F. (2016). Environmental assessment schemes for non-domestic building refurbishment in the Malaysian context. Ecological Indicators, 69, 548-558.
Indexed at, Google Scholar, Cross Ref
Novieto, D.T., & Kportufe, G. S. (2022). Work-family conflict and project performance of construction professionals in a developing country: testing the mediating–moderating effect of project management self-efficacy. Engineering, Construction and Architectural Management, 29(9), 3331-3344.
Ogunlana, S. O. (2008). Critical COMs of success in large-scale construction projects: Evidence from Thailand construction industry. International Journal of Project Management, 26(4), 420-430.
Pillai, A. S., Joshi, A., & Rao, K. S. (2002). Performance measurement of R&D projects in a multi-project, concurrent engineering environment. International Journal of project management, 20(2), 165-177.
Roberts, M., & Latorre, V. (2009). KPIs in the UK's construction industry: Using system dynamics to understand underachievement. Revista de la Construcción, 8(1), 69-82.
Skibniewski, M. J., & Ghosh, S. (2009). Determination of key performance indicators with enterprise resource planning systems in engineering construction firms. Journal of construction engineering and management, 135(10), 965-978.
Indexed at, Google Scholar, Cross Ref
Stapenhurst, T. (2009). Benchmarking: Prakticheskoe rukovodstvo dlya menedzherov (The Benchmarking Book: A how-to guide to best practice for managers and practitioners).
Venkatesh, V. G., Zhang, A., Deakins, E., & Mani, V. (2020). Drivers of sub-supplier social sustainability compliance: an emerging economy perspective. Supply Chain Management: An International Journal, 25(6), 655-677.
Vereen, S. C., Rasdorf, W., & Hummer, J. E. (2016). Development and comparative analysis of construction industry labor productivity metrics. Journal of Construction Engineering and Management, 142(7), 04016020.
Indexed at, Google Scholar, Cross Ref
Yun, S., Choi, J., De Oliveira, D. P., & Mulva, S. P. (2016). Development of performance metrics for phase-based capital project benchmarking. International Journal of Project Management, 34(3), 389-402.
Indexed at, Google Scholar, Cross Ref
Received: 08-Mar-2024, Manuscript No. AMSJ-24-14588; Editor assigned: 11-Mar-2024, PreQC No. AMSJ-24-14588(PQ); Reviewed: 30-Mar-2024, QC No. AMSJ-24-14588; Revised: 03-Jun-2024, Manuscript No. AMSJ-24-14588(R); Published: 19-Jul-2024