Research Article: 2022 Vol: 26 Issue: 2
Conceptualizing and Operationalizing Customer Perceived Ethicality (Cpe) In the Indian Service Sector
A N Ravichandran, Aligarh Muslim University
Bilal M Khan, Aligarh Muslim University
Shanthi Venkatesh, LIBA, Chennai
Citation Information: Ravichandran, A.N, Khan, B.M., & Venkatesh, S. (2022). Conceptualizing and operationalizing customer perceived ethicality (CPE) in the indian service sector. Academy of Marketing Studies Journal, 26(2), 1-20.
Abstract
While CPE both as a concept and as a construct for further research has advanced in Western geographies, there is little research in Asian countries. This study addresses the gap by evolving a conceptual framework, and developing a scale for further research. Research is carried out in two phases: 1. An exploratory research using the long interview methodology to arrive at domain items of CPE unique to India, with specific reference to the Service sector. 2. Operationalising the construct CPE, based on two independent surveys using a Likert 7-point scale. 31 well-known brands representing six service industries are included. Using SPSS and AMOS 23, factor analysis is deployed to arrive at a reliable, valid instrument. A psychometrically sound measurement scale for CPE is developed for the first time in India, based on CPE Domain items resulting from the exploratory research. It can be used to advance research to study the relationships between CPE and brand-related Constructs, and in business, for understanding how CPE influences consumer decision making; help firms prioritize budgets and activities. The research fills a gap identified in similar research in Europe, calling for replicating studies both at a conceptual level as well as developing a measurement scale.
Keywords
Scale development for CPE; Indian Service Sector; Business Ethics; CPE Domain Items; Factor Analysis.
Introduction
Customer perceived ethicality, CPE for short, refers to customers’ overall perceptions of Firm ethics. It is a subject of growing interest and research has been sparse, especially in India. Research on Firm side ethics and the seller’s perspective is substantial but the customer perspective is rare (Kimmel, 2001). Research from 1990 is found to look at it mainly from the seller's point of view. Consumer ethics needs to be addressed as an independent agenda, to ‘enable the development of a holistic model of ethical decision-making in consumption’.
The Need for a Measure in India
Research has progressed in the developed economies in the past decade, in not only arriving at a valid scale for the measurement of CPE but also in establishing the strength and direction of relationships that CPE has with outcome variables of interest to marketing and business (Singh et al., 2012; Sierra et al., 2017; Iglesias et al., 2017). There have been attempts to arrive at various measures on allied concepts. The Business Ethics Index (BEI), used to evaluate consumers’ sentiments towards business ethical practices was developed in the USA (Tsalikis & Seaton, 2006). Walsh & Beatty (2007) have developed scale items for another customer based measure, viz., corporate reputation, using five measures. Agag et al. (2016) have developed an instrument for measuring online retailing ethics from a consumer perspective using six variables. A concept of ‘conscientious corporate brands was developed and a valid measure was developed consisting of four dimensions (Rindell et al., 2011; Hutchinson et al., 2013). The closest effort in arriving at a measurement scale for CPE belongs to Brunk (2012). This measure has been largely adopted for furthering research (Singh et al., 2012; Markovic et al., 2015). All these studies call for replicating research and scale development in Asian settings. Culture and country contexts further emphasize the need and scope for defining CPE succinctly in an Indian context both conceptually as well as to operationalise CPE as a Construct. CPE may be even more appropriate in a Service context, wherein the brand concept enlarges from just the offering, to the level of the Firm (Sierra et al., 2017). Hence, this article focuses exclusively on the service sector, given its growing importance in India, with the service sector constituting the largest component (more than 54 percent) of the Indian economy (Indian Services Industry report, March 2019), to define a psychometrically sound measure for CPE (Nunnally, 1967). 31 service brands from six categories (Table 10), were carefully selected to represent this sector in the customer surveys.
Research Methodology
The research was done in two phases.
I. Exploratory Research to define CPE domain items with focus on the Service Sector.
1. Collecting data using the long interview methodology.
2. Arriving at domain items of CPE through analysis of content.
II. Conclusive Research to identify scale items for CPE
1. Using ‘Item parcelling’ to identify well defined initial scale items by appropriately grouping the conceptual domain items.
2. Conducting a survey of respondents and collecting responses using these initial items.
3. Using EFA for an initial solution and followed by CFA for scale refinement.
4. Repeating the survey for confirmation of the scale.
Exploratory Research
The research filled the gap that was identified in a similar work in Europe (Brunk K.H. 2010). ‘Grounding concepts in the reality of data’ (Corbin & Strauss, 1990) required that the referred research needed to be revisited in the Indian context. The entire exercise of data collection, analysis and findings took place over a 9-month period. The Long Interview methodology (McCracken, 1988) was deployed. Twenty two long interviews of carefully selected respondents from diverse backgrounds, (ages ranging from 26 to 68) were conducted, recorded and transcribed. The respondents were chosen carefully, ‘with sufficient knowledge to respond with consideration to the task at hand’ (Knox & Burkard, 2009). In the long interview methodology, 22 in-depth interviews are far more than adequate (McCracken, 1988).
Content Analysis
Content analysis is a qualitative research technique used to make valid inferences by coding and interpreting material from a text. By systematically evaluating texts such as documents or oral communication, qualitative data can be classified and the underlying pattern identified. There are two types of content analysis: conceptual analysis and relational analysis. Conceptual analysis determines the existence and frequency of concepts in a text. Relational analysis develops the conceptual analysis further by examining the relationships among concepts in a text Table 1.
The following stepwise methodology was deployed (Zhang & Wildemuth, 2009).
This part of the research was created as a working paper and later published. The summary findings are reproduced below Table 2.
Operationalizing the Construct CPE
Table 4 shows the summary of certain highly cited scales in the field of Business Ethics. Evidently the direct measurement of CPE (Brunk, 2012) is more appropriate. The scale has been largely deployed in furthering research on relationship of CPE with outcome variables of interest (Singh et al., 2012; Sierra et al., 2017).
Methodological Justification
‘Measurement instruments that are collections of items combined into a composite score and intended to reveal levels of theoretical variables, not readily observable by direct means are referred to as scales’ (DeVellis, 2017). The task is to reduce the variables into a set of meaningful, relatable set of items which can subsequently be administered to a sample and test for its psychometric properties as a practical measurement tool of CPE.
In the referred study, six items were identified as Initial Scale items, after analysing the contents of the exploratory study. Exploratory Factor Analysis (EFA) was performed on these six items and a single factor solution was subjected to Confirmatory Factor Analysis (CFA) for Scale refinement. It can be argued that all the 36 subdomain items in that study should have been used to identify the underlying factors, instead of condensing them into six key themes. However, Items from the larger list that seem to go together can be grouped together (Nunnally, 1967). Item Parcelling is an accepted procedure when it comes to factor analysis. Items are grouped into one or more ‘parcels’ and used instead of a detailed set of items, as the indicators of the target latent Construct (Cattell & Burdsal, 1975; Kishton & Widaman, 1994).
A step by step approach was followed in the current research (Carpenter, 2018).
Arriving at Initial Scale Items
Identifying the initial set of measurement scale items involved sorting and grouping the 18 domain items Table 3 into key themes, and statements that can be understood by prospective participants in the survey. Table 5 gives these statements and the corresponding grouping.
Preparing for the Surveys
A pilot was conducted four months before the main survey. There were 132 usable responses in the pilot. Reliability studies were conducted and a significant value of 0.939 for Cronbach alpha was obtained. Given a large sized sample, EFA was also conducted. A sixth scale item, CPE6, viz., ‘the services of this brand are reliable’ formed part of the pilot survey, as per grouping of items done before the pilot. It was subsequently dropped, as its communality (that refers to the proportion of its variance explained by the factor CPE), was lower than the rest (Table 6). Consequently, this item was removed in the final questionnaire which had 5 items as shown in Table 5.
Extraction Method: Principal Component Analysis
Two more Constructs, viz., brand loyalty and brand equity were included in the main survey to enable conducting validity tests including convergent and discriminant validity, during the confirmatory phase of item refinement and model fit. Psychometrically sound scales for brand loyalty and brand equity (Yoo & Donthu, 2001; Keller, 1993, Aaker, 1996) have been extensively used to advance research. Hence the scales for these two constructs were adopted from established research. Thirteen questions in all, five pertaining to CPE and four each for brand equity and brand loyalty formed part of the larger survey Table 7.
Sampling Technique, Administration - Survey One
A snowballing approach was deployed in getting responses from all over the country. As shown in the analysis below, all the demographic parameters were equally represented. Executives vs non-executive respondents (teaching/research, homemaker, retired), were similarly equally represented. Income group was also well spread over five categories (Tables 8 & 9).
A concept like CPE demands that the responding population have a reasonable appreciation of the terms, and the ability to comprehend the unique significance of each item (Knox, et al. 2009), resulting in considered responses. If statement meanings are not properly distinguishable, they cannot be compensated subsequently by the rigor of statistical analysis ‘A balanced combination of ‘prevention of errors’, and ‘correction based on analysis’ is the right approach to questionnaire design’ (Churchill, 1979). The size of the pilot (132) was also substantial and the learnings from analysing the pilot helped in the subsequent main survey, thus minimizing the scope for errors in responses.
Adequacy of Sample size
Sample size plays a role in understanding whether skewness and kurtosis are a concern. In the case of these surveys, a sample size of 302 and 311 were obtained after filtering out responses from an initial sample of around 350 each. The sample size increases statistical power by reducing sampling error. A large sample also reduces the negative effects of distribution not being normal and for more than 200; these effects may be negligible (Hair et al., 2018). High communality values further support a lower number with regard to statistical power (Table 6). All things considered, a size above 300 valid responses is a good sample size supporting further analysis. Notwithstanding, normality of the data was also established.
Six categories of services and 31 brands were included in the survey, thus giving a wide choice and improve generalisability. The categories as well as the brands are well known, thus enabling respondents to relate to the subject. The chosen services constitute a bulk of the country’s service revenue, further improving the scope of application of the measure Table 10.
Data Collection
The progressive responses were collected in a spreadsheet in Google Drive, copied and arranged in different files and folders for subsequent processing. Once the data reached a sizeable number it was recast using prespecified codes for gender, age group, educational qualifications, occupation, income range, category of service, and brand chosen. The questionnaire items were also identified with abbreviated codes such as CPE1….5, etc. Surveys were started in May 2020 and completed in August. Around 350 responses were collected in Survey One. After dropping responses that had the same choice for all questions as well as outliers, 302 useful responses were identified. (These are indicative of responder fatigue and hence need to be discarded). Other responses where low or high values were present were retained as these might be genuine views on the questionnaire items.
Challenges in Data Collection, Questionnaire Design, and Administration
The questionnaire had to be administered to an unknown audience, and collected through ‘Google forms’. There are software limitations that have to be overcome to get considered responses. The design ensured that every single question had to be answered before moving to the next. While this may result in losing reluctant respondents, it makes the data more accurate and eliminates missing data. Prevention is a superior solution compared to the use of software to deal with missing data subsequently. There were a total of 31 brand choices. The questionnaire had to be carefully designed to enable navigation to the corresponding choice and the corresponding page. The final format in google forms software had 78 pages in its design while the respondent had to go through just a few pages.
Data Analysis
Arriving At Factor Solutions; Conducting Reliability Tests; Checking For Normality
The Survey samples were subjected to Skewness and Kurtosis tests and the values were well within the allowable limits of -2 to +2 Table 10, establishing normality.
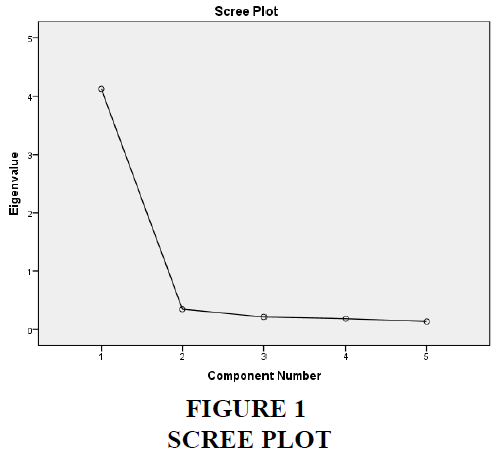
The responses were systematically coded and the file was uploaded in SPSS 23. Following procedures for empirical scale development, the scale was established using EFA, followed by model fit and validity (Churchill, 1979). The five items and the responses in survey one were subjected to EFA using principal component analysis. The KMO measure of sampling adequacy (Malhotra et al., 2012), was tested before conducting the EFA and a high value of 0.898 was obtained (Kaiser, 1974). Bartlett’s test of sphericity testing for the significance of the correlation matrix of the variables, indicated that the correlation coefficient matrix is significant (p-value of <0.001**), signalling appropriateness of EFA for the sample surveyed (Chawla & Sondhi, 2016). The results of the EFA are shown in Table 11. All the five items loaded significantly on just one factor (0.755 to 0.873), with a total variance explained of 82.49 percent. Only one factor had an eigenvalue of greater than 1, affirming the single-factor solution. The scree plot exhibited a sharp turn as shown in Figure 1, further emphasizing the single-factor solution. Inter-item correlations ranged from 0.799 to 0.893, affirming that there was no multicollinearity (Hair et al., 2018). After the initial analysis on dimensionality, and establishing that all the five variables measure a single factor, the reliability of data was tested. Cronbach alpha (Cronbach, 1951), was highly significant at 0.947, indicating a high level of internal consistency.
Scale Refinement through CFA using AMOS 23
While the EFA results above indicate that all five items are unidimensional and measure the construct CPE (Gerbing et al., 1988), it is essential to check for model fit and the need for scale refinement, enabling confirmation or rejection of preconceived theory.
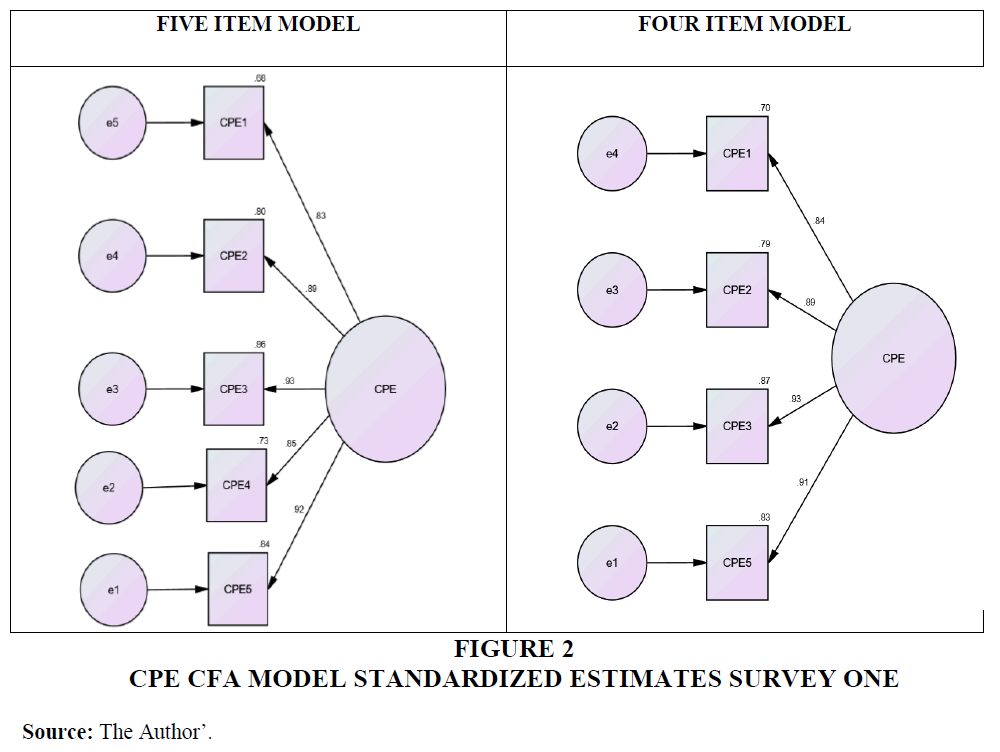
The results of the CFA are shown in Tables 12 & 13. The maximum likelihood estimates show that all five factors are significant (Nunnally, 1967), with a p-value less than 0.001** and the standardized regression weights range between 0.855 and 0.927.
There are three categories of goodness-of-fit indices, viz., absolute, incremental, and parsimony fit indices. Absolute fit indices give the most basic estimation of how well theory fits the sample data. These are GFI (goodness-of-fit index); RMSEA (root mean square error of approximation); RMR (root mean square residual); CMIN/df (normed chi-square). Incremental fit indices indicate improvement in fit in comparison to the alternate baseline model. The indices commonly used are - NFI (normed fit index) and CFI (comparative fit index). Besides, the parsimony fit index AGFI (adjusted goodness of fit) is commonly reported (Hu & Bentler, 1999). The results of the first survey are presented below Tables 12 & 13.
As seen above, the model with five items included Figure 2, suffered from disadvantages. While GFI, AGFI, NFI, CFI, and RMR were all as per the range desired (MacCallum et al.,1996; Bagozzi et al., 1988), CMIN/df at 5.033 was slightly greater than 5 and the p-value was outside the range (<0.001**). RMSEA was slightly above at 0.116 (desired range <0.80 - Hair et al., 2018). Modification indices suggested high covariance between the item ‘this brand is from a firm that is environmentally responsible’ and items 1 and 2- ‘In my view, the brand is from a firm that abides by law’ and ‘The brand is from a firm that is socially responsible’. A plausible explanation lies in the respondent having a common understanding of some terms. It could also be that environmental concerns elicit a divergent set of responses. It must be noted however, that its absolute value was still significant, even though the standardized regression weight was lower than the rest. This point will be referred to while recommending the final solution. In light of the above, the item ‘this brand is from a firm that is environmentally responsible’ was removed and the model tested again.
CMIN/df at 4.218 was within the limit of 5; the p-value had improved to 0.015, still lower than 0.05 specified. All other values of GFI, AGFI, NFI, CFI, RMR were well above or below the range suggested. RMSEA at 0.103 was also reasonable (ideally should be below 0.080). The RMR (root mean square residual) is the square root of the average squared amount by which the sample variances and covariances differ from their estimates obtained under the assumption that the model is correct, while RMSEA gets a point estimate of the root mean square error of approximation. Modification indices showed that very little error was left and the model can be deemed satisfactory.
The following four-item solution is thus found to be an ideal measure of the construct CPE in the Indian Service sector Table 14.
Conducting the Second Survey for Checking Consistency of Results
To further improve model fit and to check the consistency of results, a second survey was undertaken, and the learnings from the administration of the first were rigorously applied to the second. Once again close to 350 responses were collected. Extreme outliers as well as uniform responses (which happens when a respondent is rushing through the submission) were removed. A total of 311 useful responses were shortlisted.
Data Analysis on Survey Sample 2
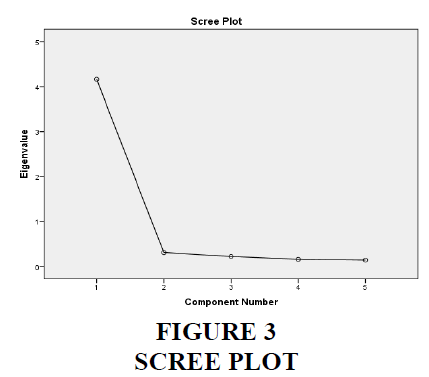
EFA was carried out with five items of CPE. The KMO was a significant 0.889, with Bartlett’s test of sphericity indicating a p-value of < 0.001**; all the five items loaded significantly on one factor (0.785 to 0.850). The total variance explained was high at 83.33 percent. Item total correlations ranged from 0.823 to 0.875. Once again a single factor solution was the result and the scree plot Figure 3 confirmed the single-factor solution. Reliability was high with Cronbach alpha at 0.950 Table 15.
Conducting CFA on the Second Sample
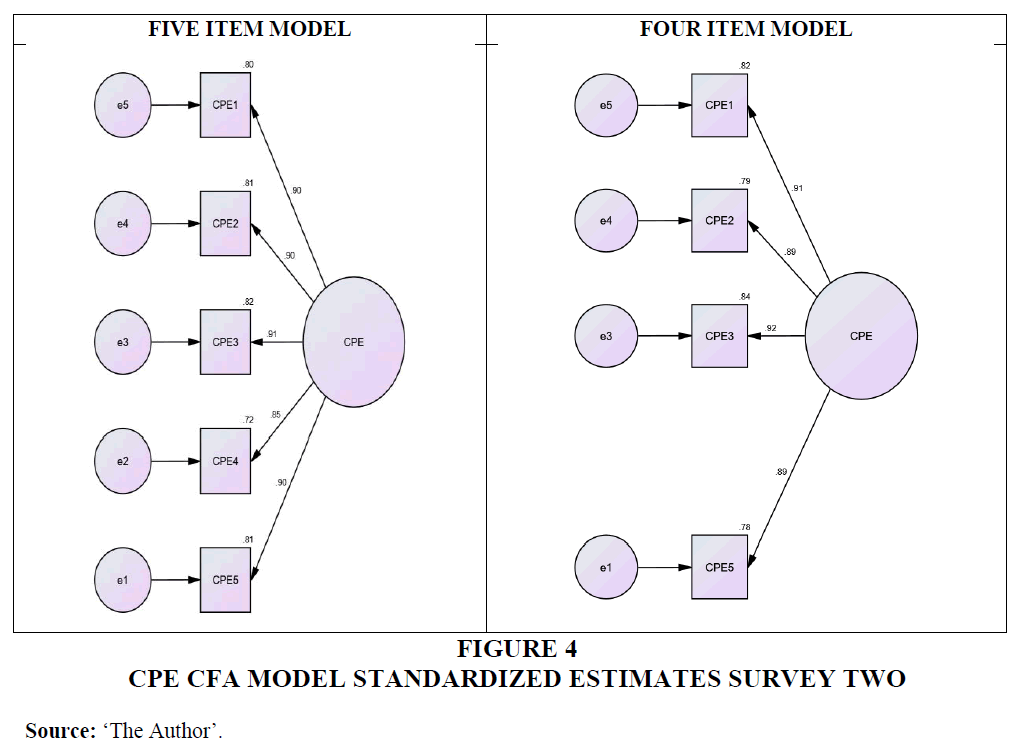
The main purpose of the second survey was to check for consistency of results, establish model fit, and validity. Using AMOS 23, CFA was run and the results once again showed that the five-factor solution Figure 4 had limitations (Tables 16 & 17).
The maximum likelihood estimates showed that all five items are significant with a p-value of less than 0.001** (significant at 1 percent level), and the factor loadings range between 0.847 and 0.907. Such high values are indicative of convergent validity (Anderson & Gerbing, 1988).
GFI, AGFI, NFI, CFI, and RMR were within the range but CMIN/df at 9.242 with a p-value less than 0.001** and RMSEA at 0.163 needed improvement. Modification indices once again pointed out that the item ‘the brand is from a firm that is environmentally responsible’ had significant covariance with items 1 and 2.
After removing this item, the calculated estimates met all specified limits. CMIN/df was 2.629 and the p-value at 0.072 was larger than 0.05. GFI, AGFI, NFI, RMR were all well within specified ranges. RMSEA at 0.072 also appeared within the range of less than 0.080, confirming once again that the four-item solution is a concrete measure of CPE, and model fit was obtained.
The second survey sample met and exceeded all the criteria specified and hence, was a further improvement on the first. Conducting the second survey further ensured that the 4-item solution is not unique to just one sample.
Checking for Validity
Validity refers to the question of whether we are measuring what we want to measure. Validity tests consist of face validity, content validity, and construct validity (convergent and discriminant validity).
Face Validity, Content Validity
‘These involve subjective judgment by the expert for assessing the appropriateness of the Construct’ (Chawla & Sondhi, 2016). The exploratory research referred was an exhaustive exercise and the domain items were arrived at through a systematic process (Spiggle S.1994). 22 people with varying backgrounds provided inputs obtained through a semi-structured interview process that followed the principles suggested in the literature (McCracken 1988). A stage was reached when saturation resulted, and a wide spectrum of issues was documented concerning the ethical perception of the Indian consumer of various service firms in India. This is the best process assuring face and content validity. Content pretesting was done with the four experts while shortlisting the initial six items for EFA (Reynolds & Diamantopoulos, 1998).
Convergent Validity
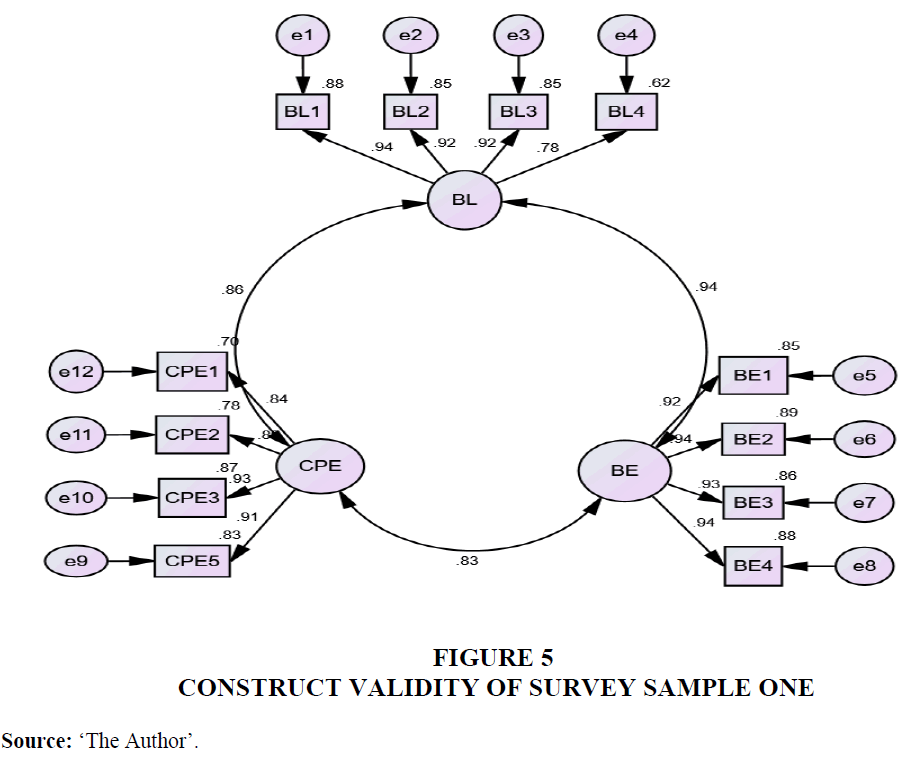
Convergent validity is about how much variance the items measuring a Construct have in common. While examining convergent validity (Fornell & Larcker., 1981, Bagozzi & Yi, 1988), three measures are relevant- factor loading; average variance extracted (AVE); composite reliability (CR). The two other constructs that are relevant for establishing these are brand loyalty (BL) and brand equity (BE). Extant literature helps understand the relationship that CPE might have with these constructs, through mediating factors, as well as directly (Singh et al., 2012, Markovic et al., 2015, Sierra et al., 2017). By measuring these relationships (Figure 5), concurrent validity gets established as well. Using AMOS 23, the three constructs of CPE, brand equity, and brand loyalty were subjected to CFA (Dabholkar et al., 1996).
Table 18 gives the results for Survey One with the four items that were confirmed as the final measurement scale items for CPE and four items each for BE and BL.
Factor Loadings
Loadings (standardised regression weights) for all four CPE items were significant as required for convergent validity. (0.836 to 0.932). Similar results were found for BL and BE as well, as seen in table above.
Average Variance Extracted (AVE)
It is the mean variance extracted for the items measuring a Construct and is a summary indicator of convergence. An AVE of 0.5 or higher indicates adequate convergent validity. AVE as calculated for CPE was a significant 0.797, well above the reference range specified in the literature. Similar results were found for BL and BE as well.
Composite Reliability
Composite reliability is a measure of internal consistency in scale items and is preferred in CFA, while Cronbach's alpha is preferred while doing EFA (Netemeyer, 2004). A value of 0.7 or higher suggests good reliability. In survey One, the CR value for CPE was 0.940, which indicates very good reliability. Similar results were found for BL and BE as well.
All three Constructs satisfy the criteria for factor loadings, AVE, and CR. It can therefore be inferred that all the four items of each of the three Constructs converge well with their respective Constructs and hence exhibit good convergent validity.
Discriminant Validity
Discriminant validity is the extent to which a Construct is truly distinct from other Constructs. It measures the uniqueness of a Construct in capturing a phenomenon that other Constructs cannot. The conditions to be satisfied are that AVE of the Construct should be less than the CR value and should be higher than 0.5; and should be larger than the corresponding SIC (squared inter-construct correlation), which will indicate that the measured variables have more in common with the Construct they are associated with (CPE) than they do with the other Constructs. Here the AVE of CPE at 0.797 is greater than the SIC of CPE vs BL of 0.746 and CPE vs BE of 0.691(Table 18).
Thus there is evidence of good discriminant validity (Fornell & Larcker, 1981).
The 4-item solution meets all criteria of validity and hence is a sound measure of CPE.
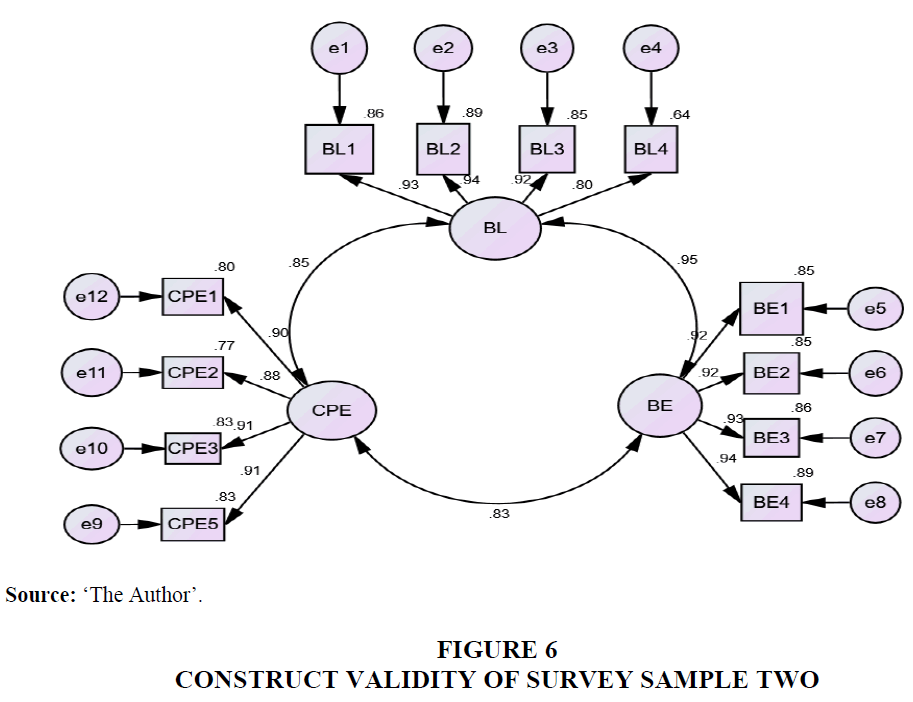
A similar exercise was carried out for survey Two (Figure 6; Table 19).
Summary
The research was undertaken to establish scale items for the measurement of CPE, paving the way for future Indian research. It is based on an in-depth exploratory research that formalizes domain items (Table 3) that are exclusive to the Indian Service context.
Starting with a pilot survey, two independent surveys were undertaken, the first for establishing the scale and the second for checking consistency. The construct CPE was operationalized in the Indian service sector, paving the way for further studies (Table 14).
A question arises about dropping the fifth item, ‘the brand is from a firm that is environmentally responsible’. The reason for dropping this item was to obtain a sound model fit that meets all established criteria for a psychometrically robust measurement tool. However, it must be noted that covariance can be caused by the challenge of distinguishing between like-sounding terms, howsoever much it gets addressed in the questionnaire phraseology. The critical question is, ‘are environmental considerations vital to the consumer of services, as revealed by her responses?’ The more-than-adequate factor loading achieved of this item, and the part it played in the initial factor solution seem to suggest that further research can choose to include the fifth item also as a considered choice, while the four-factor solution more than adequately meets all norms of sound measurement; the need for being parsimonious (between 3 to 5) is also met.
The six categories of service chosen for the surveys constitute the bulk of the service revenue (above 50 percent) of the country, thus enhancing the scope of applicability of the findings to a larger spectrum. The demographic analysis further enhances the generalisability of the findings. Addressing the service sector specifically is a unique contribution, as the criteria between goods and services are variable (Markovic et al., 2015, Singh et al., 2012).
The scale development will also pave the way for further research into understanding relationships that CPE is likely to have with outcome variables of interest. This paper is the first of its kind in the Indian service sector and hence its importance. Using structural equation modelling, the direction and strength of the relationship that CPE is likely to exhibit with various factors of interest, such as service quality, brand trust, brand loyalty and brand equity, can be studied. Similar scale development for CPE can be done exclusively for product brands.
Firms can use the measurement approach to understand ethical perceptions of various groups of customers, suppliers and business associates, and further drill down those findings to understand how these perceptions of CPE can be improved in their organizations. These exercises will enable budgets to be sharply focused on corporate objectives.
Conclusion
Limitations and Scope for Further Research
A fundamental limitation arose from the snowball approach to choose respondents. However, to enhance randomness, the participants were largely unknown, distributed through a wide geography, with balanced demographic representation. Giving 31 brand choices should further address this limitation. The objective of the research was to identify scale items of CPE as a whole, with no specific reference to a brand or a service category.
The scale items are overall descriptions of groups of items. Future research can attempt to drill down these into finer descriptions, by referring to the domain items and carry out the survey. The sample size of the surveys was not large enough to justify analysis of brandspecific responses. Larger samples can be obtained and the brand-specific responses can be subjected to analysis, to study the differences between their means and variances. Using paired sample‘t’ tests, comparisons can be made to understand the scale’s ability to distinguish between specified groups of services as well as specified brands. These findings can then be correlated with otherwise learnt opinions. For example, if a brand is reputed to be ethical and another is not, these findings can get corroborated. Similar studies can be carried out exclusively focussed on product brands, both at an exploratory level and followed by scale development, and comparisons drawn with the findings in the service sector. Thus this research paves the way for a multipronged approach for further studies.
References
Aaker, D. A. (1996). Measuring brand equity across products and markets. California management review, 38(3).
Indexed at, Google Scholar, Cross ref
Agag, G., El-Masry, A., Alharbi, N. S., & Almamy, A. A. (2016). Development and validation of an instrument to measure online retailing ethics: Consumers’ perspective. Internet Research.
Anderson, J. C., & Gerbing, D. W. (1988). Structural equation modeling in practice: A review and recommended two-step approach. Psychological bulletin, 103(3), 411.
Bagozzi, R. P., & Yi, Y. (1988). On the evaluation of structural equation models. Journal of the academy of marketing science, 16(1), 74-94.
Indexed at, Google Scholar, Cross ref
Brunk, K. H. (2010). Exploring origins of ethical company/brand perceptions—A consumer perspective of corporate ethics. Journal of Business Research, 63(3), 255-262.
Brunk, K. H. (2012). Un/ethical company and brand perceptions: Conceptualising and operationalising consumer meanings. Journal of business ethics, 111(4), 551-565.
Carpenter, S. (2018). Ten steps in scale development and reporting: A guide for researchers. Communication Methods and Measures, 12(1), 25-44.
Indexed at, Google Scholar, Cross ref
Chawla, D., & Sondhi, N. (2016). Research Methodology- Concepts and cases (Second edition) Vikas Publishing, Noida (UP), India.
Churchill Jr, G. A. (1979). A paradigm for developing better measures of marketing constructs. Journal of marketing research, 16(1), 64-73.
Corbin, J. M., & Strauss, A. (1990). Grounded theory research: Procedures, canons, and evaluative criteria. Qualitative sociology, 13(1), 3-21.
Cronbach, L. J. (1951). Coefficient alpha and the internal structure of tests. psychometrika, 16(3), 297-334.
Indexed at, Google Scholar, Cross ref
Dabholkar, P. A., Thorpe, D. I., & Rentz, J. O. (1996). A measure of service quality for retail stores: scale development and validation. Journal of the Academy of marketing Science, 24(1), 3-16.
Indexed at, Google Scholar, Cross ref
Fornell, C., & Larcker, D. F. (1981). Evaluating structural equation models with unobservable variables and measurement error. Journal of marketing research, 18(1), 39-50.
Gerbing, D. W., & Anderson, J. C. (1988). An updated paradigm for scale development incorporating unidimensionality and its assessment. Journal of marketing research, 25(2), 186-192.
Indexed at, Google Scholar, Cross ref
Hair, J. F., Babin, B. J., Anderson, R. E., & Black, W. C. (2018). Multivariate Data Analysis. red. UK: Cengage Learning EMEA.
Hu, L. T., & Bentler, P. M. (1999). Cutoff criteria for fit indexes in covariance structure analysis: Conventional criteria versus new alternatives. Structural equation modeling: a multidisciplinary journal, 6(1), 1-55.
Hutchinson, D. B., Singh, J., Svensson, G., & Mysen, T. (2013). Towards a model of conscientious corporate brands: a Canadian study. Journal of Business & Industrial Marketing.
Indexed at, Google Scholar, Cross ref
Iglesias, O., Markovic, S., Singh, J. J., & Sierra, V. (2019). Do customer perceptions of corporate services brand ethicality improve brand equity? Considering the roles of brand heritage, brand image, and recognition benefits. Journal of business ethics, 154(2), 441-459.
Kaiser, H. F. (1974). An index of factorial simplicity. psychometrika, 39(1), 31-36.
Keller, K. L. (1993). Conceptualizing, measuring, and managing customer-based brand equity. Journal of marketing, 57(1), 1-22.
Kimmel, A. J. (2001). Ethical trends in marketing and psychological research. Ethics 2000 Behavior, 11(2), 131-149.
Knox, S., & Burkard, A. W. (2009). Qualitative research interviews. Psychotherapy research, 19(4-5), 566-575.
Malhotra, N. K., Mukhopadhyay, S., Liu, X., & Dash, S. (2012). One, few or many?: An integrated framework for identifying the items in measurement scales. International Journal of Market Research, 54(6), 835-862.
MacCallum, R. C., Browne, M. W., & Sugawara, H. M. (1996). Power analysis and determination of sample size for covariance structure modeling. Psychological methods, 1(2), 130.
Indexed at, Google Scholar, Cross ref
Markovic, S., Iglesias, O., Singh, J. J., & Sierra, V. (2018). How does the perceived ethicality of corporate services brands influence loyalty and positive word-of-mouth? Analyzing the roles of empathy, affective commitment, and perceived quality. Journal of Business Ethics, 148(4), 721-740.
Indexed at, Google Scholar, Cross ref
McCracken, G. (1988). The long interview (Vol. 13). Sage.
Netemeyer, R. G., Krishnan, B., Pullig, C., Wang, G., Yagci, M., Dean, D., ... & Wirth, F. (2004). Developing and validating measures of facets of customer-based brand equity. Journal of business research, 57(2), 209-224.
Nunnally, J. C. (1994). Psychometric theory 3E. Tata McGraw-hill education.
Reynolds, N., & Diamantopoulos, A. (1998). The effect of pretest method on error detection rates: Experimental evidence. European Journal of Marketing.
Indexed at, Google Scholar, Cross ref
Rindell, A., Svensson, G., Mysen, T., Billström, A., & Wilén, K. (2011). Towards a conceptual foundation of ‘Conscientious Corporate Brands’. Journal of Brand Management, 18(9), 709-719.
Indexed at, Google Scholar, Cross ref
Sierra, V., Iglesias, O., Markovic, S., & Singh, J. J. (2017). Does ethical image build equity in corporate services brands? The influence of customer perceived ethicality on affect, perceived quality, and equity. Journal of Business Ethics, 144(3), 661-676.
Indexed at, Google Scholar, Cross ref
Singh, J. J., Iglesias, O., & Batista-Foguet, J. M. (2012). Does having an ethical brand matter? The influence of consumer perceived ethicality on trust, affect and loyalty. Journal of business ethics, 111(4), 541-549.
Indexed at, Google Scholar, Cross ref
Tsalikis, J., & Seaton, B. (2006). Business ethics index: Measuring consumer sentiments toward business ethical practices. Journal of business ethics, 64(4), 317-326.
Walsh, G., & Beatty, S. E. (2007). Customer-based corporate reputation of a service firm: scale development and validation. Journal of the academy of marketing science, 35(1), 127-143.
Indexed at, Google Scholar, Cross ref
Yoo, B., & Donthu, N. (2001). Developing and validating a multidimensional consumer-based brand equity scale. Journal of business research, 52(1), 1-14.
Indexed at, Google Scholar, Cross ref
Received: 08-Jan-2022, Manuscript No. AMSJ-22-11181; Editor assigned: 09-Jan-2022, PreQC No. AMSJ-22-11181(PQ); Reviewed: 23-Jan-2022, QC No. AMSJ-22-11181; Revised: 25-Jan-2022, Manuscript No. AMSJ-22-11181(R); Published: 31-Jan-2022
