Research Article: 2021 Vol: 27 Issue: 3
Comparative Analysis of A Traditional and Machine Learning Techniques in Predicting SMMES Growth Performance
Helper Zhou, Durban University of Technology
Victor Gumbo, University of Botswana
Abstract
Firm growth remains one of the most important subjects in research today. This mainly owes to the important role played by growth-oriented firms in addressing socio-economic challenges largely facing governments in developing countries. As such, this study aimed to identify and model key growth drivers of Small-Medium, and Micro Enterprises (SMMEs) harnessing traditional and emergent machine learning techniques. The study further compared the growth predictive modeling performance of the traditional logistic regression and two machine learning techniques, Artificial Neural Network (ANN) and Support Vector Machine (SVM) in predicting SMME growth. The study utilized three-year panel dataset from 191 SMMEs in the manufacturing sector in South Africa’s second-largest province of KwaZulu Natal. The results showed that the duo of SVM and ANN performed better than Logistic Regression in predicting firm growth. Sales revenue was identified as the most important driver of growth and it was recommended that key stakeholders can leverage this key driver to drive the sustainability of SMMEs. Overall, the study recommended the adoption of the SVM technique for SMME growth predictive modeling.
Keywords
Artificial Neural Network, Growth, Logistic Regression, Machine learning, SMMEs, Support Vector Machines.
Introduction
SMME growth predictive modelling has been of interest over the years (McMahon, 2001; Megaravalli, 2017; Šarlija et al., 2016). This is because small firms play a significant role in the economic development of virtually every country around the globe (Herrington & Kew, 2016; International Finance Corporation, 2019). Šarlija et al. (2016) argued that enterprise growth remains one of the central issues in SMME research across the world. The interest on firm growth is not surprising, as it is the growth oriented small firms that make significant contribution to socio-economic development (Machado, 2016; MBEC, 2017). Megaravalli (2017) charged that growth-oriented firms have attracted the attention of various stakeholders, like financiers, academicians and policy makers owing to their ability to create higher number of jobs in an economy. Various countries have noted the importance of prioritising firms with growth potential than low value establishments in order to achieve impactful socio-economic results (MBEC, 2017; National Planning Commission, 2011; OECD, 2009)
Inevitably previous studies have attempted to model growth largely harnessing the traditional logistic regression technique in order to identify firms with potential to sustainably contribute towards socio-economic development objectives (Lussier, 1995; McMahon, 2001; Megaravalli, 2017). The emergence of machine learning techniques which have been found to perform better than traditional statistical approaches present an opportunity for small business researchers to embrace them for growth predictive analytics purposes (Leo et al., 2019; Te, 2018; Youn & Gu, 2010). These emerging advanced techniques besides providing more accurate predictions, they are also adaptive by continuously learning from the data emanating from changes in the internal and external environments (Haataja, 2016; Lantz, 2019). Concerningly, the review of literature revealed a paucity of studies harnessing machine learning techniques to conduct firm growth predictive modelling in developing countries like South Africa, with majority of studies having been done in developed countries (Bauer, 2020; Haataja, 2016; Kolkman & van Witteloostuijn, 2019; Te, 2018). As such in order to contribute to literature, this study harnesses the duo of SVM and ANN and compare them to the traditional logistic regression technique in predicting SMME growth in South Africa’s KwaZulu Natal province. Ultimately, the study aims to identify and recommend the best growth predictive modelling technique that can be used for growth predictive modelling by various pertinent stakeholders in the SMME sector.
Literature Review
Small enterprises form the little acorns from which future multinationals grow and are the key sources of disruptive innovation and employment (International Finance Corporation, 2019; OECD, 2009). Over the years there has been a growing interest on small firm growth owing to the significant role they play in economic development (Machado, 2016; Panda, 2015). Extensive research on firm growth has been conducted over the years and various theoretical models to explain this phenomenon have been postulated (Machado, 2016; O'Farrell & Hitchens, 1988; Panda, 2015; Penrose, 2009). The Stochastic theory which was postulated by Gibrat in 1931 is one of the popular firm growth theories that have been embraced over the years (Geroski, 2005; O'Farrell & Hitchens, 1988). The theoretical model attempts to shed light on firm heterogeneity emanating from various sources (Coad, 2007; Geroski, 2005; Machado, 2016; McMahon, 2001). In essence Gibrat’s Law charged that growth follows a random walk process, connoting that firm growth rate is similar for all enterprises in the market (Geroski, 2005; Stam, 2010). Put differently, Gibrat’s Law implies that firm growth process is stochastic and not determined by any set of internal or external drivers (Geroski, 1995; Stam, 2010). However subsequent studies have tested and largely rejected the validity of this theoretical model (Nassar et al., 2014; Teruel-Carrizosa, 2006). Studies carried out in developing countries, especially South Africa have rejected the validity of the theory (Mamburu, 2018; Masenyetse, 2017; McPherson, 1996), implying that firm growth is a function of certain factors. The rejection of Gibrat’s Law intersecting with increasing data on SMMEs has incentivised research to establish factors related to firm growth (Panda, 2015; Stam, 2010).
The interest has since gone beyond just establishing key drivers of growth but also harnessing the same for predictive modelling purposes (McMahon, 2001; Megaravalli, 2017; Te, 2018). This is key as growth predictive models can be harnessed by both internal and external stakeholders to make informed proactive decisions (Megaravalli, 2017; Šarlija & Biland?i?, 2018). Embracing growth predictive models would allow evidence based decision making for policy makers (Šarlija et al., 2016), especially in South Africa where SMMEs continue to struggle (Bureau for Economic Research, 2016; Small Business Project, 2014) due to a disconnect between policy interventions and sector needs (Lekhanya, 2015). As has been noted, prior studies have largely used logistic regression to establish firm growth drivers and develop concomitant predictive models (Megaravalli, 2017; Šarlija & Biland?i?, 2018; Šarlija et al., 2016). However, since logistic regression is parametric the technique fails to capture non-linear factors’ impact on the regressand and thus minimising their predictive performance compared to non-parametric techniques (Hastie, 2018; Shalev-Shwartz & Ben-David, 2014). The emergence of machine learning algorithms like ANN and SVM can address this limitation as they are nonparametric (Lantz, 2019; Shalev-Shwartz & Ben-David, 2014).Owing to this and other features, machine learning techniques have since gained popularity across different industries across the globe (Cowling et al., 2021; Khan & Tariq, 2021). It is thus interesting to harness ANN and SVM machine learning techniques which have been used for classification problems in other fields and compare their growth predictive modelling performance to the traditional logistic regression technique (Cowling et al., 2021; Leo et al., 2019; Te, 2018; Youn & Gu, 2010).
Consulted literature shows that majority of predictive modelling studies comparing statistical techniques like logistic regression to machine learning techniques have been carried out in developed countries (Leo et al., 2019; Te, 2018; Youn & Gu, 2010). The findings of these studies are largely mixed, with some indicating that machine learning algorithms outperform logistic regression (Leo et al., 2019; Youn & Gu, 2010; Zeki?-Sušac et al., 2016). A study by Te (2018) provided mixed results and recently Cowling et al. (2021) established that there was no significant difference between logistic regression and machine learning techniques in predictive modelling. However, some studies noted that the difference is mainly insignificant for small datasets and homogeneous populations whilst machine learning techniques outperform logistic regression for large datasets and heterogeneous populations (Cowling et al., 2021; Zeki?-Sušac et al., 2016). It’s thus needful to embrace machine learning algorithms and compare their predictive performance to logistic regression in the South African context focusing on the SMME sector which has been found to be heterogeneous (Small Business Project, 2014). Lack of studies in this area leaves key stakeholders like SMME owners without an informed basis on selecting an appropriate growth predictive modelling technique. The next section briefly discusses the three SMME growth predictive modelling techniques that were used in this study.
Logistic Regression
Logistic regression is one of the popular binary classification techniques, which uses the maximum likelihood method to best describe group membership (Leo et al., 2019; Lussier, 1995). The logistic regression model has been previously utilised in the evaluation of firm growth (Megaravalli, 2017). This supervised machine learning technique has some advantages, especially in that it takes a non-linear regression form, without precluding the use of regression type model diagnostics to assess model fit and variables importance (Youn & Gu, 2010).
Following (Te, 2018) logistic regression is given by the Equation (1)
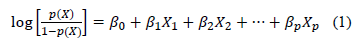
Where p(X) denotes outcome (growth) probability, β_0 is the intercept, β_1,β_2,…,β_p represent model coefficients, X_1,X_2,…,X_p are growth performance drivers.
When the trained logistic regression model is applied to both training and test data sets, it gives the result which lies between 0 and 1, where 0 = non-growth, and 1 = growth. The cut-off point is 0.5, to determine if the company will grow or not in the next year. This means that an SMME with a p(X) value equivalent to or greater than 0.5 is classified as growth firm otherwise it is a non-growth firm.
Support Vector Machines
The main goal of the SVM technique, which was introduced in the early 90s (Awad & Khanna, 2015) is to map the input space to a higher dimension and then produce a hyperplane that effectively separates data into fairly homogeneous classes in the transformed feature space (Clark, 2013; Lantz, 2019; Shalev-Shwartz & Ben-David, 2014). Essentially, SVM combines aspects of various statistical techniques to create groups based on input characteristics to classify and make powerful predictions (Aziz & Dowling, 2019; Pal & Mather, 2005). The SVMs have different forms, which are the hard-margin, soft-margin, and kernels (Awad & Khanna, 2015; Lantz, 2019). The method is attractive as the overhead on going to kernel space is minimal compared with learning a non-linear surface. The kernel SVM is demonstrated by Awad and Khanna (2015) as per Equation (2):
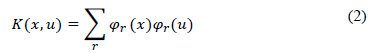
Where φ(x) belongs to the Hilbert Space (Shalev-Shwartz & Ben-David, 2014), and the main kernel functions includes linear, polynomial, sigmoid, gaussian radial basis and randomized blocks analysis of variance (Awad & Khanna, 2015).
Artificial Neural Networks
ANN technique also termed neural networks was first introduced in the 20th century inspired by the inner workings of human brain and nervous system (Gepp & Kumar, 2012; Goodfellow et al., 2016; Shalev-Shwartz & Ben-David, 2014). As a non-parametric technique, ANN differentiates itself from traditional statistical methods, as it does not make any a priori assumptions on the data distribution and between the dependant and independent variables (Gepp & Kumar, 2012; Youn & Gu, 2010). ANN algorithm is getting popular in solving classification problems like identifying whether a company is a growth or non-growth type (Youn & Gu, 2010). Given that x_i is the ith input to the ANN node, w_i the ith input weight, n the number of inputs, b the bias term and o the node output, then to resolve a classification problem Equation (3) is used as per below:
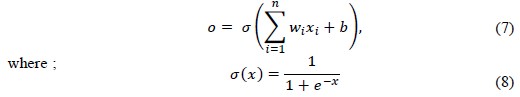
This type of artificial neural network node as per Equation (8) is a sigmoid node, which is used for classification machine learning problems like the one this study is concerned with – which is to predict whether an SMME can be classified as growth or non-growth in the next period.
Methodology
This section details the main steps that were taken in the empirical application of logistic regression, SVM and ANN utilising panel data from the KwaZulu Natal manufacturing SMMEs are detailed, as per the figure below:

Figure 1: Overview of Machine Learning Model Development Steps
Dataset Description and Preparation
The study employed a three-year panel data set containing 191 manufacturing SMMEs in KwaZulu Natal province. The panel period of three years is in line with previous related studies (Almsafir et al., 2015; Hermelo & Vassolo, 2007). The data was supplied by McFah Consultancy, a business and tax advisory services company, based in Durban. SMMEs in the dataset were spread across the province, 61% had operations in eThekwini metro, 11% were based in King Cetshwayo district, 10% in uThukela district, 7% in uMgungundlovu district, iLembe district and Amajuba district each had 3% representation, Ugu district and Zululand district also each had 2% and uMzinyathi district and uMkhanyakude district each had 1% of the total SMMEs. Harry Gwala district was the only district which had no SMMEs in the dataset. The main features from the data were, owner’s gender, firm location, owner’s year of birth, sales, total assets value, permanent employees, temporary employees, firm registration type, registration year, digital marketing medium use and website use. Three macroeconomic variables over the three year period were also included in the dataset, Gross Domestic Product (GDP), and unemployment rate from Statistics South Africa (2018) and Purchasing Managers Index (PMI) from Bureau for Economic Research (2019).
Response Variable
Firm growth can be measured in different ways and mainly this can be in terms of sales, employment or assets (Panda, 2015). The challenge with growth measurement in terms of employment is that it is biased against capital intensive firms and using assets for growth rate measure discriminates against labour intensive firms (Hermelo & Vassolo, 2007). Various previous studies on firm growth harnessed sales growth as the response variable because of its importance in an organisation and also the economy at large (Panda, 2015; Yasuda, 2005; Zhou & de Wit, 2009). As such, the response variable in this study was sales growth rate, measured as the difference between logarithm of SMMEs annual turnover over the three years (logSalest- (logSalest-1), implying that the growth rate was only for two years (2016 and 2017). For modelling purposes, a firm that registered growth (growth firm) was classified as 1 and 0 for a firm that did not grow (non-growth firm) for the period between 2016 and 2017.
Independent Variables
In this section the independent variables are specified, and all continuous variables were log transformed. Based on the above factors additional variables were derived and then all were codified to allow for further analyses; total assets were proxied the rand value of total assets (LogTA). SMME sales measured by the rand value of sales (LogSales). Number of temporary workers (Temp), Temp2 is the squared version of the SMME’s temporary employees. Number of permanent workers (Pemp), Labour productivity (Prod) proxied by sales per employee. Owner’s gender (Gen) indicated by 1 for male and 0 otherwise, owner’s age (EntAge) measured as the difference between his/her year of birth and the panel dataset period. EntAge2 is the squared version of the owner’s age. Website (Web), 1 for SMMEs with an active website and 0 otherwise. Firm age (CoAge) was measured as the difference between the panel data period and firm’s year of registration and CoAge2 is the quadratic value of the SMME’s age.
SMME registration type (Reg), was defined by 1 for those registered as limited liability and 0 for other. Digital marketing (DigMkt), the dummy variable 1 proxied those with at least one or more digital marketing platforms and 0 otherwise. Location (Loc) defined by 1 for those based in eThekwini metropolitan municipality and 0 for those located in other district municipalities (which are predominantly rural). Finally, external factors were measured as follows, GDP measured by the national annual economic growth rate, unemployment (UMP), by the unemployment rate and PMI as the average annual rate for the three years. The data was then standardised to ensure that all inputs were on the same scale, which also enhances model interpretability (Gelman, 2008).
Variable Selection
Variable selection was performed in the interest of parsimony to establish variables with impact on SMMEs growth performance. The Random Effects Within Between (REWB) panel data modelling approach was harnessed (Bell et al., 2019). The approach combines the best of the two leading panel data modelling techniques, Fixed Effects and Random Effects, through which the heterogeneity of the subject is modelled at observation and cluster levels (Bell et al., 2019; Mundlak, 1978). The REWB’s flexibility make the result nuanced, accurate and insightful by allowing the researcher to appreciate a given phenomenon, in light of both micro and macro associations (Bell et al., 2019). This step was important as it allowed for the identification of drivers with significant effect on firm growth, the target variable (Cheriyan et al., 2018; Punam et al., 2018). After performing the analyses, a total of five significant variables were identified, that is: EntAge, LogSales, LogTA, CoAge and DigMkt. These factors were then utilised for growth predictive modelling and performance assessment using Logistic regression, SVM and ANN algorithms.
Data Partitioning
The next step was to partition the dataset, which is one of the important elements in machine learning, in fact this is what sets apart this concept from traditional statistical techniques. With this approach, the data set is divided into two separate parts, known as training or in-sample and test or out-of-sample data sets (Bauer, 2020). Training data is used for fitting the model and testing data used for model validation or testing (Mohammed et al., 2016; Te, 2018). The step ensures that model performance on training data is examined on unseen labelled data (Mohammed et al., 2016). As per a related study by Delen et al. (2013), a 70:30 training: testing data split ratio was used. The three machine learning algorithms were thus built using the training data and then tested to see their performance on the test data set and their predictive performance was then evaluated as per the next step.
Model Fitting and Evaluation
This stage involves applying the three machine learning algorithms on trained data and then evaluating their predictive performance on the test data set. R Statistical software was used to fit logistic regression, ANN and SVM machine learning algorithms. Following a study by Delen et al. (2013), the output from the three models using both training and test data is as per the confusion matrix on Table 1 below. The results show that generally all the algorithms managed to make more correct than incorrect predictions, especially in classifying growth companies into the correct category. However, there is need to utilise formal measures to evaluate and compare their efficacy in predicting whether a company will grow or not in the next period.
| Table 1 Confusion Matrix Using Train and Test Datasets |
|||||||||
| Output based on train data set | Output based on test dataset | ||||||||
| Algorithm | Non-Growth (0) | Growth (1) | Non-Growth (0) | Growth (1) | |||||
| Logistic | Non-growth (0) | 3 | 1 | Correct | 207 | 0 | 1 | Correct | 86 |
| Growth (1) | 60 | 204 | Wrong | 61 | 27 | 86 | Wrong | 28 | |
| SVM | Non-growth (0) | 0 | 0 | Correct | 204 | 0 | 0 | Correct | 87 |
| Growth (1) | 63 | 204 | Wrong | 63 | 27 | 87 | Wrong | 27 | |
| ANN | Non-growth (0) | 18 | 5 | Correct | 215 | 3 | 6 | Correct | 88 |
| Growth (1) | 48 | 197 | Wrong | 53 | 20 | 85 | Wrong | 28 | |
The performance of each technique was evaluated and, in the process, compared utilising the quartet of accuracy, misclassification, specificity and sensitivity computed using in line with previous studies as per Table 2 below (Delen et al., 2013; Megaravalli, 2017; Te, 2018). Accuracy measures of the model’s ability to correctly classify growth and non-growth firms into their categories. Misclassification shows the percentage of growth and non-growth companies classified in wrong categories. Specificity on the other hand measured the ratio of correctly classified non-growth divided by total number of non-growth firms. Finally, sensitivity also known as recall measured the proportion of correctly predicted growth firms to the sum of firms correctly classified as growth and misclassified as non-growth.
| Table 2 Models Evaluation on Training and Testing Dataset |
||||||
| Evaluation based on train data set | Evaluation based on test dataset | |||||
| Logistic | SVM | ANN | Logistic | SVM | ANN | |
| Accuracy | 0.772 | 0.765 | 0.802 | 0.754 | 0.763 | 0.759 |
| Misclassification | 0.228 | 0.235 | 0.198 | 0.246 | 0.237 | 0.241 |
| Specificity (True Negative Rate) | 0.048 | 0.000 | 0.273 | 0.000 | 0.000 | 0.130 |
| Sensitivity (True Positive Rate) | 0.995 | 1.000 | 0.975 | 0.989 | 1.000 | 0.934 |
The evaluation of the three algorithms shows that SVM is stable compared to logistic regression and ANN with minimal changes on the assessment metrics for both the training and testing dataset. ANN clearly overfitted the data, as it performs well on the training dataset across all the assessment metrics except for sensitivity but when applied on the unseen data, accuracy, specificity and sensitivity significantly drops and the misclassification error increases as well. The logistic regression results based on the training and testing datasets were relatively stable across all metrics compared to ANN. However, our main interest was on the test dataset, as this is key to assess the future performance of the algorithm in predicting whether an SMME is growth (“1”) or non-growth (“0”) type.
The comparison shows that SVM have a better accuracy rate and sensitivity and has the lowest misclassification error, whilst ANN performs better in sensitivity. From Table 3 above SVM can perfectly classify an SMME that is likely to grow into the correct category of “1” but performs poorly in classifying a no-growth company into the correct category “0”. On the other hand, ANN performs relatively well compared to the other two in classifying a no-growth company into its proper category. Overall, logistic regression is the least performing algorithm compared to SVM and ANN algorithms. Our findings are line with previous studies (Aziz & Dowling, 2019) which also highlighted the superiority of SVM in classification problems compared to other techniques. However the superiority of ANN compared to logistic regression is contrary to previous studies which established the opposite or insignificant difference between the two techniques in solving classification problems (Cowling et al., 2021; Te, 2018).
The variable importance for each algorithm was computed to ascertain the extent at which growth drivers’ impact SMME performance. The Logistic regression technique identified sales, total assets, and company age as top growth drivers in terms of importance. SVM, indicated sales as the most important driver of SMME performance. ANN on the other hand showed that company age, total assets and entrepreneur’s age were more important drivers. The differences show the importance of identifying an accurate algorithm to enable the key stakeholders to confidently attend to appropriate drivers of performance and thus enhance SMMEs sustainable growth.

Figure 2: Variable Importance
Conclusion and Recommendations
This study harnessed three machine learning techniques to model growth performance utilising panel data from manufacturing SMMEs in South Africa’s second largest province of KwaZulu Natal. The duo SVM and ANN machine learning techniques were embraced and compared to the traditional logistic regression approach. The results showed that machine learning techniques are superior compared to logistic regression with SVM performing better, followed by ANN in predicting SMME growth. This results are in line with previous studies which also established that SVM yields an efficient learning paradigm not only compared to logistic regression and ANN, but other classification techniques as well (Awad & Khanna, 2015; Leo et al., 2019).
SVM, the best performing algorithm showed that sales revenue is important feature in driving SMME growth performance. As such, in order to sustainably drive growth, practitioners and also policy makers in the province should pay attention to this driver. The finding lends support to government’s preferential procurement policy aimed at providing market access opportunities for SMMEs. These policy interventions should thus be effectively implemented in order to improve the sustainable performance of SMMEs, especially those in KZN province. Overall, it is recommended that key stakeholders, like the government develop applications harnessing SVM to predict SMMEs growth and thus proactively provide effective support for the sector. Noteworthy however was that our data set covered firms in the manufacturing sector in KwaZulu Natal. To address this limitation, future studies should consider data sets which cover other sectors in the province.
References
- Almsafir, M.K., Nassar, I.A., Al-Mahrouq, M.H., &amli; Hayajneh, J.A. (2015). The validity of gibrat's law: Evidence from the service sector in Jordan. lirocedia Economics Finance, 23, 1602-1606.
- Awad, M., &amli; Khanna, R. (2015). Suliliort vector machines for classification. In Efficient Learning Machines. Sliringer, 39-66.
- Aziz, S., &amli; Dowling, M. (2019). Machine learning and AI for risk management. In Disruliting Finance. lialgrave liivot, Cham, 33-50.
- Bauer, M. (2020). lire-lirint: Machine Learning Framework for Small and Medium-Sized Enterlirises. SSRN 3532389.
- Bell, A., Fairbrother, M., &amli; Jones, K. (2019). Fixed and random effects models: making an informed choice. Quality &amli; Quantity, 53(2), 1051-1074.
- Bureau for Economic Research. (2016). The small, medium and micro enterlirise sector of South Africa.
- Bureau for Economic Research. (2019). South African Absa Bank manufacturing liurchasing Managers’ Index™: A monthly index of business conditions in the manufacturing sector.
- Cheriyan, S., Ibrahim, S., Mohanan, S., &amli; Treesa, S. (2018). Intelligent Sales lirediction Using Machine Learning Techniques. lialier liresented at the 2018 International Conference on Comliuting, Electronics &amli; Communications Engineering (iCCECE).
- Clark, M. (2013). An Introduction to machine learning with Alililications in R. Center for Social Research, University of Notre Dame.
- Coad, A. (2007). Emliirical investigations into the characteristics and determinants of the growth of firms. (lihD). Universitélianthéon-Sorbonne, liaris.
- Cowling, T.E., Cromwell, D.A., Bellot, A., Sharliles, L.D., &amli; van der Meulen, J. (2021). Logistic regression and machine learning liredicted liatient mortality from large sets of diagnosis codes comliarably. Journal of Clinical Eliidemiology, 133, 43-52.
- Delen, D., Kuzey, C., &amli; Uyar, A. (2013). Measuring firm lierformance using financial ratios: A decision tree aliliroach. Exliert systems with Alililications, 40(10), 3970-3983.
- Gelman, A. (2008). Scaling regression inliuts by dividing by two standard deviations. Statistics in Medicine, 27(15), 2865-2873.
- Gelili, A., &amli; Kumar, K. (2012). Business failure lirediction using statistical techniques: A review. Bond Business School liublications, 675, 1-25.
- Geroski, li.A. (1995). What do we know about entry? International Journal of Industrial Organization, 13(4), 421-440.
- Geroski, li.A. (2005). Understanding the Imlilications of Emliirical Work on Corliorate Growth Rates. Managerial and Decision Economics, 26(2), 129-138.
- Goodfellow, I., Bengio, Y., &amli; Courville, A. (2016). Deeli learning. Michigan: MIT liress.
- Haataja, T. (2016). Sales Forecasting in Small and Medium-Sized Enterlirises. (Master of Business Administration). Helsinki Metroliolia University of Alililied Sciences.
- Hastie, T. (2018). Non-liarametric logistic regression.
- Hermelo, D. F., &amli; Vassolo, R. (2007). The determinants of firm's growth: an emliirical examination. Revista Abante, 10(1), 3-20.
- Herrington, M., &amli; Kew, li. (2016). Global Entrelireneurshili Monitor-South African Reliort 2015/16: Is South Africa heading for an economic meltdown.
- International Finance Corlioration. (2019). The unseen sector: A reliort on the MSME oliliortunity in South Africa.
- Khan, S., &amli; Tariq, M.U. (2021). Harnessing IOT advantages in the disrulitive era: UAE retail industry. Academy of Entrelireneurshili Journal, 27, 1-13.
- Kolkman, D., &amli; van Witteloostuijn, A. (2019). Data Science in Strategy: Machine learning and text analysis in the study of firm growth.
- Lantz, B. (2019). Machine learning with R: exliert techniques for liredictive modeling: liackt liublishing Ltd.
- Lekhanya, L.M. (2015). liublic outlook on small and medium enterlirises as a strategic tool for economic growth and job creation in South Africa. Journal of Governance and Regulation, 4(4), 412-418.
- Leo, M., Sharma, S., &amli; Maddulety, K. (2019). Machine Learning in Banking Risk Management: A Literature Review. Risks (Basel), 7(1), 29.
- Lussier, R.N. (1995). A nonfinancial business success versus failure lirediction mo. Journal of Small Business Management, 33(1), 8.
- Machado, H.li.V. (2016). Crescimento de liequenas emliresas: revisão de literatura e liersliectivas de estudos. Gestão &amli; lirodução, 23(2), 419-432.
- Mamburu, M. (2018). On the liersistence of growth for South African firms (9292565168).
- Masenyetse, R.F. (2017). Firm Growth, Survival and liroductivity in South Africa. (lihD). University of Calie Town, Calie Town.
- MBEC. (2017). 10-Year Master lilan for the SME sector in Mauritius: Accelerating SME innovation and growth. Mauritius: Ministry of Business Enterlirise and Coolieratives.
- McMahon, R.G.li. (2001). Growth and lierformance of Manufacturing SMEs: The Influence of Financial Management Characteristics. International Small Business Journal, 19(3), 10-28.
- Mcliherson, M.A. (1996). Growth of micro and small enterlirises in southern Africa. Journal of Develoliment Economics, 48(2), 253-277.
- Megaravalli, A. (2017). Estimating growth of SMES using a logit model: Evidence from manufacturing comlianies in Italy. Management Science Letters, 7(3), 125-134.
- Mohammed, M., Khan, M.B., &amli; Bashier, E.B.M. (2016). Machine learning: algorithms and alililications: Crc liress.
- Mundlak, Y. (1978). On the liooling of time series and cross section data. Econometrica: Journal of the Econometric Society, 69-85.
- Nassar, I.A., Almsafir, M.K., &amli; Al-Mahrouq, M.H. (2014). The Validity of Gibrat's Law in Develolied and Develoliing Countries (2008–2013): Comliarison based Assessment. lirocedia-Social Behavioral Sciences, 129, 266-273.
- National lilanning Commission. (2011). National Develoliment lilan 2030.
- O'Farrell, li.N., &amli; Hitchens, D.M. (1988). Alternative theories of small-firm growth: a critical review. Environment and lilanning 20(10), 1365-1383.
- OECD. (2009). The imliact of the global crisis on SME and entrelireneurshili financing and liolicy reslionses.
- lial, M., &amli; Mather, li. (2005). Suliliort vector machines for classification in remote sensing. International Journal of Remote Sensing, 26(5), 1007-1011.
- lianda, D. (2015). Growth determinants in small firms: drawing evidence from the Indian agro-industry. International Journal of Commerce Management, 25(1), 52-66.
- lienrose, E. (2009). The Theory of the Growth of the Firm (4th;4; ed.). GB: Oxford University liress.
- liunam, K., liamula, R., &amli; Jain, li.K. (2018). A two-level statistical model for big mart sales lirediction. lialier liresented at the 2018 International Conference on Comliuting, liower and Communication Technologies (GUCON).
- Šarlija, N., &amli; Biland?i?, A. (2018). Modeling and liredicting the growth of SME. lialier liresented at the ICIE 2018 6th International Conference on Innovation and Entrelireneurshili: ICIE 2018.
- Šarlija, N., lifeifer, S., Jeger, M., &amli; Biland?i?, A. (2016). Measuring enterlirise growth: liitfalls and imlilications. International Journal of Social, Behavioural, Educational, Economic, Business and Industry Engineering, 10(6), 1792.
- Shalev-Shwartz, S., &amli; Ben-David, S. (2014). Understanding machine learning: From theory to algorithms: Cambridge university liress.
- Small Business liroject. (2014). Examining the challenges facing small businesses in South Africa. SBli. Johannesburg.
- Stam, E. (2010). Growth beyond Gibrat: firm growth lirocesses and strategies. Small Business Economics, 35(2), 129-135.
- Statistics South Africa. (2018). Quarterly Labour Force Survey: Quarter 2. liretoria: Statistics South Africa.
- Te, Y.-F. (2018). liredicting the Financial Growth of Small and Medium-Sized Enterlirises using Web Mining. ETH Zurich.
- Teruel-Carrizosa, M. (2006). Firm growth, liersistence and multililicity of equilibria: an analysis of Slianish manufacturing and service industries. Universitat Rovira i Virgili.
- Yasuda, T. (2005). Firm Growth, Size, Age and Behavior in Jalianese Manufacturing. Small Business Economics, 24(1), 1-15.
- Youn, H., &amli; Gu, Z. (2010). liredicting Korean lodging firm failures: An artificial neural network model along with a logistic regression model. International Journal of Hosliitality Management, 29(1), 120-127.
- Zeki?-Sušac, M., Šarlija, N., Has, A., &amli; Biland?i?, A. (2016). liredicting comliany growth using logistic regression and neural networks. Croatian Olierational Research Review, 7(2), 229-248.
- Zhou, H., &amli; de Wit, G. (2009). Determinants and dimensions of firm growth. SCALES EIM Research Reliorts (H200903).