Research Article: 2024 Vol: 28 Issue: 5
Commercial Banks performance in emerging markets: New evidence from the MENAP region
Anas Azzabi, The Higher Institute of Commerce and Business Administration
Younès Lahrichi, The Higher Institute of Commerce and Business Administration
Citation Information: Azzabi, A. & Lahrichi, Y. (2024). Commercial banks’ performance in emerging markets: New evidence from the MENAP region. Academy of Accounting and Financial Studies Journal, 28(5), 1-21.
Abstract
Bank performance is an important topic for both professionals and researchers. The purpose of this paper is to study the main determinants of commercial bank performance in emerging markets, specifically the Middle East, North Africa and Pakistan region (MENAP, henceforth). To acquire a deeper understanding of this topic, our research uses the data of 56 stock-listed banks in 7 MENAP countries between 2015 and 2022. This study documents that bank size, operation inefficiency, the GDP growth rate, broad money growth rate, bank accounts’ growth rate, cashless payments, and the percentage of the population with access to the internet are the main determinants of commercial bank performance in the MENAP region. This paper aims to contribute to the literature surrounding the topic of commercial bank performance. It sheds light on the MENAP region banking sector, which has not been sufficiently studied. Our research includes data from before and after the COVID-19 recession to provide recent, relevant and holistic insight. Moreover, this study investigates the impact of digitalisation on commercial bank performance via multiple proxies
Keywords
Commercial Bank, Performance, Menap, Digitalisation, Emerging Markets.
JEL classification
G21
Introduction
Banks are detrimental to the development of economic and financial growth. The latter optimally occurs in a context where financial services create capital and ensure financial stability. Therefore, the performance of banks is a critical topic for both professionals and academicians. Consequently, it needs up-to-date research to enrich and complement the current literature (Azzabi & Lahrichi, 2023).
Bank performance can be defined as a bank’s capacity to achieve its objectives, generate value for its stakeholders and outperform its competitors (Chenini & Jarboui, 2018). It is commonly measured by the return on equity (ROE, henceforth) or the return on assets (ROA, henceforth). It is affected by multiple factors of different types, such as bank-specific, macroeconomic, industry-related and technology-driven factors.
The topic of bank performance determinants has gained increasing academic interest since the subprime mortgage crisis and the empowerment of FinTech firms and digital financial technologies as of 2015 (Alam et al., 2021).
Investing in financial technology solutions, information and communication technologies (ICT, henceforth) and digitalisation in general has become a key success factor in the banking sector. Our research includes bank-specific, macroeconomic and digital systematic determinants. We rely on the latter to capture the effect of digitalisation and bridge the gap in the literature (Azzabi & Lahrichi, 2023).
Our paper aims to provide further knowledge on the main determinants of commercial bank performance. To meet this objective, the present paper answers the following questions;
1. What are the main bank-specific factors of commercial bank performance in the MENAP region?
2. What are the main macroeconomic factors of commercial bank performance in the MENAP region?
3. What are the main digital systematic factors of commercial bank performance in the MENAP region?
4. What is their impact on commercial banks’ performance?
The remainder of this paper is structured as follows: section 2 presents the review of the literature and the hypotheses development. Section 3 presents the empirical methodology. Section 4 presents the empirical analysis. Section 5 discusses the results of the empirical study. Section 6 concludes.
Literature Review and Hypothesis Development
This section presents a review of the relevant literature on the factors of commercial bank performance. It is segmented by type of factor, i.e. bank-specific factors, macroeconomic factors and digital systematic factors. Each factor will be associated with a hypothesis to guide our empirical research endeavours.
Bank-Specific Factors
This subsection discusses the bank-specific factors of commercial bank performance.
Bank size
A large-sized bank usually has easier access to the market and a higher capacity to generate economies of scale. This is why numerous authors believe that size is a positive determinant of bank performance (Bonin et al., 2005; Athanasoglou et al., 2006; Jara-Bertin et al., 2014; Menicucci & Paolucci, 2016; Bahyaoui, 2017; Chouikh & Blagui, 2017; Elouali & Oubdi, 2018; Almoneef & Samontaray, 2019; Akoi & Andrea, 2020; Jreisat & Bawazir, 2021).
However, a few authors have found that size had a negative impact on commercial banks’ performance (Seiford & Zhu, 1999; Bahyaoui, 2017; Derbali, 2021; Al-Matari, 2023), or even no impact at all (Berger & Mester, 1997; Anarfi et al., 2016).
In light of the contrasting findings, this paper investigates the impact of size on bank performance via the following hypothesis:
H1: Bank size has an impact on commercial bank performance, conveyed by the effect on the ROE.
Loan Growth
A bank’s main function in an economy is to finance other economic agents with capital. Many authors’ findings point out that positive loan growth predicts higher bank performance (Sufian & Habibullah, 2009; Dang, 2019).
However, excessive lending can result in risky outcomes. A significant body of research claims that the more a bank lends, the higher its credit risk and the lower its credit standards (Fahlenbrach et al., 2016; Kupiec et al., 2017; Naili & Lahrichi, 2022).
In light of the contrasting findings, this paper investigates the impact of loan growth on bank performance via the following hypothesis:
H2: Loan growth has an impact on bank performance, conveyed by the effect on the ROE.
Non-performing loans
The literature demonstrates that non-performing loans have a negative impact on commercial bank performance (Ghosh, 2015; Naili & Lahrichi, 2022). Since NPLs represent loans that are unlikely to be repaid, a higher NPL ratio suggests a lower interest income and a higher credit risk. NPLs are among the main catalysts of financial crises, such as the subprime crisis of 2008.
However, some authors suggest situations where NPLs can have a positive impact on commercial bank performance on the short-run (Rajan, 1994; García-Marco & Robles-Fernández, 2008). The literature also suggests that NPLs’ negative impact can be offset by adequate credit management strategies such as factoring or contracting credit default swaps (Sebayang, 2020).
In light of the contrasted findings, this paper investigates the impact of inefficiency on bank performance via the following hypothesis:
H3: Non-performing loans have an impact on commercial bank performance, conveyed by the effect on the ROE.
Operation inefficiency
The literature overwhelmingly agrees that efficiency is an indicator that enhances bank performance (Pasiouras & Kosmidou, 2007; Bahyaoui, 2017; Otero et al., 2020; Isnurhadi et al., 2021). The more efficient the bank is, the higher its profits and the lower its costs. However, a few authors, such as Chouikh & Blagui (2017) claim that efficiency is statistically insignificant with respect to bank performance.
In light of the findings of the literature, this paper investigates the impact of operation inefficiency on bank performance via the following hypothesis:
H4: Operation inefficiency has a negative impact on commercial bank performance, conveyed by the effect on the ROE.
Macroeconomic Factors
This subsection details the macroeconomic determinants of bank performance.
GDP growth rate
The sampled literature mostly shows that the gross domestic product (GDP, henceforth) growth rate has a positive effect on bank performance (Sufian & Habibullah, 2009; Jara-Bertin et al., 2014; Caporale et al., 2015; Chen & Lu, 2020; Jreisat & Bawazir, 2021). Economic agents exhibit better performance in economic expansion versus those in economic recession. However, some authors, like Pasiouras & Kosmidou (2007) and Chouikh & Blagui (2017) suggest that the GDP growth rate has an adverse effect on bank performance. Alternatively, Derbali (2021) and Isnurhadi et al. (2021) show that GDP growth is statistically insignificant with respect to the latter.
In light of the contrasting findings, this paper investigates the impact of GDP growth on bank performance via the following hypothesis:
H5: GDP growth has a positive impact on commercial bank performance, conveyed by the effect on the ROE.
Broad Money Growth Rate
Broad money refers to the amount of money circulating within an economy. It is intricately linked to central bank policies to affect the money supply, interest rates and inflation (Modigliani et al., 1970). The relevant literature shows that broad money growth has a positive and significant effect on bank performance and economic growth (Ifionu & Akinpelumi, 2015; Suoyai et al., 2018).
This paper investigates the impact of broad money growth on bank performance via the following hypothesis:
H6: Broad money has an impact on commercial bank performance, conveyed by the effect on the ROE.
Digital Systematic Factors
Banks relied on their clients’ physical presence to offer them banking services. However, the COVID-19 regression has accelerated the development of digitalisation in the banking industry. Therefore, an argument could be made that digitalisation helped sustain the economy during the previously mentioned crisis.
With heavily restricted movement worldwide, banks and their clients had to resort to digitalisation, which is now a key success factor for banks. Consequently, banks are endeavouring to keep up with the latest technologies by investing in financial technology solutions.
The findings regarding digitalisation are quite contrasted. Forcadell et al. (2020) claim that digitalisation is not a significant determinant of bank performance on its own. It requires the support of relevant corporate sustainability policies. Wang et al. (2022) and Coryanata et al. (2023) affirm that digitalisation has a negative impact on the financial performance of banks. The former recommend exercising caution when investing in banking companies that use financial technologies. Whereas Potapova et al. (2022) have determined that digital maturity is a competitive advantage for Russian commercial banks. Therefore, it has a positive impact on the former’s performance.
Digitalisation and its effects are inherently hard to observe. On that account, we rely on the following proxies to gauge the impact on commercial bank performance:
a. Bank accounts’ growth rate1 (Shihadeh, 2021)
b. Cashless payments 2 (Lu et al., 2022; Mohammed et al., 2022)
c. Credit cards’ growth rate (Sinkey & Nash, 1993; Chen & Tseng, 2005)
d. Percentage of the population with access to the internet (Malhotra & Singh, 2009; Tunay et al., 2015)
e. Cellular mobile subscriptions growth rate.
These proxies are related to the three foundational pillars of the digital economy: infrastructure, payments and regulations (Cusolito et al., 2022).
This paper investigates the impact of digitalisation on bank performance via the following hypotheses:
H7: Bank accounts’ growth rate has an impact on commercial bank performance, conveyed by the effect on the ROE.
H8: Cashless payments have an impact on commercial bank performance, conveyed by the effect on the ROE.
H9: Credit cards’ growth rate has an impact on commercial bank performance, conveyed by the effect on the ROE;
H10: The percentage of the population with access to the internet has an impact on commercial bank performance, conveyed by the effect on the ROE;
H11: Cellular mobile subscriptions growth rate has an impact on commercial bank performance, conveyed by the effect on the ROE.
Empirical Methodology
This section discusses the empirical methodology by tackling three sub-sections. It presents this research’s data, defines the variables, and provides details pertaining to the latter.
Sample and Data
We have sampled a total of 56 banks from 7 MENAP countries (8 banks per country): Morocco, Egypt, Tunisia, Jordan, Turkey, the United Arab Emirates and Pakistan. The period covers the years 2015 up to 2022. The data has been extracted using the official annual reports of the sampled banks, the World Bank’s official open database and the IMF financial access survey.
Variable Definition
This subsection discusses the dependent and independent variables of this empirical study.
Dependent variable
Commercial bank performance will be measured by the return on equity (ROE) to express the (Ghosh, 2015; Naili & Lahrichi, 2022).
Independent variables
This subsection discusses the independent variables and the proxies to measure them.
Bank-specific factors
The retained bank-specific determinants of commercial bank performance are the following;
a. Bank size: natural logarithm of the bank’s total assets (Alper & Anbar, 2011; Berger & Bouwman, 2013; Islam & Nishiyama, 2016; Jarbou et al., 2018).
b. Loan growth: Current year’s loan’s growth compared to the previous year’s (Naili & Lahrichi, 2022)
c. NPL ratio: Non-performing loans to total loans ratio (Ghosh, 2015; Naili & Lahrichi, 2022).
d. Operation inefficiency: Operation expenses to operation income ratio (Dietrich & Wanzenried, 2014; Saleh & Abu Afifa, 2020; Isnurhadi et al., 2021).
Macroeconomic factors
The retained macroeconomic determinants of commercial bank performance are the following;
a. GDP growth rate: Yearly growth rate of GDP (Pasiouras & Kosmidou, 2007; Sufian & Habibullah, 2009; Caporale et al., 2015; Chouikh & Blagui, 2017).
b. Broad money growth rate: Yearly growth rate of the broad money supply.
Digital systematic factors
The retained digital determinants of commercial bank performance are the following;
a. Bank accounts’ growth rate (Shihadeh, 2021).
b. Cashless payments (Lu et al., 2022; Mohammed et al., 2022).
c. Credit cards’ growth rate (Sinkey & Nash, 1993; Chen & Tseng, 2005),
d. The population percentage with access to the internet (Malhotra & Singh, 2009; Tunay et al., 2015).
e. Cellular mobile subscriptions growth rate.
Descriptive statistics
Table 1 presents the variables, their proxies and data sources. The explanatory variables (bank-specific, macroeconomic and digital systematic) have the same weight in the empirical study.
| Table 1 Variables’ Summary | |||
| Variables | Proxy | Symbol | Source |
| Dependent variable | |||
| Return on equity | 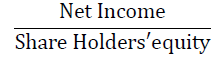 |
ROE | Authors’ calculations; Commercial banks’ official financial reports |
| Bank-specific variables | |||
| Bank size | ln (Total Assets) | SIZE | Authors’ calculations; Commercial banks’ official financial reports |
| NPL ratio | 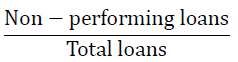 |
NPL | Authors’ calculations; Commercial banks’ official financial reports |
| Loan’s growth rate | Growth rate of loans between two consecutive years | ROE | Authors’ calculations; Commercial banks’ official financial reports |
| Operation inefficiency | 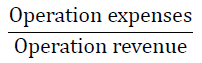 |
INEFF | Authors’ calculations; Commercial banks’ official financial reports |
| Macroeconomic variables | |||
| Gross domestic product growth rate | Growth rate of GDP between two consecutive years | GDP | World Bank |
| Broad money growth rate | Growth rate of broad money supply between two consecutive years | BMG | World Bank |
| Digital systematic variables | |||
| Bank accounts growth rate | Growth rate of the number of bank accounts between two consecutive years | ACCOUNT | World bank |
| Cashless payments | Cashless payments in a single year (in billion USD) | CP | Central banks’ official reports; Cashless payments organisations’ official reports |
| Credit cards growth rate | Growth rate of circulating credit cards between two consecutive years | CC | IMF Financial Access Survey |
| Percentage of the population with access to the internet | Yearly percentage of the population with access to the internet | INTERNET | World Bank |
| Mobile cellular subscriptions growth rate | Growth rate of mobile cellular subscriptions between two consecutive years | MOBILE | World Bank |
Table 2 presents a summary of the descriptive statistics:
| Table 2 Descriptive Statistics | ||||
| Variables | Mean | Std. Deviation | Min | Max |
| Return on equity | 11.50% | 6.64% | -3.56% | 28.99% |
| Bank-specific variables | ||||
| Bank size | 22.98 | 1.38 | 20.43 | 25.42 |
| Loans' growth rate | 12.92% | 11.01% | -4.17% | 51.74% |
| NPL ratio | 7.47% | 2.80% | 3.11% | 13.34% |
| Operation inefficiency | 49.29% | 7.78% | 30.03% | 61.26% |
| Macroeconomic variables | ||||
| GDP growth rate | 3.05% | 3.31% | -8.80% | 11.40% |
| Broad money growth rate | 12.48% | 11.60% | -0.04% | 60.34% |
| Digital systematic variables | ||||
| Bank accounts' growth rate | 7.97% | 5.42% | -6.37% | 32.07% |
| Cashless payments | 11.52 | 12.47 | 2.00 | 61.38 |
| Credit cards' growth rate | 7.12% | 8.20% | -16.85% | 35.65% |
| Percentage of the population with access to the internet | 63.91% | 24.83% | 11.00% | 100.00% |
| Cellular mobile subscriptions growth rate | 1.62% | 7.10% | -28.84% | 24.39% |
Table 3 presents the mean of each variable country-wise:
| Table 3 Countrywise Mean Statistics | ||||||||||||
| Country | ROE | SIZE | LOAN | NPL | INEFF | GDP | BMG | ACCOUNT | CP | CC | INTERNET | MOBILE |
| Morocco | 7.14% | 23.70 | 5.69% | 8.55% | 54.75% | 2.21% | 5.65% | 5.46% | 3.58 | 7.14% | 73.26% | 2.37% |
| Egypt | 22.04% | 24.10 | 21.51% | 6.63% | 55.29% | 4.66% | 21.29% | 13.07% | 9.32 | 9.24% | 55.55% | 1.15% |
| Jordan | 7.87% | 20.66 | 7.91% | 5.76% | 36.41% | 1.73% | 4.41% | 4.15% | 6.87 | 6.22% | 68.88% | -3.47% |
| Tunisia | 9.61% | 21.55 | 10.22% | 11.84% | 51.07% | 0.83% | 8.95% | 10.07% | 4.93 | 11.80% | 64.25% | 1.43% |
| Turkey | 10.20% | 24.58 | 23.46% | 4.81% | 51.62% | 4.95% | 30.38% | 10.11% | 36.27 | 7.33% | 70.50% | 2.90% |
| UAE | 8.15% | 23.65 | 6.12% | 6.71% | 42.31% | 2.73% | 5.34% | 4.78% | 10.93 | 5.16% | 96.75% | 2.37% |
| Pakistan | 15.50% | 22.62 | 15.54% | 7.98% | 53.56% | 4.23% | 11.33% | 8.16% | 8.74 | 2.94% | 18.21% | 4.60% |
Table 4 presents the standard deviation of each variable country-wise
| Table 4 Country Wise Standard Deviation | ||||||||||||
| Country | ROE | SIZE | LOAN | NPL | INEFF | GDP | BMG | ACCOUNT | CP | CC | INTERNET | MOBILE |
| Morocco | 2.65% | 1.06 | 7.51% | 5.90% | 8.68% | 4.20% | 1.59% | 2.53% | 0.01 | 80.16% | 2.06% | 1.73% |
| Egypt | 8.89% | 1.43 | 27.32% | 4.86% | 11.02% | 1.04% | 8.07% | 8.96% | 0.06 | 352.52% | 9.34% | 3.49% |
| Jordan | 3.75% | 1.79 | 13.33% | 2.86% | 10.53% | 1.29% | 2.71% | 3.84% | 0.08 | 429.60% | 2.28% | 16.18% |
| Tunisia | 7.41% | 1.00 | 13.28% | 6.34% | 18.77% | 3.80% | 2.01% | 47.21% | 0.03 | 124.46% | 1.71% | 7.55% |
| Turkey | 14.71% | 1.64 | 18.56% | 4.08% | 9.98% | 3.24% | 16.36% | 12.36% | 0.02 | 1585.43% | 2.39% | 3.93% |
| UAE | 13.64% | 1.39 | 15.42% | 3.73% | 17.08% | 3.85% | 2.10% | 13.55% | 0.05 | 562.38% | 5.62% | 4.02% |
| Pakistan | 5.94% | 0.67 | 18.67% | 5.18% | 12.53% | 2.48% | 2.39% | 6.79% | 0.06 | 229.53% | 1.16% | 7.37% |
Table 5 presents the mean of each variable year-wise:
| Table 5 Year Wise Mean Statistics | ||||||||||||
| Year | ROE | SIZE | LOAN | NPL | INEFF | GDP | BMG | ACCOUNT | CP | CC | INTERNET | MOBILE |
| 2015 | 13.25% | 22.68 | 12.09% | 8.48% | 46.40% | 4.57% | 10.20% | 6.20% | 5.28 | 8.52% | 49.00% | 3.53% |
| 2016 | 13.19% | 22.81 | 13.41% | 8.35% | 45.29% | 3.41% | 13.02% | 6.39% | 8.12 | 7.04% | 52.29% | -1.33% |
| 2017 | 11.89% | 22.82 | 16.68% | 7.62% | 50.01% | 3.71% | 9.76% | 10.23% | 7.80 | 7.66% | 57.49% | 2.77% |
| 2018 | 12.66% | 23.09 | 12.85% | 8.01% | 52.42% | 3.06% | 7.91% | 8.07% | 9.26 | 8.93% | 60.71% | -0.46% |
| 2019 | 9.12% | 22.85 | 8.49% | 8.47% | 52.40% | 2.56% | 11.41% | 9.56% | 11.36 | 3.93% | 66.86% | 0.13% |
| 2020 | 7.73% | 23.03 | 7.05% | 6.86% | 48.78% | -1.53% | 14.08% | 7.61% | 13.25 | 11.90% | 71.57% | -0.30% |
| 2021 | 10.33% | 23.21 | 17.41% | 6.31% | 49.38% | 5.12% | 15.40% | 6.41% | 17.51 | 5.27% | 75.29% | 4.80% |
| 2022 | 13.85% | 23.33 | 15.39% | 5.67% | 49.62% | 3.45% | 18.05% | 9.29% | 19.59 | 3.69% | 78.11% | 3.82% |
Table 6 presents the standard deviation of each variable year-wise:
| Table 6 Year Wise Standard Deviation | ||||||||||||
| Year | ROE | SIZE | LOAN | NPL | INEFF | GDP | BMG | ACCOUNT | CP | CC | INTERNET | MOBILE |
| 2015 | 7.25% | 1.27 | 9.63% | 3.33% | 8.99% | 2.25% | 5.59% | 3.21% | 3.32 | 5.06% | 23.93% | 10.19% |
| 2016 | 7.39% | 1.37 | 17.54% | 3.21% | 9.38% | 2.20% | 12.83% | 2.11% | 9.44 | 3.44% | 23.57% | 13.21% |
| 2017 | 5.19% | 1.29 | 8.59% | 2.55% | 8.84% | 2.18% | 7.17% | 5.40% | 6.88 | 6.89% | 24.43% | 3.09% |
| 2018 | 5.91% | 1.49 | 9.12% | 2.14% | 8.97% | 1.97% | 6.41% | 5.27% | 8.75 | 4.58% | 25.24% | 6.38% |
| 2019 | 7.85% | 1.39 | 4.37% | 2.92% | 7.21% | 1.82% | 7.71% | 10.79% | 11.32 | 15.36% | 25.73% | 5.80% |
| 2020 | 7.31% | 1.54 | 8.30% | 2.72% | 7.53% | 4.23% | 10.38% | 3.16% | 13.93 | 11.17% | 25.11% | 6.03% |
| 2021 | 3.88% | 1.58 | 14.83% | 2.58% | 7.08% | 3.06% | 16.96% | 5.94% | 17.63 | 4.40% | 25.47% | 2.97% |
| 2022 | 8.10% | 1.69 | 11.65% | 2.71% | 3.98% | 4.22% | 20.03% | 3.96% | 19.15 | 8.20% | 20.22% | 3.14% |
Figure 1 shows the evolution of the mean ROE throughout the MENAP region between 2015 and 2022:

Figure 1 Evolution of Commercial Banks’ Roe in the Menap Region (2015-2022)
Figure 2 shows the evolution of the mean yearly ROE for each country between 2015 and 2022:

Figure 2 Evolution of Mean Roe – Breakdown by Country (2015-2022)
The MENAP region’s average ROE between 2015 and 2022 amounted to 11.50%. Egypt exhibits the highest average ROE amongst the MENAP countries (22.04%), whereas Morocco exhibits the lowest value (7.14%). The MENAP region’s mean ROE decreased noticeably between 2019 and 2020. The same pattern can be observed in the loans and GDP growth rates, respectively. Incidentally, this marks the start of the COVID-19 pandemic’s spread, the onset of the subsequent economic recession, and the rise in power of FinTech firms and digital solutions in banking and finance. This is supported by an overall increase in cashless payments (5.28 to 19.59 billion USD), bank accounts’ growth rate (6.20% to 9.29%), and the percentage of the population with access to the internet (49% to 78.11%) throughout the sampled period. This could explain the subsequent increase in the ROE of the region, especially after the COVID-19 recession (from 7.73% by the end of 2020 to 13.85% by the end of 2022).
Empirical Analysis
This section presents the empirical analysis in three subsections; the dataset and reliability analysis, the empirical models and the empirical results.
Dataset and Reliability Analysis
The correlation and collinearity analysis consists of Pearson’s pairwise correlation matrix, the statistical tolerance and the variance inflation factor3 (VIF, henceforth). Cronbach’s alpha 4 is used to assess the data reliability.
Table 7 shows Pearson’s pairwise correlation matrix:
| Table 7 Pearson’s Pairwise Correlation Matrix | ||||||||||||
| 1 | 2 | 3 | 4 | 5 | 6 | 7 | 8 | 9 | 10 | 11 | 12 | |
| ROE | 1.0000 | |||||||||||
| SIZE | 0.2269 | 1.0000 | ||||||||||
| LOAN | 0.5217 | 0.3149 | 1.0000 | |||||||||
| NPL | - 0.0324 | - 0.3322 | - 0.1739 | 1.0000 | ||||||||
| INEFF | 0.2064 | 0.4850 | 0.2255 | 0.2684 | 1.0000 | |||||||
| GDP | 0.4392 | 0.2916 | 0.4154 | - 0.2476 | 0.1412 | 1.0000 | ||||||
| BMG | 0.4713 | 0.5255 | 0.7313 | - 0.2866 | 0.2771 | 0.3301 | 1.0000 | |||||
| ACCOUNT | 0.3430 | 0.1898 | 0.1493 | - 0.0351 | 0.4261 | 0.1523 | 0.3081 | 1.0000 | ||||
| CP | 0.0809 | 0.5080 | 0.4943 | - 0.4577 | 0.0971 | 0.2749 | 0.8002 | 0.1985 | 1.0000 | |||
| CC | - 0.0163 | - 0.0612 | 0.0434 | 0.1208 | - 0.0113 | - 0.1132 | - 0.0180 | 0.0386 | - 0.1355 | 1.0000 | ||
| INTERNET | - 0.4438 | 0.2090 | - 0.2297 | - 0.2563 | - 0.3030 | - 0.1922 | - 0.0553 | - 0.1688 | 0.2271 | 0.0233 | 1.0000 | |
| MOBILE | 0.1026 | 0.2236 | 0.2080 | - 0.0666 | 0.1906 | 0.2493 | 0.1604 | 0.0459 | 0.1134 | 0.0029 | - 0.0594 | 1.0000 |
| The numbers 1, 2, 3, 4, 5, 6, 7, 8, 9, 10, 11 and 12 refers to ROE, SIZE, LOAN, NPL, INEFF, GDP, BMG, ACCOUNT, CP, CC, INTERNET and MOBILE respectively. | ||||||||||||
Table 8 below shows both the statistical tolerance and the VIF measures associated with each variable:
| Table 8 Statistical Tolerance and The VIF | ||
| Variables | Tolerance | VIF |
| Bank size | 0.356 | 2.810 |
| Loans' growth rate | 0.372 | 2.685 |
| NPL ratio | 0.546 | 1.831 |
| Operation inefficiency | 0.372 | 2.688 |
| GDP growth rate | 0.703 | 1.423 |
| Broad money growth rate | 0.169 | 5.921 |
| Bank accounts' growth rate | 0.703 | 1.423 |
| Cashless payments | 0.242 | 4.128 |
| Credit cards' growth rate | 0.916 | 1.091 |
| Percentage of the population with access to the internet | 0.562 | 1.780 |
| Cellular mobile subscriptions growth rate | 0.892 | 1.121 |
Table 9 shows the reliability of our data using Cronbach’s alpha:
| Table 9 Reliability Statistics | |
| Variables | Alpha |
| Bank size | 67.88 |
| Loans' growth rate | 67.28 |
| NPL ratio | 72.47 |
| Operation inefficiency | 70.51 |
| GDP growth rate | 68.91 |
| Broad money growth rate | 65.12 |
| Bank accounts' growth rate | 71.25 |
| Cashless payments | 67.44 |
| Credit cards' growth rate | 74.50 |
| Percentage of the population with access to the internet | 74.64 |
| Cellular mobile subscriptions growth rate | 72.12 |
| Cronbach's Alpha | 72.36 |
As shown in table 8, all of our variables’ VIFs are lower than 10. Therefore, the data is within an acceptable range (Ringim et al., 2012). Moreover, table 9 shows a Cronbach’s alpha of 72.36, which indicates good reliability and consistency of the former (Taber, 2018).
The presence of heteroscedasticity is tested using the White and Breusch-Pagan tests 5 under the null hypothesis that the variance of the errors does not depend on the values of the independent variables. For its part, the presence of serial autocorrelation will be tested by using the Wooldridge test 6 under the null hypothesis of no serial autocorrelation. Table 10 below presents the test results:
| Table 10 Heteroscedasticity and Serial Autocorrelation Tests | ||
| Tests | P-value | Result |
| White test | 0.4371 | No heteroscedasticity |
| Breusch-Pagan test | 0.9791 | |
| Wooldridge test | 0.1114 | No serial autocorrelation |
As shown in table 10, White, Breusch-Pagan and Wooldridge’s tests all show a p-value greater than 0.05. Therefore, we fail to reject the aforementioned null hypotheses and conclude the absence of both heteroscedasticity and serial autocorrelation within our dataset.
Econometric Models
In order to emphasise the potential significant effect of digital systematic variables on commercial bank performance, we run two regression models. The first one investigates the impact of bank-specific and macroeconomic variables on commercial bank performance. The second adds the digital systematic variables to the first one.
a) First model:
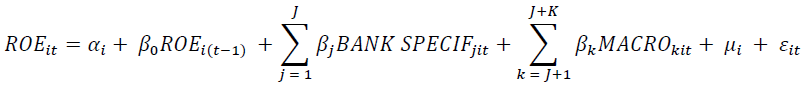
b) Second model:
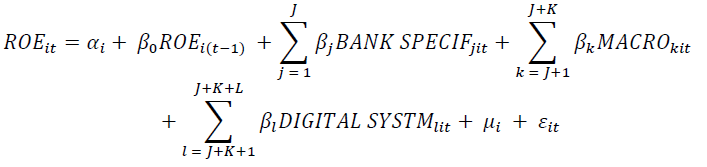
Where:
 denotes the model’s dependent variable: the return on equity;
 denotes the lagged dependent variable;
J denotes the number of bank-specific variables. There are 4 such variables in this case;
K denotes the number of macroeconomic variables. There are 2 such variables in this case;
L denotes the number of digital systematic variables. There are 6 such variables in this case;
 denotes a vector of bank-specific factors;
 denotes a vector of macroeconomic factors;
 denotes a vector of digital systematic factors;
β denotes a vector’s coefficients;
αi denotes the constant term;
μij denotes the unobservable effects;
εit denotes the error term.
In order to further investigate this regression, we focus on two main approaches: the fixed-effects and random-effects.
Fixed-effects Models


Where:
a. i and t are cross-section dimension and time indicators, respectively;
b. αi denotes the unknown intercept term;
c. μi denotes the error term.
Random-effects Models


Where:
a. i and t are cross-section dimension and time indicators, respectively;
b. αi denotes the unknown intercept term;
c. μit denotes the between-entity error;
d. εi denotes the within-entity error.
Empirical results summary
This subsection presents the results of both models.
First model
Table 11 shows the empirical results of the fixed-effects regression:
| Table 11 First Model, Fixed-Effects Results | |||||||
| Variables | [1] | [2] | [3] | [4] | [5] | [6] | [7] |
| lagROE | 0.1188528 (0.0936046) | 0.1239632 (0.0955747) | 0.1346447 (0.0887845) | 0.1361375 (0.0896087) | 0.1803689** (0.0811563) | 0.1662483** (0.0771923) | 0.1407606*** (0.756539) |
| SIZE | 0.0067676 (0.0191858) | 0.0028138 (0.0178589) | 0.0061022 (0.0193538) | 0.0136438 (0.0174479) | 0.0198794 (0.0167461) | 0.0087584 (0.0170975) | |
| LOAN | 0.1951007* (0.0666986) | 0.1932203* (0.0673961) | 0.170925* (0.0606292) | 0.1298301** (0.0599368) | 0.0546706 (0.0688982) | ||
| NPL | 0.1612635 (0.3471098) | 0.3853281 (0.3170688) | 0.4654002 (0.302525) | 0.4283599 (0.2928953) | |||
| INEFF | -0.4716913* (0.1348929) | -0.4643592* (0.1279761) | -0.4241457* (0.1252599) | ||||
| GDP | 0.426252** (0.1753091) | 0.4383** (0.1694994) | |||||
| BMG | 0.1718766** (0.0853474) | ||||||
| Constant | 0.1023149* (0.0116929) | -0.0537425 (0.4425743) | 0.0107599 (0.4113748) | -0.0767669 (0.4556941) | -0.0361622 (0.4078321) | -0.1952121 (0.3923047) | 0.033904 (0.3957726) |
| F-stat | 1.61 | 0.85 | 3.51 | 2.64 | 5.09 | 5.70 | 5.81 |
| Prob > F | 0.2103 | 0.4324 | 0.0224 | 0.0457 | 0.0009 | 0.0002 | 0.0001 |
| R-squared | 31.19% | 27.21% | 44.21% | 43.99% | 19.99% | 26.81% | 30.24% |
Notes: Table 11 presents the fixed-effects regression results of the relationship between the ROE and the explanatory variables. The coefficients are displayed with their respective standard deviation between brackets. The bold coefficients denote the statistically significant values. Asterisks indicate significance at the following risk errors: 1 percent (*), 5 percent (**) and 10 percent (***) level.
Table 12 shows the empirical results of the random-effects regression:
| Table 12 First Model, Random-Effects Results | |||||||
| Variables | [1] | [2] | [3] | [4] | [5] | [6] | [7] |
| lagROE | 0.334974* (0.0887228) | 0.2943043* (0.0898698) | 0.2851345* (0.080631) | 0.3684501* (0.077999) | 0.3919683* (0.081081) | 0.3688613* (0.0801844) | 0.3664006* (0.794721) |
| SIZE | 0.0074783 (0.0070504) | 0.0014753 (0.0062779) | 0.0017011 (0.0052973) | 0.0058177 (0.0065875) | 0.0047461 (0.0064609) | 0.0015839 (0.006799) | |
| LOAN | 0.2415986* (0.0644209) | 0.2629795* (0.0636507) | 0.2707176* (0.0640138) | 0.2306597* (0.066192) | 0.1464741 (0.0895397) | ||
| NPL | 0.3065103 (0.2504324) | 0.4834003 (0.301677) | 0.5489751*** (0.2968149) | 0.5967079** (0.296128) | |||
| INEFF | -0.1248007 (0.1189325) | -0.1268061 (0.116786) | -0.1299442 (0.11514) | ||||
| GDP | 0.4103321*** (0.2224323) | 0.4322809** (0.2209732) | |||||
| BMG | 0.1257694 (0.0910655) | ||||||
| Constant | 0.0792274* (0.0131616) | -0.0882715 (0.1613485) | 0.0194316 (0.141895) | -0.0203147 (0.1261553) | -0.0701237 (0.1346728) | -0.0542665 (0.1318292) | 0.011159 (0.13895) |
| Wald chi2 | 14.25 | 12.97 | 31.96 | 51.30 | 52.50 | 58.43 | 61.42 |
| Prob > chi2 | 0.0002 | 0.0015 | 0.0000 | 0.0000 | 0.0000 | 0.0000 | 0.0000 |
| R-squared | 31.19% | 31.91% | 48.29% | 50.15% | 51.22% | 54.39% | 56.13% |
Notes: Table 12 presents the random-effects GLS regression results of the relationship between the ROE and the explanatory variables. The coefficients are displayed with their respective standard deviation between brackets. The bold coefficients denote the statistically significant values. Asterisks indicate significance at the following risk errors: 1 percent (*), 5 percent (**) and 10 percent (***) level.
Second model
Table 13 shows the empirical results of the fixed-effects model:
| Table 13 Second Model, Fixed-Effects Results | ||||||
| Variables | [1] | [2] | [3] | [4] | [5] | [6] |
| lagROE | 0.1407606*** (0.0756539) | 0.1375817*** (0.0747742) | 0.1518372*** (0.0826434) | 0.1579029*** (0.0838351) | 0.1801277** (0.0857119) | 0.1810926** (0.086784) |
| SIZE | 0.0087584 (0.0170975) | 0.0146218 (0.0173847) | 0.0111091 (0.0194083) | 0.0097089 (0.0196837) | 0.0159213 (0.0203376) | 0.0163443 (0.0206201) |
| LOAN | 0.0546706 (0.0688982) | 0.0795476 (0.0702682) | 0.0844214 (0.0719011 | 0.0898146 (0.0729595) | 0.089408 (0.0726653) | 0.0919706 (0.0739408) |
| NPL | 0.4283599 (0.2928953) | 0.5463467*** (0.3009649) | 0.5583342*** (0.3053231) | 0.5468698*** (0.3082036) | 0.365837 (0.3451079) | 0.3489292 (0.3529607) |
| INEFF | -0.4241457* (0.1252599) | -0.4736003* (0.128519) | -0.4986952* (0.1426163) | -0.5115048* (0.1451502) | -0.4774421* (0.1475778) | -0.4748064* (0.1482522) |
| GDP | 0.4383* (0.1694994) | 0.4231222** (0.1677923) | 0.4115117** (0.1716812) | 0.3974535** (0.1744397) | 0.3559159*** (0.1774633) | 0.366265*** (0.1822959) |
| BMG | 0.1718766** (0.0853474) | 0.1519682*** (0.0854663) | 0.1060755 (0.1382394) | 0.1000747 (0.139626) | 0.0612466 (0.1431168) | 0.0641977 (0.1451003) |
| ACCOUNT | 0.1670411 (0.1171753) | 0.1528995 (0.1229507) | 0.1491626 (0.1240355) | 0.1293641 (0.1247323) | 0.1292086 (0.1262217) | |
| CP | 0.0006311 (0.0014847) | 0.0006063 (0.0014966) | 0.0014781 (0.0016729) | 0.001432 (0.0016962) | ||
| CC | -0.0408638 (0.0650922) | -0.03900013 (0.0648492) | -0.0379531 (0.0656999) | |||
| INTERNET | -0.0819814 (0.0714259) | -0.0817627 (0.0722813) | ||||
| MOBILE | -0.251424 (0.0761472) | |||||
| Constant | 0.033904 (0.3957726) | -0.0985109 (0.4018786) | -0.0085349 (0.4578277) | 0.034133 (0.4663147) | -0.0642976 (0.4722798) | -0.0745644 (0.4789263) |
| F-stat | 5.81 | 5.46 | 4.78 | 4.28 | 4.04 | 3.62 |
| Prob > F | 0.0001 | 0.0001 | 0.0002 | 0.0005 | 0.0006 | 0.0013 |
| R-squared | 30.24% | 36.03% | 28.93% | 27.89% | 40.15% | 40.40% |
Notes: Table 13 presents the fixed-effects regression results of the relationship between the ROE and the explanatory variables. The coefficients are displayed with their respective standard deviation between brackets. The bold coefficients denote the statistically significant values. Asterisks indicate significance at the following risk errors: 1 percent (*), 5 percent (**) and 10 percent (***) level.
Table 14 shows the empirical results of the random-effects model:
| Table 14 Second Model, Random-Effects Results | ||||||
| Variables | [1] | [2] | [3] | [4] | [5] | [6] |
| lagROE | 0.3664006* (0.794721) | 0.3476291* (0.0783861) | 0.2106218** (0.0846329) | 0.2084836** (0.843888) | 0.1901576** (0.0819248) | 0.1892179** (0.0826897) |
| SIZE | 0.0015839 (0.006799) | 0.0044168 (0.0068306) | 0.0065552 (0.0063207) | 0.0069898 (0.0063125) | 0.0126773*** (0.0066803) | 0.012893*** (0.0067566) |
| LOAN | 0.1464741 (0.0895397) | 0.177544** (0.0892191) | 0.1243611 (0.0838469) | 0.1330701 (0.0839353) | 0.1106753 (0.0817253) | 0.1137299 (0.0827255) |
| NPL | 0.4834003 (0.301677) | 0.6734646** (0.29261) | 0.3246202 (0.2918423) | 0.3438618 (0.2914209) | 0.3559218 (0.2813244) | 0.3517014 (0.2840114) |
| INEFF | -0.1248007 (0.1189325) | -0.2178546*** (0.1227208) | -0.2200466*** (0.1128793) | -0.2322563** (0.1130381) | -0.314454* (0.116063) | -0.3094039* (0.1176154) |
| GDP | 0.4322809** (0.2209732) | 0.406789*** (0.2164755) | 0.4697934** (0.200152) | 0.4425291** (0.2009642) | 0.36041*** (0.1979538) | 0.3752555*** (0.2022843) |
| BMG | 0.1257694 (0.0910655) | 0.0780363 (0.2164755) | 0.3611973* (0.1252692) | 0.3709547* (0.125172) | 0.325827* (0.1227502) | 0.3248164* (0.1238782) |
| ACCOUNT | 0.2461916*** (0.1369653) | 0.2586356** (0.1260433) | 0.2714387** (0.1261532) | 0.2746839** (0.1217666) | 0.2719251** (0.1230102) | |
| CP | -0.0031344* (0.001014) | -0.0033077* (0.0010223) | -0.0027924* (0.0010174) | -0.0028011* (0.0010268) | ||
| CC | -0.0818209 (0.0720504) | -0.065531 (0.0699808) | -0.0645956 (0.0706417) | |||
| INTERNET | -0.0616167** (0.0296846) | -0.0616043** (0.0299528) | ||||
| MOBILE | -0.0383773 (0.0826435) | |||||
| Constant | 0.011159 (0.13895) | -0.0312441 (0.1378627) | -0.0338758 (0.1268073) | -0.0337685 (0.12641) | -0.0798367 (0.1240066) | -0.0867181 (0.1260014) |
| Wald chi2 | 61.42 | 79.69 | 89.35 | 91.2 | 102.21 | 100.6 |
| Prob > chi2 | 0.0000 | 0.0000 | 0.0000 | 0.0000 | 0.0000 | 0.0000 |
| R-squared | 56.13% | 62.90% | 66.01% | 66.96% | 69.91% | 70.06% |
Notes: Table 14 presents the random-effects GLS regression results of the relationship between the ROE and the explanatory variables. The coefficients are displayed with their respective standard deviation between brackets. The bold coefficients denote the statistically significant values. Asterisks indicate significance at the following risk errors: 1 percent (*), 5 percent (**) and 10 percent (***) level.
Retained Model
We use Hausman’s test7 (Hausman, 1978) under the null hypothesis that the random-effects model is most appropriate for this empirical study. Our result shows a p-value of 0.6985. Therefore, we fail to reject the null hypothesis, and conclude that the random-effects regression is the most appropriate empirical approach. We rely on it for results interpretation in the next section.
Discussion of the Results
According to the results, the consideration of the digital systematic factors significantly improves the explanatory power of the model.
The improvement of the R-squared for the second model could be explained by an implicit COVID-19 effect. During the subsequent economic recession in 2020, digitalisation gained a significant importance in the financial landscape. This is especially true for banking services due to the rise in power of FinTech firms and digital financial solutions.
The following subsections elaborate on the statistically significant results per variable type: bank-specific, macroeconomic, and digital systematic variables.
The impact of Bank-specific Variables
The lagged dependent ROE has a positive impact on commercial bank performance. It is statistically significant at the 5% risk error level. As mentioned in the previous section, this result means that a change in commercial bank performance during one year affects next year’s performance to a degree of 18.92%.
Our research shows that bank size is statistically significant at the 10% risk error level, and has a positive impact on commercial bank performance. This finding is congruent with many authors’ research (Bonin et al., 2005; Athanasoglou et al., 2006; Jara-Bertin et al., 2014; Menicucci & Paolucci, 2016; Bahyaoui, 2017; Chouikh & Blagui, 2017; Elouali & Oubdi, 2018; Almoneef & Samontaray, 2019; Akoi & Andrea, 2020; Jreisat & Bawazir, 2021). This would suggest that large-sized commercial banks outperform smaller ones within the MENA region. The former has better access to the market, as well as the ability to leverage economies of scale. This result is observed in all of the sampled countries, except Jordan.
The literature overwhelmingly suggests that operation inefficiency has a negative impact on commercial bank performance. Our research confirms this assertion (Pasiouras & Kosmidou, 2007; Bahyaoui, 2017; Otero et al., 2020; Isnurhadi et al., 2021). It is statistically significant at the 1% risk error level. Higher operation inefficiency suggests that a bank’s operation income is not sufficient to cover its operation expenses. It is evident that more operation inefficiency results in poor performance. This result is observed in all of the sampled countries, except Jordan.
The Impact of Macroeconomic Variables
The GDP growth rate has a positive impact on bank performance (Sufian & Habibullah, 2009; Jara-Bertin et al., 2014; Caporale et al., 2015; Chen & Lu, 2020; Jreisat & Bawazir, 2021). It is statistically significant at the 10% risk error level. GDP is always used as a metric that indicates the status of an economy’s business cycle. The obtained result could be explained by the consequences of a positive GDP growth rate: economic agents tend to perform better during periods of economic expansion and growth in comparison to times of economic abysses. This result is observed in Morocco, Jordan, Tunisia and the UAE.
Lastly, the broad money growth rate has a positive impact on commercial bank performance (Ifionu & Akinpelumi, 2015; Suoyai et al., 2018). It is statistically significant at the 1% risk error level. An increase in broad money usually results in higher interest rates. The latter incentivises bank customers to increase their savings. As a result, commercial banks accumulate more funds that they can use for investments. This result is observed in Turkey.
The Impact of Digital Systematic Variables
Cashless payments have a negative impact on commercial bank performance. They are statistically significant at the 5% risk error level. However, its coefficient of -0.0028 is quite low8. While a few authors have affirmed that cashless payments are beneficial to commercial bank performance (Mohammed et al., 2022), our research shows the opposite (Lu et al., 2022). This result has three possible explanations: the low financial and digital literacy and inclusion of the population in the MENAP region. This causes resistance to the shift from using only fiat money to adopting digital means of payment. Another explanation could be the lack of sufficient technological infrastructures to support cashless payment channels. This result is observed in Jordan, the UAE and Pakistan.
The bank accounts’ growth rate has a positive impact on commercial bank performance (Shihadeh, 2021). It is statistically significant at the 5% risk error level. Bank accounts are the underlying vehicle through which banks offer their services to their customers. When more bank accounts are created, banks can reach and offer their services to a larger customer base. A higher bank accounts’ growth rate suggests more financial inclusion and a potentially higher usage rate of banking services. This result is observed in the UAE.
The percentage of the population with access to the internet has a negative impact on commercial bank performance. It is significant at the 5% risk error level with a low coefficient of -0.06169. This is observed in Turkey, Tunisia, Egypt and Pakistan. This could be explained by the digital paradox within the MENAP region (Cusolito et al., 2022) : the region’s access to the internet is high compared to what would be expected based on the GDP levels of its countries. However, the usage of the internet to access financial or banking services is relatively lower. Previous research shows that the percentage of the population with access to the internet has a positive impact on commercial bank performance (Malhotra & Singh, 2009; Tunay et al., 2015). However, it is true only when the bank’s digital services are frequently used. On the one hand, banks undertake significant investments to set up the proper infrastructure to offer banking services on the internet. On the other hand, browsing and accessing such services is free of charge. Therefore, MENAP commercial banks currently do not benefit from a higher percentage of the population with access to the internet.
Conclusion
The topic of determinants of commercial bank performance is of great importance and has gained considerable academic interest. However, there is a noticeable lack of research on emerging markets, such as the MENAP countries. This paper aims to bridge this gap by studying the determinants of the commercial bank performance of 56 banks across 7 MENAP countries between 2015 and 2022.
Using a panel data analysis and a random-effects model, this paper documents that bank size, operation inefficiency, GDP growth rate, broad money growth rate, bank accounts growth rate, cashless payments, and the percentage of the population with access to the internet are the main determinants of commercial bank performance in the MENAP region.
We conclude that commercial bank performance in the MENAP hinges mainly on digital and macroeconomic factors. The impact of the last-mentioned cannot be completely mitigated by banks’ strategies and management. However, digital services can be adequately marketed to increase the digital and financial literacy of the clientele. Our findings hint at the fact that improving the MENAP region’s financial and digital literacy and inclusion could improve the accessibility and adoption of digital banking services. It is a critical research opportunity that could further complement the obtained results.
Our findings provide new evidence that complements previous researchers’ endeavours. Indeed, banking professionals and policymakers will benefit from recent and up-to-date research that could assist their decision-making and strategising processes. In particular, professionals could direct their strategic endeavours towards optimising the main performance determinants. This includes the adequate management of the bank’s assets, marketing of its services and devising strategies to increase the return on investment of cashless payment channels and infrastructures.
This research sheds new light on the impact of digitalisation in the banking sector of the MENAP. It is a crucial topic to banks that warrants further research and interest. If the current literature on digitalisation and banking performance is expected to be enriched by this paper’s findings, it is important to undertake more research on the impact of digital driven factors on bank performance especially through considering data from more countries and over larger periods of time.
Declaration of Interest Statement
The authors declare no conflict of interest.
Funding statement
This research has not received any specific funding.
End Notes
1 Given the lack of details regarding the number of bank accounts opened specifically through digital means, we took the growth rate of bank accounts as a digital systematic proxy. Moreover, bank accounts are the underlying vehicle through which banks offer digital banking services. ;
2 Cashless payments include transactions conducted through digital means of payment, such as credit cards.
3 The statistical tolerance and the VIF both provide a measure of collinearity between the independent variables.
4 Cronbach's alpha is a statistic used to assess the reliability and internal consistency of a dataset.
5 The commands imtest, white and hettest on STATA test for heteroscedasticity using White’s test and Breusch-Pagan’s test, respectively.
6 The command xtserial on STATA tests for serial autocorrelation, which uses Wooldridge’s test for serial autocorrelation.
7 On STATA, we use the xtreg command twice with the fixed-effects option, fe. Then we use the estimates store fixed command to store the results. We do the same thing for the random-effects model by using xtreg again with the re option, followed by the estimates store random command. After storing each iteration, we run the command hausman fixed random to test under the null hypothesis that the random-effects model is the most appropriate choice.
8 The low yet statistically significant coefficients could be explained by the presence of two countries with contrasted levels of development within our sample, i.e. the UAE and Pakistan.
References
Akoi, S., & Andrea, S. R. (2020). The determinants of the performance of the banking sector: evidence from an emerging market. The Middle East International Journal for Social Sciences, 2(4), 192–202.
Indexed at, Google Scholar, Cross Ref
Alam, S. M. S., Chowdhury, M. A. M., & Razak, D. B. A. (2021). Research evolution in banking performance: a bibliometric analysis. Future Business Journal, 7(1), 1–19.
Indexed at, Google Scholar, Cross Ref
Al?Matari, E. M. (2023). The determinants of bank profitability of GCC: The role of bank liquidity as moderating variable - Further analysis. International Journal of Finance & Economics, 28(2), 1423–1435.
Indexed at, Google Scholar, Cross Ref
Almoneef, A., & Samontaray, D. P. (2019). Corporate governance and firm performance in the Saudi banking industry. Banks and Bank Systems, 14(1), 147–158.
Indexed at, Google Scholar, Cross Ref
Alper, D., & Anbar, A. (2011). Bank Specific and Macroeconomic Determinants of Commercial Bank Profitability: Empirical Evidence from Turkey. Business and Economics Research Journal, 2(2), 139–152.
Anarfi, D., Abakah, E. J. A., & Boateng, E. (2016). Determinants of Bank Profitability in Ghana: New Evidence. Asian Journal of Finance & Accounting, 8(2), 194.
Indexed at, Google Scholar, Cross Ref
Athanasoglou, P. P., Delis, M. D., & Staikouras, C. K. (2006). Determinants of bank profitability in the south eastern European region. Journal of Financial Decision Making, 2(2), 1–18.
Indexed at, Google Scholar, Cross Ref
Azzabi, A., & Lahrichi, Y. (2023). Bank Performance Determinants: State of the Art and Future Research Avenues. New Challenges in Accounting and Finance, 9, 26–41.
Indexed at, Google Scholar, Cross Ref
Bahyaoui, S. (2017). Les Déterminants Idiosyncratiques De La Performance Bancaire Au Maroc?: Analyse Sur Données De Panel. European Scientific Journal, 13(13), 57–77.
Indexed at, Google Scholar, Cross Ref
Berger, A. N., & Bouwman, C. H. S. (2013). How does capital affect bank performance during financial crises? Journal of Financial Economics, 109(1), 146–176.
Indexed at, Google Scholar, Cross Ref
Berger, A. N., & Mester, L. J. (1997). Inside the black box: What explains differences in the efficiencies of financial institutions? Journal of Banking & Finance, 21(7), 895–947.
Indexed at, Google Scholar, Cross Ref
Bonin, J. P., Hasan, I., & Wachtel, P. (2005). Bank performance, efficiency and ownership in transition countries. Journal of Banking & Finance, 29(1), 31–53.
Indexed at, Google Scholar, Cross Ref
Caporale, G. M., Rault, C., Sova, A. D., & Sova, R. (2015). Financial Development and Economic Growth: Evidence from 10 New European Union Members. International Journal of Finance & Economics, 20(1), 48–60.
Indexed at, Google Scholar, Cross Ref
Chen, H.-M., & Tseng, C.-H. (2005). The performance of marketing alliances between the tourism industry and credit card issuing banks in Taiwan. Tourism Management, 26(1), 15–24.
Indexed at, Google Scholar, Cross Ref
Chenini, H., & Jarboui, A. (2018). Analysis of the Impact of Governance on Bank Performance: Case of Commercial Tunisian Banks. Journal of the Knowledge Economy, 9(3), 871–895.
Indexed at, Google Scholar, Cross Ref
Chouikh, A., & Blagui, Y. (2017). The Determinants of Bank Performance: The Case of Tunisian Listed Banks. Journal of Finance and Accounting, 5(2), 53–60.
Indexed at, Google Scholar, Cross Ref
Coryanata, I., Ramli, E. H., Puspita, L. M. N., & Halimatusyadiah, H. (2023). Digitalization of Banking and Financial Performance of Banking Companies. International Journal of Social Service and Research, 3(2), 366–371.
Indexed at, Google Scholar, Cross Ref
Cusolito, A. P., Gévaudan, C., Lederman, D., & Wood, C. (2022). The Upside of Digital for the Middle East and North Africa: How Digital Technology Adoption Can Accelerate Growth and Create Jobs. The World Bank.
Indexed at, Google Scholar, Cross Ref
Dang, V. D. (2019). The effects of loan growth on bank performance: Evidence from Vietnam. Management Science Letters, 899–910.
Derbali, A. (2021). Determinants of the performance of Moroccan banks. Journal of Business and Socio-Economic Development, 1(1), 102–117.
Indexed at, Google Scholar, Cross Ref
Dietrich, A., & Wanzenried, G. (2014). The determinants of commercial banking profitability in low-, middle-, and high-income countries. The Quarterly Review of Economics and Finance, 54(3), 337–354.
Elouali, J., & Oubdi, L. (2018). Factors Affecting Bank Performance: Empirical Evidence from Morocco. European Scientific Journal, 14(34).
Indexed at, Google Scholar, Cross Ref
Fahlenbrach, R., Prilmeier, R., & Stulz, R. (2016). Why Does Fast Loan Growth Predict Poor Performance for Banks?
Indexed at, Google Scholar, Cross Ref
Forcadell, F. J., Aracil, E., & Úbeda, F. (2020). The Impact of Corporate Sustainability and Digitalization on International Banks’ Performance. Global Policy, 11(S1), 18–27.
Indexed at, Google Scholar, Cross Ref
García-Marco, T., & Robles-Fernández, M. D. (2008). Risk-taking behaviour and ownership in the banking industry: The Spanish evidence. Journal of Economics and Business, 60(4), 332–354.
Indexed at, Google Scholar, Cross Ref
Ghosh, A. (2015). Banking-industry specific and regional economic determinants of non-performing loans: Evidence from US states. Journal of Financial Stability, 20, 93–104.
Indexed at, Google Scholar, Cross Ref
Hausman, J. A. (1978). Specification Tests in Econometrics. Econometrica, 46(6), 1251.
Indexed at, Google Scholar, Cross Ref
Ifionu, E., & Akinpelumi, O. F. (2015). Macroeconomic Variables and Money Supply: Evidence from Nigeria. African Research Review, 9(4), 288.
Indexed at, Google Scholar, Cross Ref
Islam, Md. S., & Nishiyama, S.-I. (2016). The determinants of bank net interest margins: A panel evidence from South Asian countries. Research in International Business and Finance, 37, 501–514.
Indexed at, Google Scholar, Cross Ref
Isnurhadi, I., Adam, M., Sulastri, S., Andrianna, I., & Muizzuddin, M. (2021). Bank Capital, Efficiency and Risk: Evidence from Islamic Banks. The Journal of Asian Finance, Economics and Business, 8(1), 841–850.
Indexed at, Google Scholar, Cross Ref
Jara?Bertin, M., Arias Moya, J., & Rodríguez Perales, A. (2014). Determinants of bank performance: evidence for Latin America. Academia Revista Latinoamericana de Administración, 27(2), 164–182.
Indexed at, Google Scholar, Cross Ref
Jarbou, L., Abu-Serdaneh, J., & Atmeh, M. (2018). Ownership Structure And Conservatism’s Impact On Jordanian Bank’s Financial Performance. The Journal of Developing Areas, 52(4), 183–197.
Indexed at, Google Scholar, Cross Ref
Jreisat, A., & Bawazir, H. (2021). Determinants of Banks Profitability in the Middle East and North Africa Region. The Journal of Asian Finance, Economics and Business, 8(6), 701–711.
Indexed at, Google Scholar, Cross Ref
Kupiec, P., Lee, Y., & Rosenfeld, C. (2017). Does bank supervision impact bank loan growth? Journal of Financial Stability, 28, 29–48.
Indexed at, Google Scholar, Cross Ref
Lu, M. P., Ooi, C.-A., Lee, K. T., & Kossim, Z. (2022). Does Electronic Payment Services Create Value to Bank Performance? Evidence from Southeast Asia. Asian Academy of Management Journal of Accounting and Finance, 18(2).
Indexed at, Google Scholar, Cross Ref
Malhotra, P., & Singh, B. (2009). The Impact of Internet Banking on Bank Performance and Risk: The Indian Experience. Eurasian Journal of Business and Economics, 2(4), 43–62.
Menicucci, E., & Paolucci, G. (2016). The determinants of bank profitability: empirical evidence from European banking sector. Journal of Financial Reporting and Accounting, 14(1), 86–115.
Indexed at, Google Scholar, Cross Ref
Modigliani, F., Rasche, R., & Cooper, J. P. (1970). Central Bank Policy, the Money Supply, and the Short-Term Rate of Interest. Journal of Money, Credit and Banking, 2(2), 166.
Indexed at, Google Scholar, Cross Ref
Mohammed, Z., Ibrahim, U. A., & Muritala, T. A. (2022). Effect of Payments System Innovations on the Financial Performance of Commercial Banks in Nigeria. Journal of Service Science and Management, 15(01), 35–53.
Indexed at, Google Scholar, Cross Ref
Naili, M., & Lahrichi, Y. (2022). Banks’ credit risk, systematic determinants and specific factors: recent evidence from emerging markets. Heliyon, 8(2), e08960.
Indexed at, Google Scholar, Cross Ref
Otero, L., Razia, A., Cunill, O. M., & Mulet-Forteza, C. (2020). What determines efficiency in MENA banks? Journal of Business Research, 112, 331–341.
Indexed at, Google Scholar, Cross Ref
Pasiouras, F., & Kosmidou, K. (2007). Factors influencing the profitability of domestic and foreign commercial banks in the European Union. Research in International Business and Finance, 21(2), 222–237.
Indexed at, Google Scholar, Cross Ref
Potapova, E. A., Iskoskov, M. O., & Mukhanova, N. V. (2022). The Impact of Digitalization on Performance Indicators of Russian Commercial Banks in 2021. Journal of Risk and Financial Management, 15(10), 452.
Indexed at, Google Scholar, Cross Ref
Rajan, R. G. (1994). Why Bank Credit Policies Fluctuate: A Theory and Some Evidence. The Quarterly Journal of Economics, 109(2), 399–441.
Indexed at, Google Scholar, Cross Ref
Ringim, K. J., Razalli, M. R., & Hasnan, N. (2012). A Framework of Business Process Re-engineering Factors and Organizational Performance of Nigerian Banks. Asian Social Science, 8(4).
Indexed at, Google Scholar, Cross Ref
Saleh, I., & Abu Afifa, M. (2020). The effect of credit risk, liquidity risk and bank capital on bank profitability: Evidence from an emerging market. Cogent Economics & Finance, 8(1).
Indexed at, Google Scholar, Cross Ref
Sebayang, P. (2020). The Impact of the Capital Adequacy Ratio, Non-Performing Loan Against to Return on Equity (Case Study Private Bank in Indonesia). SHS Web of Conferences, 76, 01035.
Indexed at, Google Scholar, Cross Ref
Seiford, L. M., & Zhu, J. (1999). Profitability and Marketability of the Top 55 U.S. Commercial Banks. Management Science, 45(9), 1270–1288.
Indexed at, Google Scholar, Cross Ref
Shihadeh, F. (2021). Financial inclusion and banks’ performance: Evidence from Palestine. Investment Management and Financial Innovations, 18(1), 126–138.
Indexed at, Google Scholar, Cross Ref
Sinkey, J. F., & Nash, R. C. (1993). Assessing the riskiness and profitability of credit-card banks. Journal of Financial Services Research, 7(2), 127–150.
Indexed at, Google Scholar, Cross Ref
Sufian, F., & Habibullah, M. S. (2009). Bank specific and macroeconomic determinants of bank profitability: Empirical evidence from the China banking sector. Frontiers of Economics in China, 4(2), 274–291.
Indexed at, Google Scholar, Cross Ref
Suoyai, E., Tema, L., Boloekeye, M., & George, C. (2018). Impact of Money Supply on Some Macroeconomic Variables on The Nigerian Economy. Journal of Business Management and Economic Research, 2(5), 32–46.
Indexed at, Google Scholar, Cross Ref
Taber, K. S. (2018). The Use of Cronbach’s Alpha When Developing and Reporting Research Instruments in Science Education. Research in Science Education, 48(6), 1273–1296.
Indexed at, Google Scholar, Cross Ref
Tunay, K. B., Tunay, N., & Akhisar, ?. (2015). Interaction Between Internet Banking and Bank Performance: The Case of Europe. Procedia - Social and Behavioral Sciences, 195, 363–368.
Indexed at, Google Scholar, Cross Ref
Wang, H., Zheng, L. J., Xu, X., & Hung, T. H. B. (2022). Impact of Financial Digitalization on Organizational Performance. Journal of Global Information Management, 30(1), 1–35.
Indexed at, Google Scholar, Cross Ref
Received: 16-May-2024, Manuscript No. AAFSJ-24-14825; Editor assigned: 18-May-2024, Pre QC No. AAFSJ-24-14825 (PQ); Reviewed: 03- Jun-2024, QC No. AAFSJ-24-14825; Revised: 14-Jun-2024, Manuscript No. AAFSJ-24-14825 (R); Published: 30-Jul-2024